Source-rock Potential of the Middle to Late Miocene
Turbidite in Majalengka Sub-basin, West Java Indonesia:
Related to Magmatism and Tectonism
Budi Muljana, Koichiro Watanabe, Mega F. Rosana
Journal of
Novel Carbon Resource Sciences
Reprinted from
Kyushu University Global COE Program Journal of Novel Carbon Resource Sciences, Vol. 6, pp. 15-23, Sep. 2012
Source-rock Potential of the Middle to Late Miocene Turbidite
in Majalengka Sub-basin, West Java Indonesia: Related to
Magmatism and Tectonism
Budi Muljana
*1,*2, Koichiro Watanabe
*1, Mega F. Rosana
*3*1Graduate School of Engineering, Kyushu University
*2Laboratory of Stratigraphy, Faculty of Geology, Padjadjaran University, Indonesia *3Laboratory of Ptrology and Mineralogy, Faculty of Geology, Padjadjaran University, Indonesia
Majalengka sub-basin is located at the middle part of West Java. This basin, regionally, is part of Bogor trough, a back-arc basin. The basin is sedimentary basin formed during the early Tertiary. Getting into the middle to late Miocene, sedimentation in this basin was dominated by a turbidite derived from multiple-source, Northwest Java basin in the north and the South Mountain in the south. The occurrence of organic matter in this basin is estimated from the north sedimentation source. Based on rock-eval pyrolysis and vitrinite relectance methods shows that the hydrocarbon source potential is dominated by immature to mature and gas prone type III kerogen. This kerogen type is mainly composed as a product from terrestrial material deposited into deltaic to shallow marine. Preservation of organic material in turbidite is interpreted as results from resedimentation or sedimentation transportation through the channel systems. In addition, magmatism and tectonism is the main parameter to generate organic matter become hydrocarbon.
(Received December 15, 2011; accepted April 12, 2012)
1. Introduction
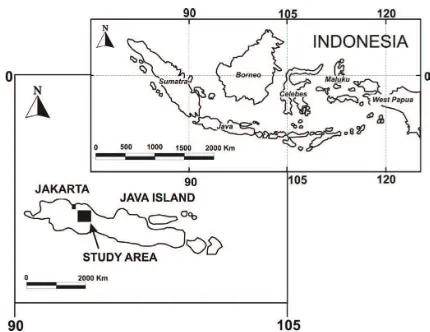
Related to the increase on the oil-exploration in Indonesia for decades, especially within the new hydrocarbon basin, the depression zone in the middle part of Java’s island has been enhanced. The study area, the Majalengka sub-basin, is located in the western part of this zone. This basin is bounded by two main the geologic province, the Northwest Java basin in the north as a proliic basin for hydrocarbon resources in Indonesia and the Southern Mountain in the south as a remnant magmatic-belt in West Java.
Furthermore, this basin was illed by approximately more than the 4 km thick of turbidite, which was deposited during the middle to late Miocene. During this time the magmatic accompanied to tectonic evolved very active. According to K-Ar ages of the magmatic rocks in Java during the Tertiary, divided the volcanic activity into two stages1). The irst stages belong to 40–18
Ma (Eocene-Oligocene to the early Miocene), while the second stage 12-2 Ma (the middle Miocene to the lower Pliocene). The break-magmatism during 18-12 Ma (the early to middle Miocene) occurred. Meanwhile, the other researcher mentioned that the tectonic events in West Java tend to increase toward the late Tertiary2).
The geologic events, magmatism and tectonics, are two main parameters to be noted of the oil-exploration strategy. Moreover, the preservation of organic matter to generate the hydrocarbon source-rock within turbidite is considered insigniicant. However, several researchers have reported that the oil-seeps have been found widely as long as the sedimentary rocks2-3). As well as, the irst
well-exploration in Indonesia drilled by two Dutch in 1871 is located at the eastern part in this area and
considered the irst oil-exploration in Indonesia. That indicates that the hydrocarbon-generation in this sub-basin has occurred.
The source-rocks evaluation in an area against the geologic effect is required in the oil-exploration. The purpose of this study is to provide original of source-rock determination and sandstone composition for assessing the effects of magmatism and tectonics, from the turbidite in the Majalengka sub-basin. The sedimentary rocks focused on the age interval during the middle to late Miocene, especially during the second stage magmatic arc events1). Finally, this study will provide implications
for hydrocarbon exploration in Majalengka sub-basin. River in the west to Kuningan in the east, near the lank of Ciremai Mountain covering about 715 km2.Many
researchers have studied the geology of Majalengka sub-basin and its adjacent areas since the irst half of the 20th
century3-7). Some of study results were concluded and
well documented2). The database, based on outcrop data,
Journal of Novel Carbon Resource Sciences, Vol.6, Sep. 2012
to deep marine. Provenance studies indicate that the source sediment is derived from multi-source sediments, from the north and south7).
3. Methodology
Rock-Eval analysis and vitrinite relectance (VR) were methods used in the evaluation of hydrocarbon potential in this study. Fourty-ive source rock samples consist of shale and claystone, were analyzed at the Geochemical Laboratory at the Institute of Technology, Bandung, Indonesia. The shale samples were characterized by their dark color and high carbonaceous content. Meanwhile, the claystone is indicated by black to dark-grey in color, occasionally is found coal fragments.
Therefore, most samples were collected on the basis of the ield investigation of turbidite. Basically, this sedimentary rock according to Mutti and Ricci Lucci facies’s classiication could be divided into two parts, lower and upper parts8).
This lithofacies is widely distributed in the middle part of the study area and according to this classiication; it could be classiied into Facies E (Fig. 2). This facies nomenclature is used for submarine fan environment and associated turbidite facies9). This analysis was done to
make a fundamental understanding of the hydrocarbon source rock potential, which is divided by three critical factors:
1. Source rock generative potential to decide the quantity of kerogen (Total Organic Carbon and S2 values). 2. Type of organic matter to determine the hydrocarbon
type, oil or gas types.
3. Level of thermal maturation (Vitrinite relectance and Tmax values) to determine the maturation level.
This analysis was conducted by using DELSI-Nermag Rock Eval II-Plus TOC machine and performed in three stages. The irst stage, the 100 mg of sample was heated in the oven until 300 oC during three minutes.
This heating process was conducted within the inert-Helium condition. In this stage was resulted in the
S1 discharged of hydrocarbon-free, or normally was called as an evaporation stage. Entering second stage, the temperature was increased from 300 oC until 550 oC during ten minutes. The cracking stage of organic
material was begun, which as results of the heavy-hydrocarbon (C40) evaporation. After the temperature
peak achieved, the kerogen maturation has begun and was considered as a S2 peak, or normally called as a Tmax
value. The last stage is the CO2 released in cooling down
pyrolysis, where the temperature decreases from 390 oC
to 300 oC and the S3 released.
Moreover, thirty-four of sandstone samples were collected from the ield for geochemical analysis in laboratory. X-ray luorescence (XRF) analysis of the major and trace element was conducted at Economic Geology laboratory, Kyushu University, Japan. Bulk chemical composition of sedimentary rock was analyzed using a Rigaku RIX 3100 X-ray (50 kv 80 mA) Fluorescence (XRF) machine. Pressed-powder pellets, which 10 mm diameter to determine of sediment composition, were prepared. Loss on ignition (LOI) was determined by evaporating the H2O content at 105 oC for
1.5 hours and then followed by heating to reach 500 oC
during half hours and 950 oC for 1 hour. The LOI value,
the percentage loss in sample weight less the H2O less,
was calculated.
Both samples were collected at same location, but in different interval of stratigraphic sequence of turbidite.
Fig. 1 Study area is located at Majalengka, West Java, Indonesia.
Source-rock Potential of the Middle to Late Miocene Sedimen Turbidite in Majalengka Sub-basin, West Java Indonesia
potential, organic matter type, and level of organic maturation, by use of total organic carbon content (TOC) and Rock-Eval pyrolysis including vitrinite relectance (VR) analyses.
Source samples are taken from two interval layers i.e. Cisaar-shale and lower Cinambo Formation. The results of analysis were summarized in Table 1.
4. Results
4.1 Characteristics of source rocks
The presence of organic matter as a component of sedimentary rock indicates the possibility of hydrocarbon occurrence even if it is present in very low concentration. Three parameters are used to determinate and evaluate organic matter in this study i.e. source generative
Table 1 Results of Rock-Eval pyrolysis and Vitrinite relectance.
No ID Lithology Rock eval Pyrolisis S1+S2 S2/S3 PI HI OI Thermal M Tmaks Latitude Longitude TOC S1 S2 S3 (PY) VR SCI
1 CMK 23 108.21 -6.90 SHALE 0.56 0.03 0.47 - 0.50 - 0.04 88.00 - 0.44 3.30 433 2 CNB 123 108.21 -6.90 SHALE 0.77 0.06 0.58 - 0.64 - 0.08 80.00 - 0.46 5.62 442 3 CNB 124 108.21 -6.91 SHALE 0.41 0.01 0.29 - 0.30 - 0.03 77.00 - 0.47 - 429 4 CNB 125 108.21 -6.92 SHALE 0.97 0.06 1.05 - 1.11 - 0.05 110.00 - 0.45 - 437 5 CNB 126 108.21 -6.92 SHALE 0.63 0.04 0.56 - 0.60 - 0.07 95.00 - 0.40 3.40 430 6 CNB 127 108.22 -6.91 SHALE 0.70 0.02 0.60 - 0.62 - 0.03 88.00 - 0.50 4.60 439 7 CSR 314 108.22 -6.91 SHALE 1.60 0.03 1.71 - 1.74 - 0.16 112.00 - 0.72 6.76 460 8 CSR 303 108.23 -6.92 SHALE 0.34 0.02 0.16 - 0.18 - 0.13 50.00 - 0.59 - 432 9 CSR 306 108.21 -6.90 SHALE 0.51 0.03 0.26 - 0.29 - 0.10 55.00 - 0.55 5.60 444 10 CSR 321 108.21 -6.90 SHALE 0.66 0.02 0.63 - 0.65 - 0.19 100.00 - 0.56 - -11 CSR 333 108.22 -6.91 SHALE 1.15 0.01 0.42 - 0.43 - 0.26 40.00 - 0.55 - -12 CSR 336 108.21 -6.91 SHALE 0.46 0.00 0.00 - - - 0.54 - -13 CSR 335 108.21 -6.90 SHALE 0.30 0.00 0.00 - - - 0.58 - -14 CLT 45 108.21 -6.90 CLAYSTONE 0.71 0.00 0.00 - - - 0.90 - -15 CLT 36 108.21 -6.90 CLAYSTONE 1.15 0.23 1.20 - 1.43 - 0.20 85.00 - 1.06 7.90 472 16 CLT 19 108.21 -6.90 SHALE 0.70 0.00 0.00 - - - 0.68 - -17 CLT 20 108.24 -6.90 SHALE 0.71 0.00 0.00 - - - 0.69 - -18 CLT 38 108.23 -6.92 CLAYSTONE 1.22 0.19 1.17 - 1.36 - 0.18 84.00 - 0.98 6.98 470 19 CSL 201 108.23 -6.92 SHALE 0.66 0.00 0.00 - - - 0.97 - -20 CSL 209 108.24 -6.92 SHALE 0.80 0.00 0.00 - - - 0.89 - -21 CMT 12 108.24 -6.92 SHALE 1.37 0.50 1.23 - 1.73 - 0.28 90.00 - 1.09 - 480 22 CMT 7 108.24 -6.91 SHALE 1.39 0.40 1.29 - 1.69 - 0.23 95.00 - 1.00 - 482 23 CMT 8 108.24 -6.91 SHALE 1.43 0.46 1.30 - 1.76 - 0.25 95.00 - 0.92 6.76 481 24 CMT 9 108.24 -6.91 SHALE 1.41 0.05 1.33 - 1.38 - 0.25 100.00 - 1.08 7.28 481 25 CMT 13 108.23 -6.90 SHALE 1.32 0.46 1.19 - 1.65 - 0.29 95.00 - 1.13 6.81 486 26 CLT 18 108.21 -6.90 SHALE 0.71 0.00 0.00 - - - 0.89 - -27 BTM 23 108.21 -6.91 CLAYSTONE 1.49 0.29 1.66 - 1.95 - 0.16 97.00 - 0.79 6.09 460 28 CMT 1 108.14 -6.88 CLAYSTONE 0.57 0.14 0.82 0.10 0.96 8.20 - 144.49 17.62 0.49 - 435 29 CMT 2 108.11 -6.88 CLAYSTONE 0.45 0.11 0.48 0.12 0.59 4.00 - 105.77 26.44 0.66 - 432 30 CMT 3 108.12 -6.90 CLAYSTONE 0.47 0.08 0.00 0.76 0.08 - - 0.00 163.0 0.59 - 458 31 CMT 4 108.11 -6.92 CLAYSTONE 0.55 0.03 0.00 0.68 0.03 - - - 124.7 0.65 - -32 CMT 5 108.23 -6.91 CLAYSTONE 0.60 0.06 0.00 0.35 0.06 - - - 58.57 0.66 - -33 CMT 6 108.23 -6.92 CLAYSTONE 0.53 0.07 0.00 0.32 0.07 - - - 60.43 0.61 - -34 CSR 203 108.22 -6.93 CLAYSTONE 0.50 0.17 0.34 0.08 0.51 4.25 - 68.44 16.10 0.75 - 458 35 CSR 205 108.25 -6.96 CLAYSTONE 0.23 0.05 0.15 0.03 0.20 5.00 - 66.37 13.27 0.64 - 438 36 CSR 206 108.10 -6.87 CLAYSTONE 0.40 0.09 0.12 0.30 0.21 0.40 - 29.89 74.72 0.51 - 424 37 CSR 209 108.11 -6.92 CLAYSTONE 0.19 0.04 0.09 0.07 0.13 1.29 - 47.37 36.84 0.60 - 439 38 CSR 313 108.10 -6.91 CLAYSTONE 0.18 0.04 0.05 0.03 0.09 1.67 - 28.46 17.07 0.66 - 435 39 BTM 30 108.10 -6.93 CLAYSTONE 0.67 0.04 0.47 0.28 0.51 1.68 - 70.03 41.72 0.62 - 424 40 BTR 34 108.18 -6.90 CLAYSTONE 0.68 0.07 0.35 0.24 0.42 1.46 - 51.18 35.09 0.63 - 421 41 BTR 43 108.20 -6.91 CLAYSTONE 0.51 0.03 0.23 0.25 0.26 0.92 - 45.21 49.14 0.57 - 422 42 BTR 44 108.19 -6.91 CLAYSTONE 0.62 0.05 0.34 0.14 0.39 2.43 - 54.70 22.52 0.69 - 422 43 CHM 48 108.18 -6.87 CLAYSTONE 0.51 0.04 0.24 0.35 0.28 0.69 - 46.62 67.99 0.69 - 428 44 CHM 52 108.22 -6.91 CLAYSTONE 0.44 0.04 0.15 0.16 0.19 0.94 - 33.76 36.01 0.59 - 431 45 CHM 57 108.18 -6.91 CLAYSTONE 0.57 0.07 0.29 0.29 0.36 1.00 - 63.14 63.14 0.69 - 423
Journal of Novel Carbon Resource Sciences, Vol.6, Sep. 2012
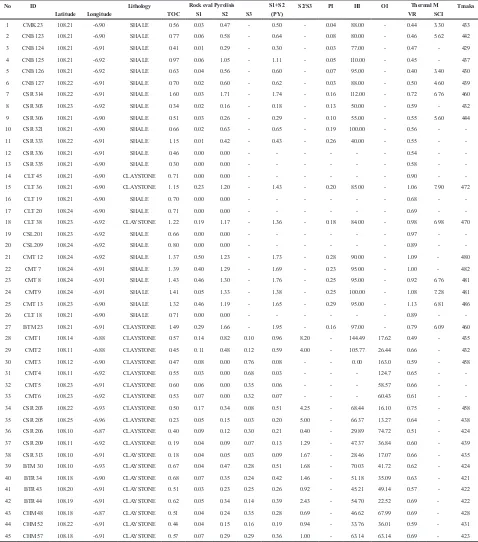
Fig. 3 (a) Summary of TOC for all samples distribution in Majalengka sub-basin. (b) Pyrolysis S2 yields, approximately 75% of samples fall in the poor category. (n = 45 samples belong to shale and claystone)
rock. Meanwhile, S2 is the second peak and shows the amount of hydrocarbon formed by the breakdown of kerogen (mg HC/gram rock) or the amount of hydrogen-rich source rock. This value also presents information about Tmax, a maximum temperature reached in analysis.
This temperature value (Tmax) can be used as an indicator
for maturity level, which is higher than hydrocarbon generation in nature.
The temperature in the natural environment for hydrocarbon generation is 80-165 oC for oil-generation
and 145-220 oC for gas-generation11). An increase
in the temperature of this basin is probably derived from magmatic activity, related with the increase in stratigraphic intervals12). Magmatism in West Java
during the middle to late Miocene was an important event, which inluenced the organic matter occurrence.
Results of analysis show the average value of S1 is very low, only 6.67% close to fair quantity. The value is around 0 to 0.5 mg HC/g rock, and the average is 0.09 mg HC/g rock. The other parameter S2 shows similar result where all of samples fall below 2.5 mg HC/g rock, and 77.78% of them below 1mg HC/g rock. The average value is 0.47 mg HC/g rock, whereas the range value is 0 to 1.71 mg HC/g rock. Both of the parameters belong to poor quantity and also for almost 22.22% sample. The S2 value is lower indicating that organic matter is not enough for hydrocarbon formation. Because of most of samples was taken from the outcrops (Fig. 3).
4.3 Type of organic matter
To determine a type of organic matter, two parameters are used: the diagram of Hydrogen Index (HI) and S2/S3 ratio. The HI is calculated as:
HI
=
TOC
S
2
x
100
(1) that represents the total amount of hydrocarbon 4.2 Source rock generative potentialThe results of analysis show the TOC values vary from 0.18 wt% to 1.6 wt% with an average of approximately 0.73 wt%. The minimum acceptable TOC value for potential source rock is 0.5 wt%, less than this value is considered to be insigniicant for hydrocarbon source rock potential10). The marginal value of the hydrocarbon
source rock potential is around 0.5 wt% and 1.0 wt%, whereas more than 1.0 wt% relects substantial source potential. Meanwhile, a TOC value above 2.0 wt% indicates excellent source potential. Thus, the analysis results indicate that all samples belong to a marginal value of the source rock.
Quantity variation of analyzed TOC values is such that 22.2% for poor quantity (0-0.5 wt%), 55.6% for fair quantity (0.5-1.0 wt%), and 22.2% for good quantity (1.0-2.0 wt%). None of the samples belong to very good quantity. The good quantity samples were taken from the western-part of Cimaningtin village, which is concentrated in an isolated depression zone (Fig. 3a).
In source rock evaluation, the TOC content does not focus on the amount of organic matter even though it is necessary. For example, one region with high TOC content occasionally exhibited slight oil-source potential, attributed to the dependence of kerogen type. Woody-rich or highly oxidized organic matter can be a poor-source for oil-generation.
Nevertheless, the TOC content can be used as a screening method for determining the potential areas for next-step exploration.
Furthermore, the second parameter is S1 and S2, which indicates the differences in peak temperature during analysis (Fig. 3b).
S1 indicates the irst-peak at a pyrolysis temperature up to about 300 oC while the zone below this temperature
Source-rock Potential of the Middle to Late Miocene Sedimen Turbidite in Majalengka Sub-basin, West Java Indonesia
independently, which is closely related to the elemental composition in kerogen. Meanwhile, the S2/S3 ratio demonstrates the kerogen type related to the production of hydrocarbon gas-generation.
The values of samples show that the type of hydrocarbon-generated is gas whereas most samples are below 150. Slight differences in results are produced by the S2/S3 ratio whereas only 71.43% of samples can be generated as gas, 23.08% mix and 7.14% as oil-prone.
Another parameter is Oxygen Index (OI), is given as,
OI
=
TOC
S
3
x
100
(2)It indicates the amount of CO2 produced from
kero-gen during Rock-Eval pyrolysis. OI is represented as mg CO2/g TOC and is supposed to be related to the oxygen
content of the kerogen13). Meanwhile, S3 is the third-peak
in analysis which is expressed as mg CO2/gram rock14).
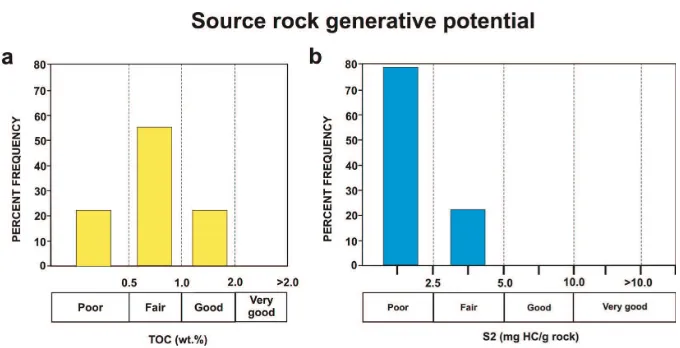
Correlation between HI and OI ratio, represented by the modiication of van Krevelan, is used to describe the cor-relationbetween maturation stages and kerogen type14-15).
Using the van Krevelan diagram most samples are plotted on the region of kerogen type III as an indication that the hydrogen content is of suficient quantity to generate gas-prone but is not enough to be oil-prone (Fig. 4).
The kerogen type III is dominated by vitrinite, formed commonly from land plant wood, and produced on a coal-forming environment at the transition zone such as paralic swamps and abandoned river channels. This type is normally deposited in a deltaic to shallow marine environment. The occurrences of shallow marine detritus in a deep marine deposit are due to resedimentation of previous sediment through to channelized systems.
Furthermore, based on these diagrams they can be grouped into four sample population categories (1) 64.44% belong to very low OI and high HI, (2) 15.56% to low OI and low HI, (3) 8.89% to high OI and very low HI, and (4) 11.11% to high OI and low HI. Groups 1 and 2 indicate that the organic matter source is land-derived and dominated by erosion material from mature source rock. Meanwhile, groups 3 and 4 are representing as gas-prone organic matter, which generally forms as an immature-source. Finally, the three parameters above have a good tendency in to generate as a gas-prone. The type of kerogen is mainly vitrinite (51.85%), in while 40.74% consists of Alginite, Amorphous, and Exinite. Around 7.41% of samples belong to Inertinite10). Furthermore, the
higher concentrations of gas-prone vitrinite are around 70.37% from all samples, some of them showed good quality. Approximately 18.52% the kerogen is generated to oil, which is dominated by Alginite, Amorphous and Exinite types. Meanwhile, 7.41% samples become wet-gas, and only one sample (3.70%), which was taken from Cisaar (crs 333), was barren (Fig. 5).
Fig. 4 van Krevelen diagram Oxygen Index (OI) against Hydrogen Index (HI), showing the hydrogen generative type, and most samples plot in the Type III (gas prone).
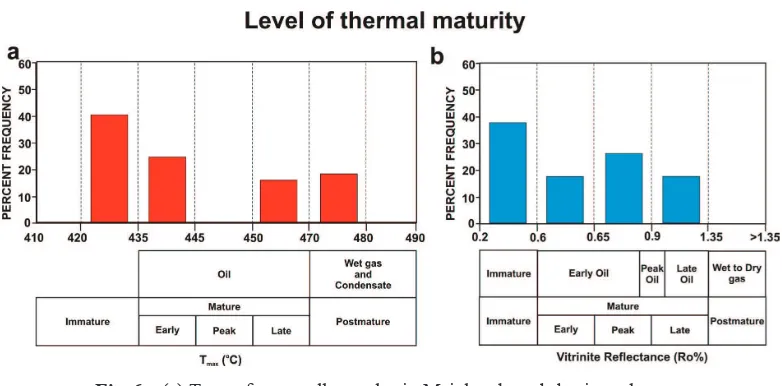
4.4 Level of thermal maturation
The organic maturation can generate to be oil and gas depending on kerogen type of the source rocks10,15).
To determine the organic maturation in sample three parameters are used i.e. Tmax (oC), vitrinite relectance
(VR) and production index (PI). For example, Tmax (oC)
is believed to be a good maturation index for kerogen type II and type III, but not recommended for kerogen type I13). It is caused by the range T
max (oC) variation in
kerogen type I is narrower than kerogen type II and type III. The Tmax (oC) value of the oil threshold (for types II
and III range in between 430 to 435 oC) is lower than
the gas threshold (type II approximately 430 to 455 oC,
whereas type III is 465 to 470 oC). In the present study,
the samples value of the Tmax (oC) range in between 421
Journal of Novel Carbon Resource Sciences, Vol.6, Sep. 2012
Fig. 6 (a) Tmax, for overall samples in Majalengka sub-basin and (b) Distribution of Vitrinite Relectance, and maturation scale16).
(n = 45 samples belongs to shale and claystone )
to 486 oC indicating that mixing oil to gas generation has
occurred (Fig. 6a).
The production index (PI) represented by the third equation is a second parameter for estimating the level of maturation of organic matter. The third equation is
PI
=
(
S
1+
S
1
S
2)
(3).The threshold for oil production is around 0.1 and continues to 0.4, where the gas threshold is produced. Most of the sample results are in the range 0.03 to 0.29 indicating they belong to the top of the oil window. A good correlation is shown with relationships between PI and vitrinite relectance (VR) (Fig. 6b).
To denote the temperature maturation in organic content, vitrinite is used as maceral type in coal. Maceral is analogous with minerals in the rock. Vitrinite is a type of kerogen particle formed from humic gels thought to be derived from the lignin-cellulosa cell walls of higher plants17). Vitrinite is a common component of coals, and
the relectance of vitrinite particles was irst observed to increase with increasing time and temperature in a predictable manner in coals18). Related with deep marine
environment (Majalengka sub-basin), the occurrence of vitrinite in most organic matter is interpreted as a resedimentaion process, or sedimentation through the channel system.
Paleobathymetry data, a transition zone between shallow marine and deep marine (bathyal zone), which combine with isopach maps indicate that the Majalengka sub-basin is an asymmetric basin in deep marine environment systems7).
Most of the samples collected from the shale part of turbidites yield vitrinite relectance values between 0.40 and 1.13%, with a mean value of 0.69%. Thus based on the assessment of organic matter adapted from10,19), the
all samples lie between the top and bottom of oil window on catagenetic stages (Table 2).
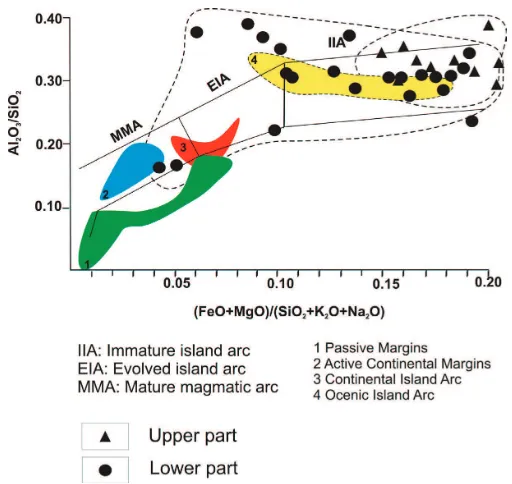
4.5 Geochemistry of sandstone
Related with magmatic arc provenance source has proposed the use of the ratio between (Al2O3 / SiO2) vs
(FeO + MgO) / (SiO2 + K2O + Na2O)20). The Al2O3 / SiO2
ratio corresponds with comparison between feldspar to quartz as a representation of maturity level of the rocks. Meanwhile, (FeO + MgO) / (SiO2 + K2O + Na2O) ratio
shows a basicity index or B.I index, whereas the FeO + MgO represented maic rocks and SiO2 + K2O + Na2O represents
felsic rocks (Fig. 7). The general evolution of the magmatic arc occurred from oceanic island arc (immature island arc) to continental island arc (mature magmatic arc).
According to the results of the ield investigation, the samples could be divided into two parts, lower and upper parts of turbidite. Furthermore, on Fig. 7, the samples are distributed into two populations. In the lower part plotted in two ields (1) oceanic island arc, and (2) continental island arc, whereas in the upper part all samples were concentrated on oceanic island arc. This is the case indicating the iteration of subduction process occurred and related to magmatism.
5. Discussion
The result of analysis demonstrates the highest organic matter value according to total organic carbon, S2, Tmax
and vitrinite relectance parameters is concentrated on a restricted area. Despite, mostly the analysis result indicates the poor value. It is due to the organic matter contained in turbidite inluenced by the high content of matrix and volcanic fragment7, 21). This local area is
Source-rock Potential of the Middle to Late Miocene Sedimen Turbidite in Majalengka Sub-basin, West Java Indonesia
Table 2 Application of Rock-Eval pyrolysis, TOC and Vitrinite relectance.
Journal of Novel Carbon Resource Sciences, Vol.6, Sep. 2012
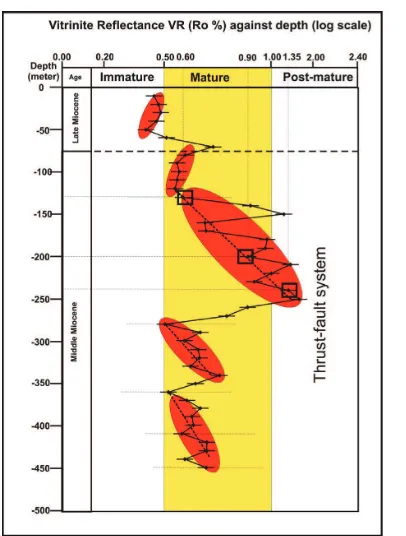
Fig. 8 Log vitrinite relectance (VR) against to depth shows the thrust-fault systems. The samples were taken from the lower and the upper parts of the sediment turbidite. The distribution pattern of samples from bottom to top shows the thrust fault systems. It resulted from samples, shale and claystone.
ine to clay of the grain size and very high organic matter content. Meanwhile, the claystone in this area normally shows dark to grey in color and occasionally the ine sand fragment loating in mass body of the rock is found. The purity and uniformity of the grain size are considered as the main factor for organic matter accumulation.
6. Conclusion
Two geologic events which inluenced on the hydrocarbon generation in Majalengka sub-basin are magmatism and tectonism. In this basin, the magmatism acts as thermal maturation during the late Miocene. Meanwhile, the tectonism have role as the accumulation place and trapping mechanism for hydrocarbon generation. Both the events have been increasing the source rock potential in the limited area. For the next exploration stage, the oil-investigation in the Majalengka sub-basin could be concentrated in this area.
Acknowledgements: The irst author would like to thank, Global-Centre of Excellence (G-COE) in Novel Carbon Resource Science, Kyushu University, Japan for ieldworks fund supported and the Ministry of National Education of the Republic Indonesia for my scholarships. And also he would like to greatly thank Dr. Darjie preservation is dificult to occur6).
The organic matter is dominated by kerogen type III, a kerogen type that is commonly arranged by the accumulation of terrestrial detritus. This kerogen type gathered in a zone from transition to delta facies in the Northwest Java basin7). During the break magmatism in
the middle Miocene accompanied by sea level drop, the material transported and resedimented into the basin deep in the southern part1, 7, 22). The sedimentation process
from the source to the basin passed through a channel system, which the main direction is northwest to south7).
Related to the accumulation zone of the organic matter, interpreted that this area was formed due to a paired strike-slip fault such as the pull-apart basin7).
This basin according to isopach maps forms a depression zone asymmetrically, where the western latter than the eastern sides7). The main shape of this basin forms
the northwest to southwest direction or almost parallel with the Sumatra trends. In the South Sumatra basin according to the SAR-maps interpretation, interpreted the main lineament of the fault system trending in this direction23). This trend is normally termed as the 300
degree-line and considered as a plane boundary of the basin. This basin is commonly contains the hydrocarbon such as Palembang sub-basin and Jambi sub-basin. Continued toward to the south, on the Java Island during the middle Tertiary boundary was indicated by this trend that was shown with the lineament trend in Banten-block, the west-part of West Java24).
Entering the late Miocene the active magmatism occurred, which is associated with tectonics in the overall basin area1). The deepest zone slightly moves to the south
accompanied with the thrust-fault formation. Fig. 8 shows the development of the source-rock maturation from the vitrinite relectance analysis that is inluenced by the thrust-fault system. This fault is also having a role as a hydrocarbon trapping in this basin. The zero value on the ordinate line indicates the maximum surface of the sea-level rise during the late Miocene, which is determined on the basis of the fossil foraminifera analysis7, 22).
This geologic event is accompanied with uplifting and magmatism in the southern-part and depression in the basin3). From this igure indicate that the mature to near
the post-mature value on the depression zone, the shale sample was taken from -200 to -250 meter depth. Several researchers have reported that there are interactions very closely between magmatism and maturation on hydrocarbon generation25-29). Moreover, an increase
of the magmatic activity toward the late Miocene is also accompanied the sediment provenance changing, sediment source from the north is stopped and the source changed over became from the south, the Southern Mountain7).
Results of analysis indicate that in the Majalengka sub-basin the shale sample tends to act as a good preservation of the organic matter compared to the claystone sample.
Source-rock Potential of the Middle to Late Miocene Sedimen Turbidite in Majalengka Sub-basin, West Java Indonesia
Noeradi, from the Bandung Institute of Technology (ITB) for discussion and suggestion in completing this manuscript. Authors would like to thank Mr. Thomas Tindell for editing and commenting on my English Grammar.
References
1) R. Soeria-Atmadja, R. Maury, R. C. Bellon, H. Pringgoprawiro, H. Polvé, B. Priadi, Jour. of Southeast Asian Earth Sciences. 9 (½) , 3 (1994).
2) S. Martodjojo, Ph.D. Thesis, Bandung Institute of Technology, Bandung, Indonesia (1984).
3) R. W. van Bemmelen, The Geology of Indonesia, 1st A ed., Martinus Nijhoff The Heague, Netherlands (1949). 4) Djuri, Geology map of Arjawinangun sheets, 10/XIII-D,
1 (1995).
5) Djuhaeni and S. Martodjojo, Geologi Indonesia, 12(1), 227 (1989).
6) A. W. Satyana and C. Armandita, Indonesian Petroleum Association, 2, 293 (2004).
7) B. Muljana, Master Thesis, Bandung Institute of Technology, Bandung, Indonesia (2006).
8) E. Mutti and F. Ricci-Lucci, Field Trip Guidebook A-11: International Sediment Congress, IX, 21 (1975). 9) G. Shanmugam and R. J. Moiola, in Submarine fans
and related turbidite systems, eds. by A. H. Bouma, W. R. Normark and N. E. Barnes, Springer-Verlag, New York, p.29 (1985).
10) B. P. Tissot and D. H. Welte, Petroleum Formation and Occurrence, 2nd ed., Springer, Berlin (1984).
11) C. Conford, Encyclopedia of Geology, 1st ed., Elsevier, Oxford, p. 268 (2005).
12) G. L. Fletcher and K. W. Bay, Proceeding of Indonesian Petroleum Association, the 4th Annual Convention, 2, 211 (1975).
13) B. P. Tissot, R. Pelet and Ph. Ungerer, Am. Assoc. Pet. Geol. Bull., 71, 1445 (1987).
14) J. Espitalié, M. Madec, B. Tissot, J. J. Menning and
P. Leplat, Procedding of the 19th Annual Offshore Technology Conference, 3, 439 (1977).
15) W. G. Dow, Journal Geochemical Exploration, 7, 79 (1977).
16) M. L. Bordenave, Applied Petroleum Geochemistry, 1st ed., Editions Technip, Paris (1993).
17) M. Teichmüller, International Journal of Coal Geology,
12, 1 (1989).
21) B. Muljana. K. Watanabe and M. F. Rosana, Proceding of International Symposium on Earth Sciences and Technology 2011, p. 429 (2011).
22) B. U. Haq, J. Hardenbol, P. R. Vail, Science, 235, 1156 (1987).
23) A. Pulunggono, A. Haryo, S. C. G. Koesoema, Proc. IPA. The 21st Annual Convention, p. 339 (1992). 24) A. Pulunggono and S. Martodjojo, Proceeding Geologi
and Geologi Tektonik Pulau Jawa, p. 37, Yogyakarta
28) D. W. Waples, Geochemistry in Petroleum Exploration: Geological Sciences Series, International Human Resources Development Co., Boston (1985).