Microcosmic Study on Heterotrophic CO
2Emission from Tropical Peat as Related to
Water Table Modification
Dewi Lastuti1, Sabaruddin Kadir1,*, Dedik Budianta1
1Department of Soil Science, Faculty of Agriculture, Sriwijaya University, Inderalaya 30662, South Sumatra, Indonesia
*Corresponding author: Email: [email protected]
Article history
Received Received in revised form Accepted Available online 3 March 2016 30 March 2016 4 April 2016 15 April 2016
Abstract: A microcosmic experiment was conducted to estimate CO2 emission from peat soils. Two treatments, peat humification levels (F = Fibric, H = Hemic, S = Sapric) and water levels (G0 = 10 cm; G1= 0 cm; G2 = -10 cm; G3 = -20 cm), were tested and arranged according to factorial randomized complete block design (RCBD) with 3 replicates. Current study revealed that CO2 emission was significantly affected (p<0.01) by peat humification levels and water levels. The sapric peat emitted significantly higher CO2 (696.69 b ± 43.95 mg CO2 g-1 peat d-1) than hemic (504.62 a ± 105.72 mg CO2 g-1 peat d-1) and fibric (492.56 a ± 90.69 mg CO2 g-1 peat d-1) peats. Decreases in water level shifted anaerobic condition into aerobic condition, causing significant increases in CO2 emission. Regardless of peat humification levels, CO2 emission and water table depth in current study showed a nonlinear relationship. It seems that a threshold water tables for enhanced CO2 emissions was within the range of -10 to -20 cm below peat surface. Keyword: microcosmic, peat, humification, CO2 emission
Abstrak (Indonesian): Tujuan percobaan skala mikrokosm ini adalah untuk estimasi emisi CO2 dari tanah gambut. Pengaruh 2 (dua) perlakuan, yaitu tingkat humifikasi gambut (F = Fibrik, H = Hemik, S = Saprik) dan tinggi muka air (G0 = 10 cm; G1= 0 cm; G2 = -10 cm; G3 = -20 cm), disusun menurut Rancangan Acak Lengkap Faktorial (RALF) dengan 3 (tiga) ulangan. Hasil penelitian menunjukkan bahwa perlakuan tingkat humifikasi gambut dan tinggi muka air mempengaruhi emisi CO2 secara nyata (p<0.01). Emisi CO2 dari gambut dengan tingkat humifikasi saprik menghasilkan emisi CO2 secara nyata lebih tinggi (696.69 b ± 43.95 mg CO2 g-1 gambut hr-1) dibandingkan dengan emisi CO2 dari gambut hemik (504.62 a ± 105.72 mg CO2 g-1 gambut hr-1) dan fibrik (492.56 a ± 90.69 mg CO2 g-1 gambut hr-1). Penelitian ini juga menunjukkan bahwa perubahan suasana reduktif menjadi oksifatif akibat penurunan muka air juga diikuti oleh peningkatan emisi CO2 secara nyata pada semua tingkat humifikasi gambut. Besaran emisi CO2 dan muka air tanah menunjukkan pola hubungan non linier pada ketiga tingkat kematangan gambut. Hasil penelitian ini juga menunjukkan bahwa tinggi muka air pada ketiga tingkat kematangan gambut yang menjadi pemicu percepatan emisi CO2 adalah berada pada kisaran -10 to -20 cm di bawah permukaan gambut.
Kata kunci: mikrokosm, gambut, humifikasi, emisi CO2
1.
Introduction
Indonesia has around 20.96 million hectares of peatland, mostly in Sumatra (4.74 million ha), Kalimantan (2.89 million ha) and Papua (85,394 ha).
Despite its’ function as a C sink [1, 2], scarcity of arable upland has increased the use of peatlands in Indonesia for oil palm plantation. Rapid expanding oil palm industry in Indonesia has been claimed to cause peat oxidation, which is causing peat oxidation and releases of carbon dioxide (CO2) into atmosphere. The development of oil palm plantation in nutrient poor condition of peatland requires considerable anthropogenic modification of peatland ecosystem, including drainage to remove excessive water from root zone [3]. Because hydrology is the most important factor that controls the C balance of peatland, drainage of peatland for oil palm plantation exposes the peat to an
aerobic condition which leads to peat oxidation and turns the peat into net C emitter and C loss [4, 5, 6]. Although the significant roles of groundwater depth in governing CO2 emission have also been shown earlier, the emission of CO2 continues for as long as the oil palm is growing [4, 7, 8]. Therefore, the drained peatlands for oil palm plantation in Indonesia are increasingly recognized as an important source of C emission [9].
in CO2 and CH4 emission due to specific factors among peatland sites has also been reported, such as water level, temperature, peat quality. The undecomposed organic matter is a prerequisite for CO2 and CH4 emission in acidic fens [18].
Despite the perception that peats are nutrient-poor, peats are constantly undergoing dynamics decomposition. Such dynamics creates spatial variability in peat humification levels both horizontally and vertically. Because humification levels affect C content in peat, which is important for heterotrophic decomposition, current study aimed to test a hypothesis whether levels of peat humification levels would affect CO2 emission as related to artificial lowering of peatland water levels.
2.
Experimental Sections
2.1.
Sampling site description
Peat samples were collected from peatland in Sepucuk Village of Ogan Komering Ilir District, South Sumatra Province, about 71 km South of Palembang, Indonesia. The climate of Sepucuk belongs to Type A with ratio of dry month to wet month of <1.5 [19]. Although there has been a seasonal shift, rainy season usually occurs from November to April with average annual precipitation of > 2,500 mm; dry season is from May to October. Air temperature is relatively similar all year long with mean annual temperature of 25°C. The sampling site covered a plot of 2 ha, which was a part of 9,710 ha of oil palm plantation area. The sampling site was deforested and abondaned peatlands, which were occupied by ferns. A detailed description of the sampling site was already given earlier [20].
2.2. Peat sampling and characteristics
Sampling points were determined based on distinct degree of peat decomposition using field rapid assessment by von Post [21]). This was important because in fact spatial variability of peat humification was found in the study area. Peat blocks of cm x 20-cm x 25-20-cm (W x W x H) with three distinct degrees of humification, Fibric (F), Hemic (H), and Sapric (S), were taken from three sub-plots of 1m x 1m. All peat blocks were put into air-tight plastic boxes and soaked in water for transportation to the laboratory. A small portion of peat samples were also collected for physical and chemical characterization. Water from the sampling site was also collected for watering the peat blocks during incubation in the laboratory.
Upon returning to the laboratory, the peat blocks were immediately transferred to peat microcosms, while the small portions of peat samples were air-dried at room temperature (25°C), ground and sieved through 2 mm for physical and chemical characterization. The characteristics of the peat varied according to the humification levels (Table 1). Peat pH (from 3.1 to 3.8),
ash content (from 11.2 to 19.0 g kg-1), and bulk density (from 0.11 to 0.19 g cm-3) increased with increasing humification level from fibric to sapric. On the other hand, the organic C (from 557.3 to 550.2 g kg-1) and the organic matter (from 960.7 to 948.5 g kg-1) content decreased with increasing humification level from fibric to sapric.
2.3.
Peat microcosm
Peat microcosms were air-tight plastic buckets that were 50cm high with a 15cm diameter. The peat blocks were packed separately to a height of 20 cm from the bottom of the microcosms. Using water from the field, water height in the microcosms were adjusted to three different water tables noted as G0 = +10 cm, G1 = 0 cm, G2 = -10 cm, and G4 = -20 cm from peat surface in the microcosms. The experiment was arranged in factorial completely randomized block design in 3 replicates.
2.4.
CO2 emission measurement
The peat microcosms were incubated for 15 days. The CO2 emissions were measured every 3 days using a closed-chamber method of Isermeyer [22]. The CO2 emission was trapped in 25 mL of NaOH (0.5M) contained in an open glass jar hung at 15 cm above the peat surface in the peat microcosms. Three microcosms with NaOH (0.5M) but without peat were used as controls. After a 3-day incubation at room temperature (25°C), the glass jar was removed and capped tightly for titration. Prior to the titration, the 25 mL of 0.05M NaOH solution was transferred to a 100-mL erlenmeyer to which 5 mL of barium chloride solution (0.5M) and three drops of indicator solution (Phenolphthalein) were added. The solution was then titrated with HCl (0.05M, dropwise) under continuous stirring until the colour changes from red to colourless.
CO2 emission was calculated following Eq. 1 [22]:
𝐶𝑂2 =𝑉0−𝑉𝑑𝑤𝑡 𝑥 1.1 (1)
Where V0 is HCl volume used for titration of the control (mL), V1 is HCl volume used for titration of the peat sample (mL), dwt is dry weight of peat (g), t is incubation time (day), and 1.1 is conversion factor for CO2.
2.5.
Data analysis
Data on CO2 emissions were averaged over 5 measurements. ANOVA was performed to test the effects of treatments on CO2 emissions. Differences among treatment means were compared by least significant difference (LSD) at P<0.05.
3.
Result and Discussion
3.1.
CO2 emissions at different levels of peat
Peat humification levels significantly (p<0.01) affected the amount of emitted CO2 from peat microcosms. The highest amount of CO2 (696.69 b ±
Tabel 1. Physio-chemical charateristics of peat for
the experiment
Characteristic Humification Level
Fibric Hemic Sapric
pH 3.1± 0.12 3.4± 0.15 3.8± 0.12
Organic C (g kg-1) 557.3 ± 1.2 552.3 ± 5.3 550.2 ± 6.2 Organic Matter (g
kg-1) 960.7 ± 2.1 952.2 ± 9.2 948.5 ± 10.7 Ash Content (g kg-1) 11.2 ± 2.8 14.3 ± 4.7 19.0 ± 8.4 Bulk density (g cm-3) 0.11 ± 0.02 0.17± 0.02 0.19± 0.01
Table 2. Effect of peat humification levels on CO
2emissions
Peat Humification Level CO2 emissions
---- mg CO2 g-1 peat d-1 ---
Fibric 492.56 a ± 90.69
Hemic 504.62 a ± 105.72
Sapric 696.69 b ± 43.95
Values in the same column followed by the same
letters are not statistically different
(LSD at
p
=0.05). Means are based on
n=60
.
64.03 mg CO2 g-1 peat d-1) was emitted from the sapric peat, which was significantly higher than CO2 emissions from fibric and hemic peats (Table 2). The highest CO2 emissions from the most humified peat (sapric) in current study were not in agreement with those reported earlier [23] that the highest CO2 emissions were observed in the least humified peat (litter layer), irrespective of the moisture content. In earlier study [23] used peat column collected from 3 different depths (0-10 cm, 10-20 cm, and 20-30 cm) from which a 5-cm thick peat layer was packed. Each depth of peats had different level of humification. The uppermost layer (0-10 cm) was the least humified layer and the humification levels increased with increasing depth. While in current study, each peat microcosm had different levels of humification.
The fact that well-humified peat (sapric peat) in current study emitting significantly higher amount of CO2 showed that heterotrophic microbes in the sapric peat were more active as compared to those in the fibric and sapric peats because C source in the sapric peat was more readily available and accessible. A study by [24] pointed out that adding simple sugar (glucose and sucrose) to the peat as C sources significantly increased the availability of readily-accessible C source, which was then stimulating heterotrophic microbe activities and increasing CO2 emissions from peat. On the other hand, lower CO2 emissions from less-humified peat (fibric and hemic) in current study was due the less availability of readily-accessible C source rather than being caused by high availability of recalcitrant C
source. Ecologically, such condition was to some extent beneficial because it could extend the life span for the role of peats as major C stores.
3.2. CO2 emissions at different water level
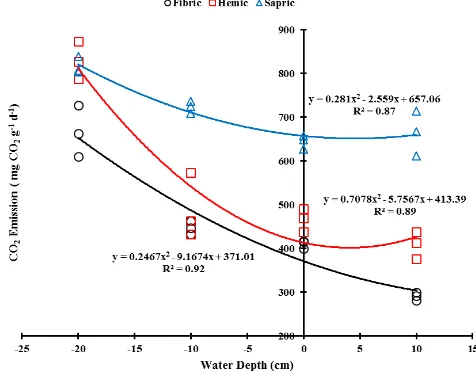
Water tables significantly (p<0.01) affected CO2 emissions from peat microcosms. Decreases in water tables were followed by significant increases in CO2 emissions at all levels of peat humification (Fig. 1). Because CO2 emissions was significantly different among three levels of peat humification (Table 2), correlations between CO2 emissions and water depth for each level of peat humification is reported. The mean CO2 emissions and mean water depth relationship was highly significant, with R2 values of 0.92, 0.89, and 0.87 for the fibric, hemic, and sapric peats, consecutively (Fig. 1). Because water depth is an important indicator of reductive-oxidative states of peat, the significant correlation between CO2 emissions and water depths observed in current study was closely related to the shifting condition from anaerobic to aerobic conditions. Significant correlation between water depth and CO2 emissions has also been demonstrated for tropical peat [25] and by for sub-tropical peat [26]. However, both studies earlier [25, 26] did not differentiate CO2 emissions from different levels of peat humification, while in current study significant differences in CO2 emissions were detected among fibric, hemic, and sapric peat at all levels of water depth.
Figure 1. Effect of water levels on CO2 emissions from peat soil with different levels of humification (Values
are based on n=15).
microcosms. Once the differences of water depth were 20 cm, for example from 10 cm to -10 cm and from 0 cm to -20 cm, the amount of CO2 emission increased significantly at all peat humification levels (Fig. 1) because it further increased the availability of oxygen for peat decomposition by heterotrophic microorganisms while still sufficiently maintaining moisture content. In addition, due to a possibility of phenol toxicity under anaerobic condition to occur was also high [27], the shifting from anaerobic to aerobic conditions due to the decreases in water table in the peat microcosms might also have significantly removed phenol toxicity, resulting in significant increases CO2 emissions.
A nonlinear relationship between CO2 emission and water table depth found in current study contrast findings earlier [8, 28, 29], in which a linier relationship was found in their field study. The linier relationship between CO2 emission and drained peat soils under Acacia plantation [8, 28, 29] were calculated using metadata assessment, while current results were calculated using closed-chamber measurement. In addition, water table is fluctuating under field conditions [29], while water table in the peat microcosms in current study was maintained at the same levels for each treatment during 15 days of incubation. The relatively maintained water table in current study enabled gradual increases in heterotrophic CO2 emission, resulting a nonlinear relationship between CO2 emission and water table depth.
Current findings again confirmed that regardless of peat humification levels, hydrologic shifts from anaerobic to aerobic conditions threaten carbon stores, changing peatlands from a carbon sink to a carbon source by increasing decomposition [30]. Current results indicated that a threshold water tables for enhanced CO2 emissions was within the range of -10 to -20 cm and we suggest that the non-linier relationship would be appropriate to estimate CO2 emission relative to water table shift in peat soils up to -20 cm below peat surface (owing high R2 values as shown in Fig. 1), while acknowledging the relationship might be different for deeper water table and under field conditions.
4. Conclusion
Based on the results of current experiment, it can be concluded that it is important to consider spatial variability of peat humification levels in measuring CO2 emission. In addition, lowering water table enhanced CO2 emission at all peat humification levels. It seems that the threshold water tables for enhanced CO2 emissions was within the range of -10 to -20 cm below peat surface.
Acknowledgement
We want to thank a number of people and organizations for their support and contribution to make
current work possible. Technical help by a number of villagers in Sepucuk Village of Ogan Komering Ilir District, South Sumatra Province during field work is also highly acknowledged. Current work has also been possible because technical support from the Department of Soil Science, Faculty of Agriculture, Sriwijaya University and Post Graduate Study, Sriwijaya University. Current work was also supported by Japan International Cooperation Agency (JICA) Indonesia in Palembang within Study on Mainstreaming of Climate Change into Development Planning in South Sumatra Province 2014-2015.
References
[1] Jaenicke, J., Rieley, J.O., and Mott, C. 2008. Determination of the amount of carbon stored in Indonesian peatlands. Geoderma 147:151–158.
[2] Page, S.E., Rieley, J.O., and Banks, C.J. 2011. Global and regional importance of the tropical peatland carbon pool. Glob. Change Biol. 17:798–818.
[3] Hooijer, A., Page, S., Canadell, J.G., Silvius, M., Kwadijk J., Wösten, H., and Jauhiainen, J. 2010. Current and future CO2 emissions from drained peatlands in Southeast Asia. Biogeosciences 7:1505– 1514.
[4] Gomeiro, T., Paoletti, M.G., and Pimente, D. 2010. Biofuels: efficiency, ethics and limits to human appropriation of ecosystem services. J. Agric Environ. Ethic 23:403–434.
[5] Maljanen, M., Komulainen, V.M., Hytönen, J., Martikainen, P.J., and Laine, J. 2004. Carbon dioxde, nitous oxide and methane dynamics in boreal organic agricultural soils with different soil management. Soil Biol. Biochem. 36:1808–1808.
[6] Pitkänen, A., Turunen, J., Tahvanainen, T., and Simola, H. 2013. Carbon storage in a partially forestry-drained boreal mire determined through peat column inventories. Boreal Enviro. Res. 18:223–234.
[7] Jauhiainen, J., A. Hooijer, and S. E. Page. 2012. Carbon dioxide emissions from an Acacia plantation on peatland in Sumatra, Indonesia. Biogeosciences 9:617– 630.
[8] Couwenberg, J., Dommain, R., and Joosten, H. 2010. Greenhouse gas fluxes from tropical peatlands in Southeast Asia. Glob. Change Biol. 16:1715–1732. [9] Fargione, J., Hill, J., Tilman, D., Polasky, S., and Hawthorne, P. 2008. Land clearing and the biofuel carbon debt. Science 319(29):1235–1238.
tropical peatland of Sarawak, Malaysia. Soil Sci. Plant Nutr. 53:729-805.
[12] Reijnders, L., and Huijbregts, M.A.J. 2008. Palm oil and the emission of carbon-based greenhouse gases, J. Clean. Prod. 16:477–482.
[13] Kroon, P.S., Schrier-Uijl, A.P., Hensen, A., Veenendaal, E.M., and Jonker, H.J.J. 2010. Annual balances of CH4 and N2O from a managed fen meadow using eddy covariance flux measurements. Eur. J. Soil Sci. 6(5):773–784.
[14] Veenendaal, E.M., Kolle, O., Leffelaar, P.S., Schrier-Uijl, A.P., Huissteden, J. van, Walsem, J. van, Möller, F., and Berendse, F. 2007. CO2 exchange and carbon balance in two grassland sites on eutrophic drained peat soils, Biogeosciences 4:1027–1040. [15] Hirano, T., Segah, H., Harada, T., Limin, S., June, T., Hirata, R, and Osaki, M. 2007. Carbon dioxide balance of a tropical peat swamp forest in Kalimantan, Indonesia. Glob. Change Biol. 13:412–425.
[16] Dradjad, M., Soekodarmodjo, S., Shodiq, Hidayat, M., and Nitisapto, M: Subsidence of peat soils in the tidal swamp lands of Barambai, South Kalimantan. J. Ilmu Tanah dan Lingk. 4:32–40.
[17] Hooijer, A. Page, S., Jauhiainen, J., Lee, W.A., Lu, X.X., Idris, A., and Anshari, G. 2012. Subsidence and carbon loss in drained tropical peatlands. Biogeosciences, 9:1053–1071.
[18] Reiche1, M., G. Gleixner, and K. Küsel1. 2010. Effect of peat quality on microbial greenhouse gas formation in an acidic fen. Biogeosciences 7:187–198. [19] Schmidt, F.H., and Ferguson, J.H.A. 1951. Rainfall type based on wet and dry period ratios for Indonesia with western New Guinea, Verhandelingen Djawatan Meterologi de Geofisik, Djakarta.
[20] Winda, P., and Sabaruddin. 2014. Estimating direct emission of nitrous oxide (N2O) from chemical N fertilizer application to peatland under oil palm plantation. Proc. of Nat. Sem. on Climate Change Mitigation and Adaptation Toward Sustainable Forest and Land Management, Jakarta, Indonesia, pp. 231–236.
[21] von Post, L., and Granlund, E. 1924. Södra Sveriges Torvtillgångar I (Peat resources in southern Sweden I). Sveriges Geologiska Undersökning C 335(19):1–128, 1924.
[22] Isermeyer, H. 1952. Estimation of soil respiration in closed jars. In Alef, K., Nannipieri, P. (Eds). Method in Applied Soil Microiology and Biochemistry. London, p. 214–216.
[23] Vien, D.M., Phuong, N.M., Jauhiainen, J., and Guing, V. T. 2010. Carbon dioxide emission from peatland in relation to hydrology, peat moisture, humification at the Vo Doi national partk, Vietnam. 19th World Congress of Soil Sci., Soil Solutions for a Changing World. 1-6 August 2010, Brisbane, Australia. [24] Gogo, S., and Pearce, D.M.E. 2009. Saturation of raised bog peat exchange sites by Pb²+ and Al³+ stimulates CH4 production. Soil Biol. Biochem. 41(9):2025–2028. [25] Dariah, A., Fahmuddin, A., Susanti, E., and Jubaedah. 2013. Relationship between sampling distance and carbon dioxide emission under oil palm plantation, J. Trop. Soils 18(2):125–130.
[26] Silvola J, Alm, J., Aklholm, U., Nykanen, H., and Martikainen, P.J. 1996. Carbon dioxide fluxes from peat in boreal mires under varying temperature and moisture condition. J. Ecol.,84:219–228.
[27] Freeman, C., Ostle, N., and Kang, H. 2001. An Enzymic ‘latch’ on global carbon store: a shortage of oxygen locks up carbon in peatlands by restraining a single enzyme. Nature 409:149–149.
[28] Levy, P. E., Gray, A., Leeson, S.R., Gaiawyn, J., Kelly, M.P.C., Cooper, M.D.A., Dinsmore, K.J., Jones, S.K., and Sheppard, L.J. 2011. Quantification of uncertainty in trace gas fluxes measured by the static chamber method. Eur. J. Soil Sci. 62:811–821.
[29] Hooijer, A. Page, S., Jauhiainen, J., Lee, W.A., Lu, X.X., Idris, A., and Anshari, G. 2012. Subsidence and carbon loss in drained tropical peatlands. Biogeosciences 9:1053–1071.
[30] Wang, W., Ohseb. K, and Liuc, J. 2005.