ii
Gender Analysisof the Unified Database
Acknowledgements
iii
Gender Analysis
of the Unified Database
Key Points for Policy-Makers
This analysis is based on sex-disaggregated data collected as part of the Social Protection Program Data Collection (Pendataan Program Perlindungan Sosial - PPLS) in 2011, and consolidation of this data in the Unified Database for Social Protection Programs (UDB). It identifies a number of factors for consideration in poverty reduction and social protection policy, summarised as follows:
There are nearly 3 million female-headed households in the poorest 3 deciles of the Unified Database. In total, they represent 15 percent of the poorest 3 deciles of the population in the Unified Database, which breaks down to 10 percent of households in the poorest decile, 15 percent of households in the second decile and 21 percent in the third decile. By comparison, female-headed households comprise 14 percent of all households according to the Indonesian population census. It is possible that these percentages of female-headed households may be under-estimated for reasons related to conventions about the definition of household heads.
Female heads of households are on average older than their male counterparts. Among the nearly three million female-headed households in the poorest three deciles, the average age of female household heads is 55 compared to 46 for male household heads. Only 7 percent of all male household heads are above the age of 60, while 24 percent of female household heads are in this elderly age group.
Relatedly, female household heads have a different marital status profile. Most female household heads in the poorest deciles are widows (75 percent), 14 percent are divorced, 10 percent are married, and 2 percent are single. By contrast, almost all of male household heads are married (96 percent).
Overall, Indonesia has an almost even ratio of males to females in the poorest three deciles and the general population. However, some provinces, particularly Kalimantan Tengah, Kalimantan Timur, Maluku, Nusa Tenggara Barat, and Nusa Tenggara Timur, Papua Barat, and Papua show significant or unusual imbalances in the numbers of males compared to females. The reasons behind this, and policy responses potentially required, should be explored through local level research and planning, particularly where the gaps are large in the reproductive and working age groups.
Male-headed households tend to have more members than female-headed households, with average household sizes of four and five members, respectively, across the bottom three deciles. Further, nearly one-third of female-headed households are single-person households, while this applies to only 1 percent of male-headed households.
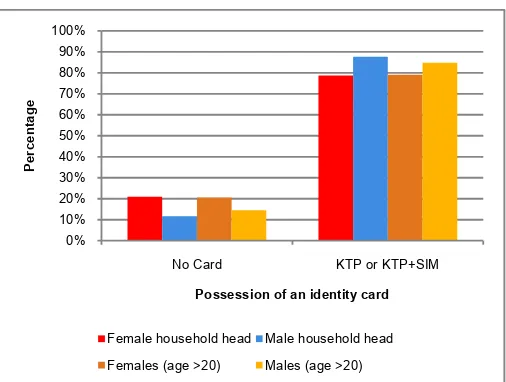
One of the most striking gender inequalities in the UDB data is that 21 percent of female household heads in the poorest three deciles do not possess a resident identification card (Kartu Tanda Penduduk- KTP)or a driver’s licence (Surat Izin Mengemudi - SIM). The figure for male household headsis only 12 percent.Similar rates of KTP possession are found among all females and males. This indicates that programs to increase possession of identification cards need to specifically target both female-headed households and females in general.
The overall disability rates of female household heads in the poorest three deciles are in line with female household heads at the average socio-economic level. However, compared to male household heads, female household heads reported a slightly higher prevalence of disability, and a higher prevalence of chronic illness. This is likely attributable in part to their older age profile.
iv
Gender Analysisof the Unified Database
Another particularly striking gender gap identified in the UDB data is that female heads of households in the poorest three deciles are less likely than male households heads to have completed primary and higher levels of education. Only 52 percent of female household heads have completed at least primary-level education in contrast to 74 percent of male household heads. The gender gap continues at the levels of junior and senior secondary education completion. This has particular implications for socialisation strategies for programs, and suggests the need for non-written forms of information when targeting this group. There is little difference in the highest education level achieved by male and female individuals in the poorest three deciles. A much higher percentage of male heads of households (93 percent) in deciles one to three report that they work, compared to female heads of households (62 percent). Similar gender differences exist across age groups among all males and females. The 62 percent rate of female household heads who work is about 7 percentage points higher than the rate for the spouses of male household heads in the poorest deciles. Almost 60 percent of the spouses of female household heads are employed, which is close to the rates for female household heads and much lower than the rates for male household heads.
In all except the youngest (0-14 years) age group, males and females in the poorest three deciles report fewer working hours per week than those in the general population. In each age group, males work more hours per week than females, by an average of seven hours more per week. In 21 percent of female-headed households there are no hours of work by any household member, in striking contrast to only 1 percent of male-headed households. However it should be noted that neither PPLS nor Susenas specifically prompt for inclusion of paid or unpaid hours worked within the home, such as for family maintenance and childcare. In Indonesia, as globally, these roles are predominantly filled by female household members.
PPLS 2011 collected data on whether households received a range of social protection programs. These data show that proportionally more female-headed households report to receive Rice for the Poor (Beras untuk Rumah Tangga Miskin - Raskin) and Health Insurance for the Poor (Jaminan
Kesehatan Masyarakat - Jamkesmas). Slightly proportionally fewer female-headed households
receive the conditional cash transfer program (PKH) and substantially fewer access family planning(Keluarga Berencana - KB)as expected since these programs target women at reproductive age while female household heads tend to be older.
v
Gender Analysis
of the Unified Database
Contents
Acknowledgements ... i
Key Points for Policy-Makers ... ii
Acronyms and glossary of Indonesian terms ... vii
1. Introduction ... 1
2. Methodology ... 1
3. Results ... 3
3.1. Number of female and male-headed households ... 3
3.2. Age and marital status of female and male heads of households ... 4
3.3. Number and age of males and females in poor households ... 5
3.4. Household size and dependency ... 6
3.5. Possession of an identification card ... 7
3.6. Disability and chronic illness ... 9
3.7. Education ... 11
3.8. Employment ... 12
3.9. Access to social protection programs ... 15
3.10.Access to water and electricity ... 16
4. Key issues and opportunities ... 17
5. Conclusions ... 19
6. References ... 20
Attachment 1 Additional data tables ... 21
List of tables and figures
Table 1 Number and percentage of male and female-headed households in deciles 1-3 (UDB) and population
(Population census 2010) 3
Figure 1 Distribution (percentage) of male and female-headed households in each age group, deciles 1-3 (UDB) 4
Table 2 Number of households by age group and sex of the head of the household, deciles 1-3 (UDB) 4
Figure 2 Marital status by age group of female and male heads of households in deciles 1-3 (UDB) and population
(Population census 2010) 5
Table 3 Number and percentage of males and females in deciles 1-3 (UDB) and total population (Population census
2010) 5
Figure 3 Age specific sex ratios in deciles 1-3 (UDB) and population (Population census 2010) 6
Figure 4 Household size of male and female-headed households in deciles 1-3 (UDB) 7
Table 4 Household size by decile and sex of the household head in deciles 1-3 (UDB) 7
Table 5 Dependency ratios for female and male-headed households in deciles 1-3 (UDB) 7
Table 6 Possession of an identification card by male and female heads of households and individuals over 20 years
of age in deciles 1-3 (UDB) 8
Figure 5 Possession of an identity card by female and male heads of households and females and males over 20
years of age, deciles 1-3 (UDB) 8
Table 7 Prevalence of disability and chronic illness in male and female-headed households, deciles 1-3 (UDB) 9
Figure 6 Percentage of disability and chronic illness reported by males and females by age group, deciles 1-3 (UDB) 9
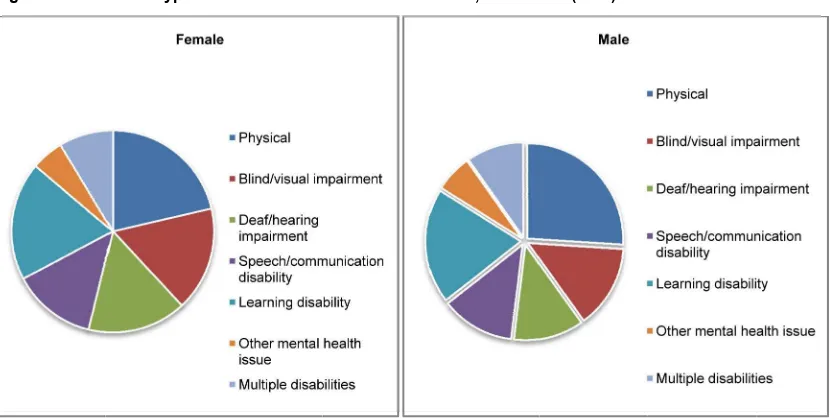
Figure 7 Shares of types of disabilities in males and females, deciles 1-3 (UDB) 10
Figure 8 Shares of types of chronic illness in males and females, deciles 1-3 (UDB) 11
Table 8 Highest education levels completed in male-headed and female-headed households by decile, (UDB) and in
the population (Susenas 2010) 11
Table 9 Highest education levels completed by females and males in deciles 1-3 (UDB), and in the population
(Susenas 2010) 12
Figure 9 Percentage of working females and males by age group, deciles 1-3 (UDB) and population (Susenas 2010) 13
vi
Gender Analysisof the Unified Database
Figure 11Average hours worked in a week by working individuals, by age and sex, deciles 1-3 (UDB) 14
Figure 12Shares of most common work sectors for working males and females, deciles 1-3, (UDB) 15
Table 10 Reported receipt of social protection programs by sex of household head, deciles 1-3 (UDB) 15
vii
Gender Analysis
of the Unified Database
Acronyms and glossary of Indonesian terms
BDT Basis Data Terpadu untuk Program Perlindungan Sosial
Unified Database for Social Protection Programs
BSM Beasiswa untuk Siswa Miskin Scholarships for Poor Students
BPS Badan Pusat Statistik Central Bureau of Statistics
Jamkesmas Jaminan Kesehatan Masyarakat Health insurance for the Poor
Jamsostek Jaminan Sosial Tenaga Kerja Employees Social Security System
KB Keluarga Berencana Family planning
PKH Program Keluarga Harapan Hopeful family program (conditional cash transfer program)
PLN Perusahaan Listrik Negara State Electricity Company
PPLS Pendataan Program Perlindungan
Sosial
Data collection for social protection programs
Raskin Beras untuk rumah tangga miskin Rice for poor households
SIM Surat Izin Mengemudi Driver’s licence
Susenas Survei Sosial Ekonomi Nasional National Socio-Economic Survey
TNP2K Tim Nasional Percepatan
Penanggulangan Kemiskinan
viii
Gender Analysis1
Gender Analysis
of the Unified Database
1. Introduction
This analysis aims to contribute to an improved understanding of gender differences in the characteristics of poor households, and particular factors that need to be considered to ensure gender equity in access to social protection initiatives. It has been made possible by the collection of sex-disaggregated data at a household and intra-household level as part of the Social Protection Program Data Collection (Pendataan Program Perlindungan Sosial- PPLS) in 2011, and consolidation of this data in the Unified Database for Social Protection Programs (UDB).
The Unified Database is a system for identifying potential beneficiaries of social protection programs implemented as part of poverty reduction efforts in Indonesia. The database contains detailed socio-economic and demographic information (including names and addresses) on the poorest 40 percent of the population, which encompasses the target groups of most social protection programs in Indonesia. The Unified Database is currently being used to select beneficiaries for government poverty reduction and social protection programs including:
Health insurance for the poor (Jaminan Kesehatan Masyarakat - Jamkesmas), which provides free access to a wide range of healthcare services to households in the poorest 30 percent of the population identified in the database;
Hopeful Family Program (Program Keluarga Harapan - PKH), which provides cash transfers to very poor households with pregnant women, infants/toddlers, and/or school age children. Payments are conditional on school attendance and use of maternal and child health services;
Government scholarships to assist in covering the costs of schooling for poor school-age children (Beasiswa untuk Siswa Miskin - BSM);
Subsidised rice for poor households (Beras untuk rumah tangga miskin- Raskin);and Some local government development programs.
The following analysis providesa snapshot of the current situation, therefore providing some baseline information for future monitoring of the composition of poor households firstly disaggregated by sex of the household head, and where possible, other members. It is hoped that this research can help contribute to increased gender sensitive in activity design and policy formulation. Some areas where further analysis would be useful are also identified.
2. Methodology
PPLS was collected between July and October 2011 by the Central Bureau of Statistics (Badan Pusat Statistik - BPS). Approximately 25.2 million Indonesian households were surveyed throughout the country in each of Indonesia’s more than 80,000 villages with the aim of capturing the poorest forty percent of the population.2PPLS data is the key data source ofthe Unified Database for Social Protection Programs,which is managed by the National Team for Accelerating Poverty Reduction (Tim Nasional Percepatan Penanggulangan Kemiskinan - TNP2K).
Given the intended use of the data, the sampling strategy for the PPLS was designed to target households likely to be poor and near-poor.3Proxy-means testing (PMT) methodology was used to classify households in the UDB according to their predicted welfare levels. PMT estimates the welfare (consumption) level of households based on multiple dimensions of poverty including education, household demographics, occupation, housing characteristics, and assets. Based on the PMT welfare
2
Further detail on PPLS process and the targeting process is available from TNP2K (www.tnp2k.go.id). 3
2
Gender Analysisof the Unified Database
index, households in the UDB have been categorised based on their decile in the consumption distribution. This report focuses on the poorest 30 percent of the population (deciles one to three), which includes poor households as well as those categorised as near poor.
Through PPLS, a range of sex-disaggregated data were collected. As the focus of poverty reduction programs is frequently on the household unit, the household becomes a key unit of analysis, with the disaggregated variable being the sex of the head of the household. To some extent, the situation and experiences of female-headed households provide a proxy indicator for the situation and experience of women more broadly. For example, we might assume that if information and services are accessible to female-headed households, then they should also be to women in male-headed households. However, it is important to note that there will be some factors unique to female-headed households when interpreting any data. Further, useful descriptive and comparative information may be drawn from analysis at the individual level. Therefore for this analysis, descriptive statistics were extracted from the Unified Database on a range of variables disaggregated to compare between female and male-headed households and household heads, and where possible, between all female and male individuals.
The main focus of the data analysis is on the poorest three deciles in the Unified Database, however in order to explore the extent to which gender disparities among the poor are consistent or different from trends in the full population (all deciles), there is some comparison with data from the 2010 Indonesian Population Census and the 2010 National Socio-Economic Survey (Susenas).4
Several suggestions are offered as next steps for future research that could build upon this work. First, it would be helpful to complement these descriptive data with more rigorous quantitative analyses that aim to identify the causal relationships between variables related to gender and poverty reduction. Qualitative research methods might also be able to provide some in-depth insights into some of the socio-cultural dynamics relevant to gender and poverty, which could usefully complement the quantitative analysis used in this paper. In addition, this type of analysis could be explored in greater depth at the provincial or district level given that there may be significant differences in gender-related situations across regions.Relatedly, one limitation of the current research is that at the time of writing this study, some data was not available for Papua and West Papua provinces.
4
3
Gender Analysis
of the Unified Database
3. Results
3.1. Number of female and male-headed households
There are nearly three million female-headed households in the poorest three deciles of the Unified Database, including over 600,00 in decile one, 900,000 in decile two, and 1.3 million in decile three (Table 1). In total, they represent 15 percent of the poorest three deciles of the population in the Unified Database. By comparison, female-headed households comprise 14 percent of all households according to the Indonesian population census.
Perhaps surprisingly, according to the proxy-means testing process used to classify the welfare status of households in the Unified Database, female-headed households appear to be less likely to be poor overall, although they are more likely to be in the near poor category. In particular, female household heads comprise only 10 percent of households in the poorest decile. In the second poorest decile, at 15 percent of households, female-headed households are just above national figures. In the third poorest decile they represent a substantially greater proportion (21 percent) than the national average.
The findings highlight the importance for future research on gender inequalities to focus not only poor households but also on near-poor households above the poverty line. This third decile is also in a vulnerable position and may benefit from the protection of social safety nets. It is estimated for instance that the poorest 40 percent of households in Indonesia this year have a 10 percent chance of falling into poverty next year[1]. It would also be useful for future research to analyse how different methods of defining and measuring poverty may affectgender differences observed among the poor.5
Table 1 Number and percentage of male and female-headed households in deciles 1-3 (UDB) and population (Population census 2010)
Number of households Percentage of households in decile
Data Source Decile
Male- headed
Female-headed Total
Male- headed
Female-headed Total
UDB Decile 1 5,612,658 600,120 6,212,778 90% 10% 100%
Decile 2 5,225,527 939,460 6,164,987 85% 15% 100%
Decile 3 4,839,972 1,324,784 6,164,756 79% 21% 100%
Total deciles 1-3 15,678,157 2,864,364 18,542,521 85% 15% 100%
Census TOTAL population 52,619,192 8,538,400 61,157,592 86% 14% 100%
It is also possible that the actual number of female-headed households is higher than what is recorded in official data, due to social conventions regarding male and female household roles, reinforced by the Indonesian Marriage Law Number 1 (1974). This law states that the head of a household is the husband or man. Guidelines from the BPS currently specify that the head of a householdcan be defined as either: (i) the person responsible for the household’s daily needs or (ii) the person who is considered the head of the household. As only one person can be named as the head of the household, logic suggests that convention would often prevail and a male would be recorded as the head of the household, even if absent or if the female is responsible for household upkeep. Empowerment of Female Heads of Households (Pemberdayaan Perempuan Kepala Keluarga- PEKKA) national organisation therefore considers that an under-estimation of the number of female-headed households in Indonesia is probable [3].
5One relevant finding from recent research, for example, is that conditional on actual per capita consumption, households headed by widows tend
4
Gender Analysisof the Unified Database
3.2. Age and marital status of female and male heads of households
A higher proportion of female heads of households are in older age groups compared to their male counterparts as shown in Figure 1. Among households in deciles one to three, the average age of female heads of household is 55 years, while it is 46years for male household heads. Only 7 percent of all male household heads are above the age of 60, while 24 percent of female household heads are in this elderly age group. Meanwhile, only 11 percent of female household heads are below the age of 40 in contrast to 35 percent of male household heads.
Figure 1 Distribution (percentage) of male and female-headed households in each age group, deciles 1-3(UDB)
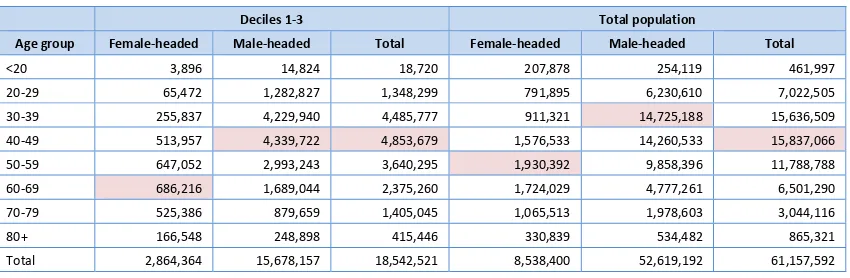
Table 2 shows that for deciles one to three, the mode age range (shaded) is 60-69 for female household heads and 40-49 for male household heads. The large discrepancy between the ages of female and male household heads likely contributes to many of the other differences observed such as in marital status and disability prevalence, as discussed later in this report.
Table 2 Number of households by age group and sex of the head of the household, deciles 1-3 (UDB)
Deciles 1-3 Total population
Age group Female-headed Male-headed Total Female-headed Male-headed Total
<20 3,896 14,824 18,720 207,878 254,119 461,997
20-29 65,472 1,282,827 1,348,299 791,895 6,230,610 7,022,505
30-39 255,837 4,229,940 4,485,777 911,321 14,725,188 15,636,509
40-49 513,957 4,339,722 4,853,679 1,576,533 14,260,533 15,837,066
50-59 647,052 2,993,243 3,640,295 1,930,392 9,858,396 11,788,788
60-69 686,216 1,689,044 2,375,260 1,724,029 4,777,261 6,501,290
70-79 525,386 879,659 1,405,045 1,065,513 1,978,603 3,044,116
80+ 166,548 248,898 415,446 330,839 534,482 865,321
Total 2,864,364 15,678,157 18,542,521 8,538,400 52,619,192 61,157,592
The marital status profile for female and male household heads is quite different (see Figure 2). The marriage status indicator collected in PPLS data includes four options: single, married, divorced, and widowed. Being a widow appears to be the primary reason for women to be listed as the head of the household (75percent). Other marital status data for female household heads are divorced (14 percent), married (10 percent), and single (2 percent). By contrast, almost all male heads of households are married (96percent).The proportions are reasonably consistent across deciles.6
These marital status patterns vary significantly across age groups, especially for female household heads. For instance, only about 33 percentof female household heads below the age of 50 are widowed, while 80 percentof those above 50 years old are widowed. A higher percentage of male household heads are married at all age levels. Only 4 percent of male household heads over 50 are widowed, and the widowhood rate is only 18 percent even at its peak in the age group over 80 years.
6
Two areas of variation within the poorest three deciles are that among female household heads, a higher percent of those in the poorest decile are married (16percent) compared to decile two (10percent) and decile three (9.5 percent), and the poorest decile contains a slightly smaller proportion of widows than higher deciles (68percent in decile one, 75percent in decile two, and 78 percent in decile three).
0% 5% 10% 15% 20% 25% 30%
<20 30 40 50 60 70 80
Percentage
of
households
Age group
5
Gender Analysis
of the Unified Database
These patterns suggest that most men remarry after the death of their spouse, whereas many women do not. female is listed as the household head. In these cases, recognition of a married woman as head of the household may be associated with the absence, disability or chronic illness of their spouse (see section 0).
3.3. Number and age of males and females in poor households
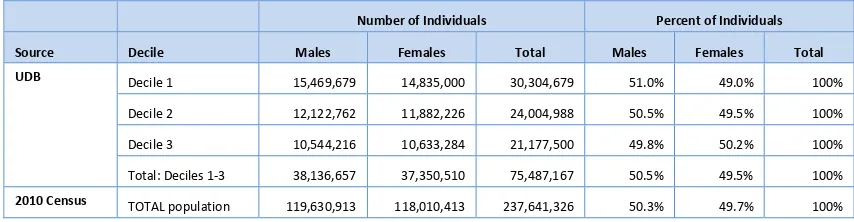
As seen in Table 3, overall Indonesia has an almost even ratio of males to females, although small differences such as the 0.7 percent difference recorded in the 2010 census amounts to 1.62 million more men than women. According to the Unified Database, in total, there are 38.14 million males and 37.35 million females in the poorest three deciles. In the poorest decile, the difference between the number of males and females is at its largest, with over 630,000 more men (51 percent) than women (49 percent).7 This difference reverses in the thirddecile, where there are slightly more women (50.2 percent) than men (49.8 percent), which is very close to the percentages across the full population.
Table 3 Number and percentage of males and females in deciles 1-3 (UDB) and total population (Population census 2010)
Number of Individuals Percent of Individuals
Source Decile Males Females Total Males Females Total
UDB Decile 1 15,469,679 14,835,000 30,304,679 51.0% 49.0% 100%
Decile 2 12,122,762 11,882,226 24,004,988 50.5% 49.5% 100%
Decile 3 10,544,216 10,633,284 21,177,500 49.8% 50.2% 100%
Total: Deciles 1-3 38,136,657 37,350,510 75,487,167 50.5% 49.5% 100%
2010 Census TOTAL population 119,630,913 118,010,413 237,641,326 50.3% 49.7% 100%
7 This is perhaps indicative of the association between poverty and proportionally higher morbidity and mortality for women, in keeping with
global trends.For example, the 2012 World Development Report discusses that the rate at which girls and women die relative to men is higher in low- and middle-income countries than in high-income countries [4].
6
Gender Analysisof the Unified Database
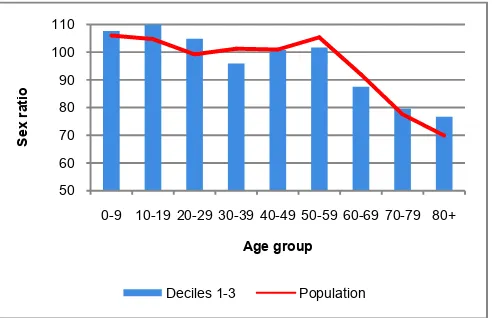
There are some differences observed between the age specific sex ratios8in the poorest three deciles and those in the whole population (see Figure 3), although the main overall trendsare the same, with the highest sex ratios in the under 20 age group, and a steady decline starting around the age of 60 years. One differenceis a higher ratio of men to women among the poorest deciles compared to the full population for the age groups below 30 years. Meanwhile, for the 30-39 age group, the sex ratio is lower in deciles one to three compared to the whole population (96 compared to 101). Many potential factors may affect these sex ratio patterns , including the rates of male and female morbidity in poorer deciles relative to other deciles and particular migration patterns such as high male outward migration.
Figure 3 Age specific sex ratios in deciles 1-3 (UDB)and population (Population census 2010)
Sub-national analysis suggests considerable variation in age specific sex ratios between provinces, with some of the highest ratios in Kalimantan Tengah, Kalimantan Timur, Papua Barat, and Papua, and low extremes in Nusa Tenggara Barat and Nusa Tenggara Timur. Larger differences in the number of males and females, particularly in reproductive and working age groups (15-65) have a range of implications for fertility, family composition, and employment patterns, and thus considerable implications for poverty reduction strategies. Provincial data tables are provided in Attachment 1.
3.4. Household size and dependency
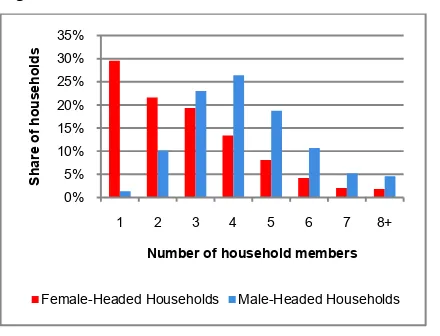
Figure 4shows that male-headed households tend to be larger than female-headed households. Male-headed households in the poorest three deciles have an average household size of five members compared to four members for female-headed households. Among deciles one to three, 70 percent of female-headed households have three or fewer members, while 66 percent of male-headed households have four or more members. These patterns of gender differences are reasonably consistent with available population data [5].
Of the nearly 850,000 single-person households recorded in the Unified Database, 80 percent are headed by females. 30 percent of all female-headed households in the databaseare single-person households.
For both male and female-headed households, larger households are more represented in the poorest decile, compared to deciles two and three (Table 4). Out of all single-person households, for instance, only 10 percent are in decile one compared to 30 percent in decile two and 60 percent in decile three. Meanwhile, over half of all households with six or more members are concentrated in decile one. These patterns are similar for both male and female-headed households.
8
This is the number of males per 100 females.
50 60 70 80 90 100 110
0-9 10-19 20-29 30-39 40-49 50-59 60-69 70-79 80+
S
e
x
r
a
ti
o
Age group
7
Gender Analysis
of the Unified Database
Figure 4 Household size of male and female-headed households in deciles 1-3 (UDB)
Table 4 Household size by decile and sex of the household head in deciles 1-3 (UDB)
Number of
Total 600,120 939,460 1,324,784 2,864,364 5,612,658 5,225,527 4,839,972 15,678,157
As shown in Table 5, female-headed households have close but slightly higher average dependency ratios9 than male-headed households (61 percentand 59 percent, respectively). Child dependency ratios are lower in female-headed households (37percent versus 51percent), and aged dependency ratios are higher in female-headed households (24percent versus 8percent). There is some variation between provinces, with Nusa Tenggara Timur and Sulawesi Barat having high average and child dependency ratios, and DI Yogyakarta and Java Timur having higher aged dependency ratios. Provincial data is included in Attachment 1.
Table 5 Dependency ratios for female and male-headed households in deciles 1-3 (UDB)
Dependency ratio
3.5. Possession of an identification card
Since having an identity card may be a prerequisite for receiving various programs and benefits from the government, gender differences in this variable are particularlypertinentformaximising the effectiveness of Indonesia’s poverty reduction strategy. PPLS asked if household members had a resident identity card (Kartu Tanda Penduduk- KTP), a driver’s license (Surat Izin Mengemudi - SIM), both KTP and SIM, or have no identity card. These results are summarised in Table 6 and displayed
9
8
Gender Analysisof the Unified Database
visually in Figure 5. Overall, significant differences in identity card ownership between male and female household heads can be observed. Across the three poorest deciles, 88 percent of male household heads have a KTP (including 4 percent with both KTP and SIM) in contrast to 79 percent of female household heads (includingonly 0.2 percent having both types of identification).Very few household heads (less than 1 percent) haveonly a SIM and not a KTP. In other words, while only 12 percent of male household heads do not have an identity card, the figure for female household heads is much higher at 21 percent. Rates of identity card non-ownership by the spouses of household heads are also high at 19 percent and this is consistent regardless of the sex of the household head. These figures are uniform across the poorest three deciles.
Further, the patterns in identity card ownership between male and female household heads are similar to gender differences existing across all male and female household members.For instance, among all individuals over the age of 20 in the UDB, 15 percent of males have no identity card compared to 21 percent of females. Gender differences in the possession of a driver’s license are particularly noticeable among this population, with rates below 1 percent for women compared to 5 percent for men. In summary, the UDB data indicate that obtaining a legal identity is more difficult (or is given a lower priority) for females, including female household heads, compared to their male associated with the card, whether for the photos required or an administrative fee, particularly if for a replacement card or an amendment to an existing card such as on moving house or marriage.
Table 6 Possession of an identification card by male and female heads of households and individuals over 20 years of age in deciles 1-3 (UDB)
Female-headed households Male-headed households All households
Household
*Note: Papua and West Papua provinces are excluded for reasons of data availability.
Figure 5 Possession of an identity card by female and male heads of households and females and males over 20 years of age, deciles 1-3 (UDB)
9
Gender Analysis
of the Unified Database PPLS doesn’t collect data on other forms of identification, particularly a family card (Kartu Keluarga -KK), ‘poverty letter’ (Surat Keterangan Tidak Mampu - SKTM) or a birth certificate. A SKTM often entitles the holder to access the range of social protection programs, and is generally available from the head of the village, and birth certificates are increasingly needed for children to be able to enrol in school, and then at various other points during the life cycle. In terms of exploring gender differences in access to poverty reduction programs, thesevariableswouldbe useful for future data collection.
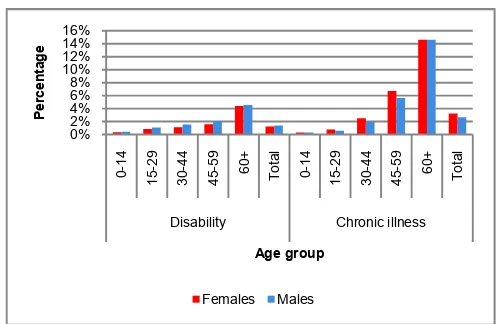
3.6. Disability and chronic illness
Prevalence of disability and chronic illness
The PPLS survey collects information on whether household membershavea disability or chronic illness and if so, what kind.10 The data inTable 7 shows thatamongst households in the poorest three deciles, a slightly higher proportion of female heads of households (4 percent) arerecorded as having a disability compared to male heads of households (2 percent). This is likely to be related to the higher ages of female household heads. More striking patterns emerge when focusing on the spouses of female heads of households, who have much higher rates of disabilities (10percent).
Table 7 Prevalence of disability and chronic illness in male and female-headed households, deciles 1-3 (UDB)
Number of individuals with a disability Percent of individuals with a disability
Male-headed
Number of individuals with a chronic illness Percent of individuals with a chronic illness
Head 824,781 331,107 1,155,888 5% 12% 6%
Spouse 585,870 4,945 590,815 4% 11% 4%
Other member 328,049 69,719 397,768 2% 4% 3%
*Note: Papua and West Papua provinces are excluded for reasons of data availability.
Amongst all males and females in the poorest three deciles, the overall prevalence of disability reported is similar between males (1.2 percent) and females (1.4 percent). As shown in Figure 6, the disability rates of men and women remain similar across all age groups, with the lowest prevalence (less than 1 percent) among children and young adults below age 30, and the highest rates (over 4 percent) among those above 60 years old.
Figure 6 Percentage of disability and chronic illness reported by males and females by age group, deciles 1-3 (UDB)
*Note: Papua and West Papua provinces are excluded for reasons of data availability.
10
Note that there may be a margin of error with these data as they are based on self-reported responses from households as opposed to diagnosis by a medical professional. There may also be some confusion among households or surveyors surrounding what constitutes a disability.
11
Gender Analysis
of the Unified Database
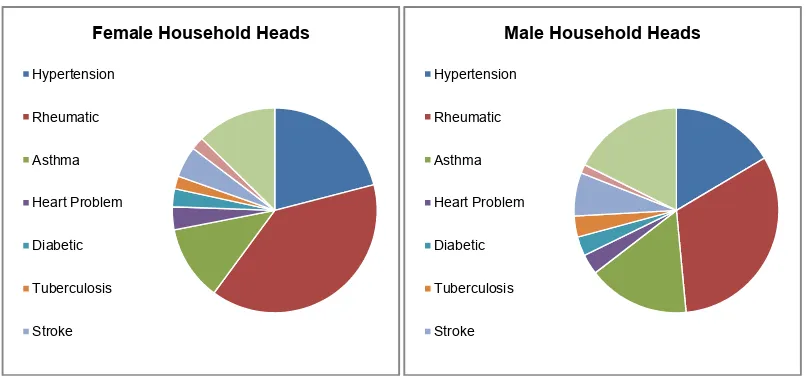
Figure 8 Shares of types of chronic illness in male and female household heads, deciles 1-3 (UDB)
*Note: Papua and West Papua provinces are excluded for reasons of data availability.
3.7. Education
Female heads of households in the poorest three deciles are less likely than male household heads to have completed primary education and higher levels of education (see Table 8). Overall, the share of household heads with no education or only primary education is quite high for both females (91 percent) and males (79 percent). Only 52 percent of female household heads report to have completed at least primary-level education in contrast to 74 percent of male household heads. Further, 9 percent of female households heads have completed at least junior secondary school in contrast to 22 percent of male household heads, and at the senior secondary level the rates are three percent and 8 percent, respectively. Less than 1 percent of household heads of either sex have completed tertiary education.
Table 8 Highest education levels completed in male-headed and female-headed householdsby decile, (UDB)and in the population (Susenas 2010)
It is also useful to examine the highest level of education achieved by any member of the household. It is common that another household member may be more educated than the household head due to general patterns of higher education completion among younger generations, for example. Table 8 shows that on average, the highest level of education completed within each household (by any
12
Note there were a large number of missing values in the answers to this question in PPLS. The percentages provided in this table are based on the numbers of male and female heads of households for which an answer was recorded, rather than the total number of male and female heads of households in deciles one to three.
Female Household Heads
Female-headed households Male-headed households Female-headed households Male-headed households
Head Any
size (N)12 1,796,129 2,864,331 13,687,798 15,675,522 6,953,008 8,951,498 51,186,457 53,675,798
None 48% 36% 26% 13% 36% 24% 18% 7%
12
Gender Analysisof the Unified Database
member) is significantly higher than the completion level of the household head, however, gender disparity persists between male and female-headed households. For instance, only 34 percent of female-headed households contain a member who has completed junior secondary education or higher, while the figure is 48 percent for male-headed households.The right side of the table focuses on the full population, where rates of schooling completion among household heads and members are higher than in the poorest deciles,but significant gender gaps remain.
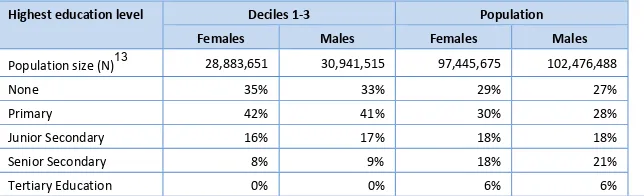
By comparison, Table 9 shows that there is little difference in the highest education level of individual females and males in deciles 1-3 or in the full population, which is likely to be a reflection of Indonesia’s progress in achieving parity for girls’ and boys’ enrolment in school.
Table 9 Highest education levels completed by females and males in deciles 1-3 (UDB), and in the population (Susenas 2010)
Highest education level Deciles 1-3 Population
Females Males Females Males
Population size (N)13 28,883,651 30,941,515 97,445,675 102,476,488
None 35% 33% 29% 27%
Primary 42% 41% 30% 28%
Junior Secondary 16% 17% 18% 18%
Senior Secondary 8% 9% 18% 21%
Tertiary Education 0% 0% 6% 6%
*Note: Papua and West Papua provinces are excluded for reasons of data availability.
These rates of education attainment have important implications for socialisation or information dissemination strategies for the various social protection programs. To effectively reach female-headed households in particular, non-written forms of information are likely to be needed because the generational transition in educational attainment is not yet complete. With 36percent of female-headed households in the poorest three decileswithout a member who has completed even primary education, it cannot be assumed that these households will be able to easily turn to someone to help with any program requirements requiring even basic literacy.
3.8. Employment
Work status
The PPLS survey asks about the work status of all household members over the age of five, including whether they usually work, the number of hours worked in the week prior to the survey, and the work sector. Overall,a much higher percentage of male heads of households (91percent) in deciles one to three reportto be working compared to female heads of households (60percent).14Similar gender differences exist among all females and males in the poorest deciles. Among adults between the ages of 30 and 50 in the poorest deciles, for instance, 93 percent of males work compared to 57 percent of females. Figure 9shows differences in the work status of males and females, disaggregated by age group. The percentage of male and female individuals working in the poorest three deciles is equal only among the 0-14 age group; in all other age groups, the percentage of males working is significantly higher.There is little variation in these percentages across the poorest three deciles, and similar gender disparities are apparent among the full Indonesian population based on 2010 Susenas data. One marked difference however, is that Susenas indicates a much higher rate of working males age fourteen and under in the general population (30 percent), than in the poorest deciles (4 percent). Provincial tables for the work status of heads of households are included in Attachment 1.
13
Note there were a large number of missing values in the answers to this question in PPLS. The percentages provided in this table are based on the numbers of male and female heads of households for which an answer was recorded, rather than the total number of male and female heads of households in deciles one to three.
14
13
Gender Analysis
of the Unified Database
Figure 9 Percentage of working females and males by age group, deciles 1-3 (UDB) and population (Susenas 2010)
It should be noted that the answer choice categories15 for the work questions in PPLS (and in the census, as PPLS was based on this question format) do not specifically prompt for inclusion of paid or unpaid hours worked within the home, such as for family maintenance and child care – roles that in Indonesia, as globally, are predominantly filled by female household members.16
Work hours
Official data on whether a household is male or female-headed may be inconsistent with the actual economic or decision-making responsibility for that household. To explore this, the hours worked by male and female members of households as captured in the PPLS data were analysed, to see if male or female members of households worked more hours, and whether this was different in male or female-headed households. This analysis has its limitations because more hours worked may not translate to more income, so it is not possible to conclusively determine the sex of the primary income earner.17Nonetheless, some interesting patterns emerge, as shown in Figure 10.
Overall, more hours are worked by male household members in the vast majority of households (69 percent), while females work more hours in only 21 percent of households (the remaining 10 percent recorded the same number of hours or no hours for males and females). However,the percentage of households where females work more hours than males jumps to 51 percent among female-headed households. By contrast, males work the most hours in 77 percent of male-headed households.
15
These categories were 1. Rice/secondary crop farming; 2. Horticulture; 3. Plantation; 4. Catching fish; 5. Fish cultivation; 6. Livestock; 7. Forestry and other farming; 8. Mining/digging; 9. Processing industry; 10. Electricity and gas; 11. Building/construction; 12. Trade/commerce; 13. Hotel and restaurant; 14. Transportation and warehousing; 15. Information and communication; 16. Finance and insurance; 17 Education service; 18. Health service; 19. Social, government, personal service; and 20. Other.
16
For example see [6] which cites 2009 Sakernas data showing that women’s participation in unpaid family labour is much higher than men’s (approximately 32 percent to compared to 8 percent).
17
It is likely that female hours yield less income that equivalent male work hours: Pirmana found that female workers received only 71-76 percent of their male counterparts’ wages in 1999–2004 [7].
0% 10% 20% 30% 40% 50% 60% 70% 80% 90% 100%
Female Male Female Male
Deciles 1-3 Population
Percentage
of
population
Working population
14
Gender Analysis15
Gender Analysis
of the Unified Database
Figure 12 Shares of most common work sectors for working males and females, deciles 1-3, (UDB)
*Note: Papua and West Papua provinces are excluded for reasons of data availability.
These relative shares shown for males and females in the poorest deciles are similar among household heads of each sex. The patterns are also similar in the general population except that a higher percentage of males and females work in the agricultural sector among the poorest deciles compared to all deciles.
3.9. Access to social protection programs
The Unified Databaseincludes data on whether households receive a range of social protection programs. The data are based on household responses and should be used only as avery rough indication of relative coverage of programs in 2011. For example, some household members and survey enumerators may not have been adequately familiar with the names of the programs to give a correct response. As seen in Table 10, proportionally slightly fewer female-headed households receive the conditional cash transfers program (Program Keluarga Harapan - PKH),and substantially fewer access family planning (Keluarga Berencana – KB).This is not surprising given that the composition of female-headed households, with a high proportion of older household heads and single occupant households (see section 3.4), implies that proportionally fewer of these households are likely to need family planning assistance or to be eligible for PKH (which requires school age children or a pregnant woman occupant).
Table 10 Reported receipt of social protection programs by sex of household head, deciles 1-3 (UDB)
Number of Households Percentage of Households
Female-headed (N=2,864,364)
Male-Headed
(N=15,678,150) Total Female-headed Male-Headed
Program keluarga harapan (PKH)
(Hopeful Family Program) 64,799 489,947 554,746 2% 3%
Raskin
(Rice for poor households) 2,463,677 12,344,135 14,807,812 86% 79%
Jamkesmas
(Health insurance) 1,486,335 6,980,006 8,466,341 52% 45%
Other Health Insurance 103,728 662,564 766,292 4% 4%
Jamsostek
(Employees Social Security) 20,381 179,813 200,194 1% 1%
Keluarga berencana (KB)
Family planning 241,934 6,870,489 7,112,423 8% 44%
16
Gender Analysisof the Unified Database
79percent of male-headed households. For Jamkesmas, the rates are 52 percent and 45 percent, respectively. This trend is consistent with analysis by the World Bank which found that female-headed households are considerably more likely to receive the main social assistance programs (Raskin;the unconditional cash transfer (Bantuan Langsung Tunai - BLT); and Jamkesmas), regardless of consumption levels[1]. A future analysis will need to compare proportional access of male and female-headed households to these benefits conditional on meeting each program’s eligibility criteria.
3.10. Access to water and electricity
PPLS also asks a number of questions about the economic and physical status of the household, which are used to assess the welfare status of households in the PMT process. As seen in Table 11, there are only small differences between male and female-headed households. Female-headed households have a slightly higher rate of connection to state electricity (86 percent compared to 83 percent), and of accessing drinking water from a protected source (60 percent compared to 57 percent).
Table 11 Source of electricity and water for male and female-headed households, deciles 1-3 (UDB)
Female-headed households
Male-headed households
Population size (N) 2,864,364 15,678,157
Electricity source:
PLN (state) electricity 86% 83%
Non-PLN electricity 4% 4%
No electricity 10% 12%
Drinking water source:
Bottled water 3% 4%
Tap water 8% 8%
Protected source 60% 57%
17
Gender Analysis
of the Unified Database
4. Key issues and opportunities
While overall numbers of males compared to females are in accordance with general international patterns, the substantial differences that exist within provinces should be explored further:For example, in Nusa Tenggara Barat, the age specific sex ratio moves from 106 males to 100 females in the 10-19 age group, to 85 males to 100 females in the 20-29 and 30-39 age groups. Employment based poverty reduction programs will need to consider the impact of the absence of men on both paid employment and reproductive and care roles. In Papua, there are 97 males for 100 females in the 30-39 age group, whereas in the 40-49 and 50-59 age groups the jump is more extreme, respectively from 130 and 150 males to 100 women. Contributing factors, likely to include very high incoming male migration associated with the natural resource industries and transmigration, should be explored.
Globally such patterns have been associated with high rates of violence, a growth in transactional sex and associated risk behaviours, and an absence of family care [9 , 10 , 11].
There are likely to be more female-headed households than is indicated by the data, and current conventions for defining female-headed households give insufficient indication of the range of domestic situations:At the time of writing this study, a second study using a similar data collection instrument to PPLS is being managed by PEKKA.The guidelines for this study state ‘the head of the household may not be the husband. It means the head of the household is the member of the family who has the greater role in decision making and family finances’[12].Further, the categories for ‘marital status’ have been developed to more accurately represent the range of situations. These are: Not married (2) Married and living in the same house (3) Married but not living in the same house (4)Married but husband/wife has left (5) Divorced (6) Widow/Widower (7) Not married but living together. Using these categories should facilitate greater understanding of household composition, and provide a clearer picture of the number of women responsible for the daily needs of a household, particularly those who fall into categories 3 and 4 above. Based on PEKKA feedback, is highly possible that these households are recorded as male-headed households. It is recommended that the usefulness of these categories in the PEKKA research, and any resulting differences in the numbers of female headed householdsshould be analysed to see if they should be adopted as standardin future TNP2K research.
A question remains about multiple families in one household: In households where multiple families live together, which may occur for reasons related to poverty, there may be some risk of dilution or exclusion from social assistance benefits thatare only received by the nominated household head. This issue would not be unique to female-headed households but there are a number of social and economic factors that would logically suggest that this would be more the case for female-headed families.Additional analysis of household relationships recorded in the UDB would assist the understanding of multi-family households, and subsequently whether social protection benefits are likely to be enough to assist household members, or be otherwise overly diluted.
Currently female-headed households appear to have greater access to social protection:World Bank research records that female-headed households are considerably more likely to receive each of BLT, Jamkesmas, and Raskin, regardless of consumption levels [1]. This may indicate that communities have different criteria than those officially applied via proxy means testing to determine poverty, and thus eligibility, and consequently female-headed households ‘jump-the queue’. This issue has been explored in a number of studies [1 , 13].Relatedly, an interesting question for future research is the extent to which any gender differences observed in the UDB reflect actual conditions among the poor or possibly indicate that there may be certain unintended gender biases in the PMT models used to select poor households. Given that this group represents at least fifteen percentof poor and vulnerable households, understanding their particular circumstances is important, as is continued attention to whether targeting criteria are appropriate.This should be reviewed via comparisons between analysis of UDB, PEKKA research, and other data sources.
18
Gender Analysisof the Unified Database
costs, lack of a legal identity which may date from birth, not being legally recognised as the head of the household, or a lack of understanding of the process [3]. Indonesian identification systems and prerequisites for obtaining various cards have been unstandardised and complicated in the past, although promising reforms to establish a new and improved unique identification card system are currently in progress. Anecdotal information18 suggests that a Kartu Keluarga is the most important pre-requisite for a KTP. However in some areas, local regulations prohibit women from having a family card that lists them as the head of the household. In other areas, obtaining a Kartu Keluargaas a femalehousehold head requires a birth certificate, marriage certificate and then a divorce or death certificate for the absent male spouse. Each of these has its own cost and process which may be prohibitive for the poor, and perhaps especially difficult for poor women. Early reports from PEKKA field enumerators following their 2012 data collection suggest that the variety of cards and letters needed – often one for each social protection program– presents a further barrier[14]. These various cards and letters can come with a cost (not always official) or require a written application processes, which can be very challenging, if not prohibitive for the very poor with limited literacy. Given the importance of having an identity card to access social protection, it is recommended that this analysis be repeated at a district level to identify if specific measures need to be taken to facilitate poor households to obtain the necessary identification to access social protection programs, with particular attention to ensuring that female-headed households have equal access. It is also recommended that future rounds of PPLS explore the most appropriate indicators to include for this question. This may be asking about the Kartu Keluarga, birth certificate, SKTM as well as the KTP. The potential for a single access card should also be explored.
Female-headed households are disproportionally affected by chronic illness and disability, either the head herself, herspouse, or other households members. The additional care burden, and whether women headed households have sufficient access to health and support services for other members of their family warrants further exploration.
Low levels of education, particularly among female household heads, are likely to constrain socialisation and access to grievance processes: While Indonesia has achieved very good results in terms of universal basic education and enrolment parity for boy and girl students, the effects of previous poor access to education remain at the level of the household head. With fifty percentof female and thirty percent of male heads of households in the poorest decile having no education or having never completed primary schooling, non-written, easily accessible forms of socialisation and grievance procedures become very important.
Women’s labour force participation in poor households is particularly low: This raises the question of the income source for non-working female-headed households. If female heads of households (and in some cases their spouses as well) are not working, then they must be dependent on other income sources, which may or may not be secure. Promoting female workforce participation and wage equity should be important component of poverty reduction strategies. However, this also raises the issue of care. The relationships between globalisation, poverty, and care have been explored in a number of studies [15 , 16], with one finding being that there is substantial resistance to changes in the domestic division of unpaid work within households as women take on more paid work. The effects of this on families, particularly children who may pick up the care burden to the detriment of their own development and education, may justify further exploration because of a logical relationship to sustainable movement out of poverty. Although the definition of work used by BPS does include unpaid labour, it is likely that unpaid domestic work within the home is typically not considered as work by households or surveyors and is not generally counted. Being more specific about unpaid domestic work undertaken by women and men will provide greater recognition of, and a more realistic picture of the different roles played by women and men. Together these factors present a further argument for poverty programs to include greater attention to empowerment and domestic roles as well as external equity and equality.
18
19
Gender Analysis
of the Unified Database
5. Conclusions
Analysis of data in the Unified Database for Social Protection Programs according to the sex of the head of the household and where possible, other members of the households, identifies some important gender differences which may affect the ability of household members to access and benefit from social protection and other poverty reduction initiatives. These are particularly in the areas of access to an identity card, education, and employment.
The analysis finds that female-headed households are no more likely to be poorer than male-headed households, at least according to the PMT classification in the Unified Database. However, several factors may contribute to higher poverty vulnerability and less resilience to external shocks for female-headed households. These factors include the composition of female-female-headed households, as they tend to be smaller in size and are more likely to have aging household heads as well as disabled or chronically ill members, and further the higher unemployment and lower education levels that is observed among women in general.
A number of characteristics of poor households show little variation between male and female-headed households, particularly work sector, pregnancy, drinking water and electricity sources.
The descriptive analysis of data in the UDB provided in this report tells us something about the what,
but cannot adequately address questions about the why, or what do we do about this? It therefore should be considered as an entry point to identify areas where more focused qualitative or mixed-methods research can be designed, or informed discussions can be held, aiming to answer specific policy or implementation protocol related questions. This initial analysis suggests three priorities in relation to gender differences:
What forms of identification are needed to access social protection? What are the barriers to obtaining these, particularly for women and the poor, and how can these be overcome?
How can social protectionprograms to reach households where the head is illiterate or has very little education (a proportionally more frequent situation for female-headed households)? What strategies are needed to ensure effective socialization and grievance mechanisms?
How can female labour force participation in poor households be increased without damaging impacts on care patterns, or without prohibitive overall (unpaid and paid) labour burdens?
Other questions, such as related to areas of employment and poverty can be explored through mainstreaming in sector specific studies - in some cases already planned or in progress.
20
Gender Analysisof the Unified Database
6. References
1. World Bank (2012) Targeting poor and vulnerable people in Indonesia. Jakarta: World Bank.
2. Alatas V, et al. (2012) Targeting the Poor: Evidence from a Field Experiment in Indonesia.American Economic Review, 102(4): p. 1206-40.
3. Sumner C (2010) Access to Justice: Empowering female heads of household in Indonesia. Jakarta: PEKKA and AusAID.
4. World Bank (2012) World Development Report: Gender Equality and Development. Washington DC: World Bank.
5. Badan Pusat Statistik (2010) Percentage of Households by Province, Sex of Household Headed and Number of Household Members, 2009-2010. Available from:
http://www.bps.go.id/eng/tab_sub/view.php?kat=1&tabel=1&daftar=1&id_subyek=40¬ab=3.
6. Yumna A, et al. (2012) The politics of gender and social protection in Indonesia: opportunities and challenges for a transformative approach. London: Overseas Development Institute.
7. Pirmana V (2006) Earnings Differential between Male-Female in Indonesia: Evidence from Sakernas Data. Bandung: Padjadjaran University.
8. Badan Pusat Statistik (2010) Population Census Data 2010. Available from: http://www.bps.go.id/.
9. Hesketh Therese, and Xing Zhu Wei (2006) Abnormal sex ratios in human populations: Causes and consequences.Proceedings of the National Academy of Sciences, 103(36): p. 13271-13275.
10. Liisanantti A, and Beese K (2012) Gendercide: The Missing Women? Belgium: European Union.
11. UNFPA (2012) Sex Imbalances at Birth: Current trends, consequences and policy implications. Bangkok: UNFPA.
12. Pemberdayaan Perempuan Kepala Keluarga (PEKKA) (2012) Petunjuk pengisian, istilah, dan pengertian dalam kuesioner keluarga Pendataan Sistim Pemantauan Kesejahteraan Berbasis Komunitas Pekka (SPKBK - PEKKA). Jakarta: PEKKA.
13. Alatas V, et al. (2010) How to target the poor: Evidence from a Field Experiment in Indonesia. CEPR Public Policy Symposium, London School of Economics on 18-19 June.
14. (2012) Personal communication, PEKKA Cadres Reflection Meeting. 11-12 July.
15. Razavi S (2007) The Political and Social Economy of Care in a Development Context: Conceptual Issues, Research Questions and Policy Options. Geneva: United Nations Research Institute for Social Development (UNRISD).
16. Kabeer N (2007) Marriage, Motherhood and Masculinity in the Global Economy: Reconfigurations of Personal and Economic Life Brighton: Institute of Development Studies.
17. CIA (2011) Field listing: sex ratio.The World Factbook. Available from:
21
Gender Analysis
of the Unified Database
Attachment 1 Additional data tables
1. Numbers of males and females and age specific sex ratio, deciles 1-3 (UDB) and individual males and females in the general population (Population census 2010)
Deciles 1-3* Whole population**
Age group (years)
Sex Number Sex ratio
(M:F)
Number Sex ratio
(M:F)
0-9 Male 7,711,036 108 23,636,463 106
Female 7,160,833 22,295,719
Total 14,871,869 45,932,182
10-19 Male 8,065,542 110 22,276,723 105
Female 7,336,953 21,275,092
Total 15,402,495 43,551,815
20-29 Male 5,836,658 105 20,519,024 99
Female 5,568,301 20,683,052
Total 11,404,959 41,202,076
30-39 Male 5,631,247 96 19,286,874 101
Female 5,872,003 19,048,942
Total 11,503,250 38,335,816
40-49 Male 4,664,883 101 15,355,452 101
Female 4,627,885 15,210,382
Total 9,292,768 30,565,834
50-59 Male 3,109,143 102 10,266,313 105
Female 3,056,761 9,743,578
Total 6,165,904 20,009,891
60-69 Male 1,800,118 87 5,152,324 92
Female 2,057,526 5,600,468
Total 3,857,644 10,752,792
70-79 Male 1,001,023 80 2,373,803 78
Female 1,257,027 3,060,433
Total 2,258,050 5,434,236
80+ Male 317,007 77 763,937 70
Female 413,221 1,092,747
Total 730,228 1,856,684
All Male 38,136,657 102 119,630,913 101
Female 37,350,510 118,010,413
Total 75,487,167 237,641,326
* Source: UDB
22
Gender Analysisof the Unified Database
2. Comparative sex ratios by age from the region [17]
B
3. Sex ratio by province and age group deciles 1-3(UDB) and individual males and females in the general population (Population census 2010)
23
Gender Analysis
of the Unified Database 4. Average, child, and aged dependency ratio by province (UDB)
Average Dependency Ratio Child dependency ratio Aged dependency ratio
(age <15 and >=65) / age 15-64 (age<15/age 15-64) (age >=65 / age 15-64)
24
Gender Anal
ysis
of the Unified Da
tabase
Gender analysis of PPLS 2011 data Page 24
5. Work status of male and femaleheads of households by province deciles 1-3 (UDB) and population (Susenas)
Province
Female heads of households Male heads of households
Totals Working Temporarily not working Not working Totals Working Temporarily not working Not working