CHAPTER III
RESEARCH METHOD
In this chapter, the writer will describe about research methodology that will
use in conducting the study. It is purposed to answer the problem of the study. This chapter consists of the research type, research design, and variables of the study, population and sample, instruments of the study, data collection, and data
analysis.
A. Research Type
The writer used thequantitative approach in this study. It was because the writer investigated the effect of lexical simplification toward vocabulary mastery
and reading comprehension. The type of this study is ex-post facto design.
B. Research Design
The design of the studywas ex post facto design. Ex post facto design conduct after variation in the variable of interest has already been determined in
the natural course of events. This method is sometimes called causal comparative because its purpose is to investigate cause-and-effect relationships between
independent and dependent variables.42
42Ibid
Table 3.1
Scheme expost facto design
Group Pre-test Independent
Variable
Post-test
Students’ Vocabulary Mastery
Y1 X Y2
Reading Comprehension
C. Variables of the Study
There were two main variables of the study, namely independent and dependent variables. The independent variable is the one that we believe may
“cause” the result; the dependent variable is the one we measure to see the effects
the independent variable has on it.43 The present study includes the following variables:
1. The independent variable (X) of this study was alexical simplification. 2. The dependent variables (Y) of this study were students’ vocabulary
masteryandstudents’ reading comprehension.
D. Population and Sample 1. Population
The larger group about which the generalization is made is called
population. A population is defined as all members of any well-defined class of people, events, or objects.44 The population of this study was all students of
43
Alison Mackey, and Susan M. Gass, Second Language Research Metodhology and Design, London: Lawrence Erlbaum Associates, Inc.,2005, p. 120.
44
eleventh grade IPA students of SMA Muhammadiyah 1 Palangka Raya. The numbers of thepopulation were 58 students.
Table 3.2
Description of Population of the Eleventh Grade IPA Students of SMA Muhammadiyah 1 Palangka Raya
No Population Number of Population
1. Class XI IPA-1 29
2. Class XI IPA-2 29
Total 58
2. Sample
sample is a portion of population.45Based on the population which is grouped into classes, the sample of this study is cluster random sampling.In this
study, the samples are class XI IPA-1 and class XI IPA-2. The writer took 29 students randomly as participants. Meanwhile, the try outis conducted at the
twelfth grade IPA students of SMA Muhammadiyah1 Palangka Raya.
E. Instruments of the study
According to Ary, et al., theinstrument is a device for operationally defining a variable.46 Selecting appropriate and useful measuring instruments in critical to
the success of any research study. One must select or develop scales and instruments that can measure complex constructs such as intelligence,
45Ibid, p. 148. 46
achievement, personality, motivation, attitudes, aptitudes, interests and self-concept.47
There were two instruments used in this study, namely, test and documentation:
1. Test
According to Heaton "Test may be constructed primarily as devices to reinforce learning and to motivate thestudent, or primarily as a means of as seeing
the student's performance the language.”48
The major data in this study was the data of the students’vocabulary
mastery and reading comprehensionscore took from pre-test and post-test to be
conducted to find out the students’ vocabulary mastery and reading
comprehension before the treatment given, while post-test was conducted to find
out the students’ vocabulary mastery and reading comprehension after the
treatment given.
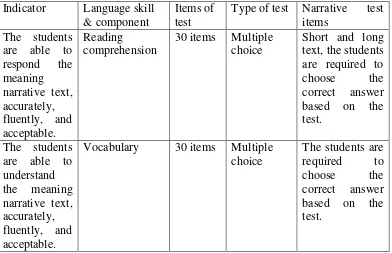
The test constructed in multiple choiceforms which consist of 60 items. The test items were adapted from Intan Pariwara Bahasa Inggris Kelas XI Semester 1.
The following table showed the content specification of the instrument where the item distributed to the students.
47Ibid, p. 200. 48
Table 3.3Content Specification of Items of in Research Instruments
Vocabulary 30 items Multiple choice
Distribution of students’ score criteria of Vocabulary
studentsthat got score 60-70, 1students that got score 50-60, and nine students that got score 0-50.
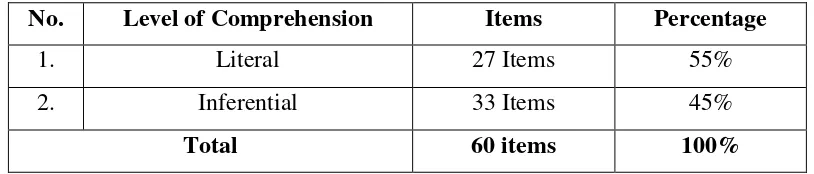
Table 3.5 Level of Comprehension Test Items
No. Level of Comprehension Items Percentage
1. Literal 27 Items 55%
2. Inferential 33 Items 45%
Total 60 items 100%
The reason why the test item was constructed in multiple choices from was
because multiple choice is anobjective test. Objective test is frequently criticized on the grounds that they are simpler to answers than subjective examinations.
Item in an objective test, however, can be made just as easy or as difficult as the test constructor wishes. Beside of having the strength, a test in form of multiple choices also has a weakness. Multiple choice test type encourages guessing. It can
be solved by doing try out of the test items to find out the test validity and reliability. 49
Because this test used 60 items test in the form of multiple choice, the
writer gave to the students’ result test by using the formula:
𝑆= 𝑛
𝑁 𝑥 100
Where:
S = Students’ score
n = Number of true answers
49
N = Number of the test
In connection with the score of students’ test, the writer used scoring
rubric as seen in table 3.5 as follows:
Table 3.6
Scoring Rubric for Students’ Reading Comprehension
Rubric Score Category
85-100 Excellent mastery level
75-84 Good mastery level
65-74 Fair mastery level
55-64 Good
0-54 Fair
The performance of the test items was obvious importance as compiling future tests. Since a great deal of time and effort are usually spent on the
construction of good objective items, in this case, is multiple choice items, most teachers, and test constructors will be desirous of their using them again without further changes or else adapting them future use. It is thus useful to identify these
items which were answered correctly by the most able students taking the test and badly by the less able students. The identification of certain difficult items in the
test, together with a knowledge of the performance of the individual destructors in multiple choice items, can prove just a valuable in its implications for teaching for testing.50
2. Documentation
The writer collects some documents from aplace of the study. In this case,
the writer collects whole of related documents in order to support the data. The
50
documentation will use to collect the data. Using the document would help the writer to describe the situation of theschool. The data that is collect in this
research are:
1) A number of students of eleventh grade IPA students at SMA
Muhammadiyah 1 Palangka Raya.
2) The students’ name list of eleventh grade IPA students at SMA Muhammadiyah 1 Palangka Raya.
3) The result of vocabulary and reading test.
F. Research Instruments Try Out
The try out of instrument was conducted in class XII IPA 1 with the number of thestudent was 20 students on Wednesday, 19th October 2016. The
writer conducted a tryout test before it applied to the real sample of this study. Try out of the instrument was necessary to know how valid, reliable and difficult the
instruments before it apply to the real sample. The writer obtained the instrument quality consists of instrument validity, reliability, index.
There were two treatments that used in this study, they were treatment 1
(instrument in the form of narrative text without lexical simplification) and treatment 2 (instrument in the form of narrative text with lexical
The try out was conducted in class XI IPS-1 which consists of 20 students. The procedures of the try out as follows:
1. The writer found out the original narrative texts which have asimilar level of difficulty for the students. There were six texts used in this study. The texts
were narrative texts. Here is the example of original narrative text: The Intelligent Artist
A very a long time ago, a one-eyed king ruled a country. He was fond of arts and crafts. He generously rewarded great artists, poets and craftsmen. However, he was stuck with one major habit. He never liked any person who falsely praised him! Simply, he was an honest man and wanted his people to be the same.
The king was born with one eye. He had vision with only his right eye and the space for his left eye was closed with skin! One day, he wanted a self-portrait and made an announcement. After filtering talented artist, the king asked three men to draw his face.
He told them, “If you do an impeccable job, I will reward you with more
than you earn in your lifetime! If not, you will be severely punished! “All three
agreed and started to sketch his face.
The first artist showed the painted picture of the king. The king felt bad as the picture showed that one of the eyes was shown to be blind, though he had drawn both eyes. The artist was sentenced to imprisonments for 10 years. The king felt that the picture was a dishonor to a ruler showing a physical disability!
The second artist showed the picture and he was imprisoned for 5 years. The picture depicted the king having vision with both eyes. The king felt he was falsely being praised only to earn the reward and it was also considered a matter
of dishonoring the king’s blindness!
The third artist showed the picture and was rewarded a fortune! He was
very clever as he had drawn the king’s face with only one eye!
(Course: Intan Pariwara Bahasa Inggris Kelas XI Semester 1)
2. The writer analyzed the level of difficulty of the texts by using
Table 3.7 Readability Formula of Narrative Text Without Lexical Simplification
3. The writer gave the instrument to respondents. Then the writer asked them to
underline the difficult words or the unknown words that contain on the texts. 4. The writer analyzed the obtained data to know the instrument validity,
reliability, index difficulty.
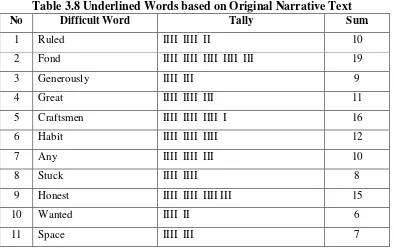
5. The writer presented the underlined words into a tally table. Here is anexample of underlined words that presented into a tally table.
Table 3.8 Underlined Words based on Original Narrative Text
No Difficult Word Tally Sum
1 Ruled IIII IIII II 10
2 Fond IIII IIII IIII IIII III 19
3 Generously IIII III 9
4 Great IIII IIII III 11
5 Craftsmen IIII IIII IIII I 16
6 Habit IIII IIII IIII 12
7 Any IIII IIII III 10
8 Stuck IIII IIII 8
9 Honest IIII IIII IIII III 15
10 Wanted IIII II 6
12 Self-portrait IIII II 6
13 Told IIII IIII IIII II 17
14 Impeccable IIII IIII IIII 12
15 Severely IIII IIII IIII II 14
16 Punished IIII IIII III 11
17 Imprisonments IIII IIII III 11
18 Disability IIII IIII II 10
19 Depicted IIII IIII IIII 12
20 Falsely IIII 4
21 Dishonoring IIII IIII 8
22 Fortune IIII IIII II 12
23 Rewarded IIII II 6
24 Praised IIII IIII II 10
25 Clever IIII 4
Total Tally 252
Total Underlined Word 24
6. The writer determined whether the underlined words difficult or not. In this
case, the writer used simple majority method (50 % + 1). Simple majority voting is the only anonymous, neutral, and positively responsive social choice
function between two alternatives. Further, this procedure is resolute when there are an odd number of voters and ties (indecision) are not allowed.51There were 20 students involved in underlining the difficult words or the unknown
words. Thus, 50 % + 1 of 20 students were 11 students. The words were classified as difficult words if the words were underlined by at least 11
students
.
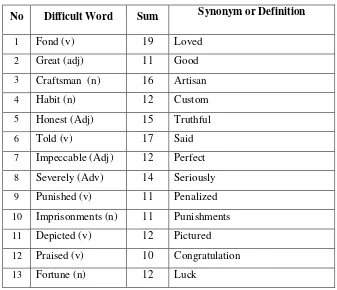
Then the writer replaced the difficult words or the unknown wordswith their synonym by following thetheory of simplification stages. If not
51
possible, their definitions were given between parentheses immediately after
the difficult words or unknown words. Then, the difficult words or the unknown words presented into a table.
Table 3.9 Difficult Words based on Tally Table
No Difficult Word Sum Synonym or Definition
1 Fond (v) 19 Loved
2 Great (adj) 11 Good
3 Craftsman (n) 16 Artisan
4 Habit (n) 12 Custom
5 Honest (Adj) 15 Truthful
6 Told (v) 17 Said
7 Impeccable (Adj) 12 Perfect 8 Severely (Adv) 14 Seriously
9 Punished (v) 11 Penalized
10 Imprisonments (n) 11 Punishments
11 Depicted (v) 12 Pictured
12 Praised (v) 10 Congratulation
13 Fortune (n) 12 Luck
7. The writer rearranged the texts after replacing the difficult words or the unknown words with their synonym or definition in order to make them coherent. Here is example of narrative text with lexical simplification:
The Intelligent Artist
A very a long time ago, a one-eyed king ruled (government) a country. He loved of arts and crafts. He generously rewarded good artists, poets, and artisan. However, he was stuck with one major custom. He never liked any person who falsely praised him! Simply, he was a truthful man and wanted his people to be the same.
space for his left eye was closed with skin! One day, he wanted a self-portrait (self-picture) and made an announcement (declaration). After filtering talented artist, the king asked three men to draw his face.
He said them, “If you do a perfect job, I will reward you with more than you
earn in your lifetime! If not, you will be seriously penalized! “All three agreed and
started to sketch his face.
The first artist showed the painted picture of the king. The king felt bad as the picture showed that one of the eyes was shown to be blind, though he had drawn both eyes. The artist was sentenced to punishments for 10 years. The king felt that the picture was a dishonor to a ruler showing a physical disability!The second artist showed the picture and he were imprisoned for 5 years. The picture pictured the king having avision with both eyes. The king felt he was falsely being congratulation only to earn the reward and it was also considered a matter of dishonoring the king’s blindness! The third artist showed the picture and was
rewarded a luck! He was very clever as he had drawn the king’s face with only
one eye!
(Course: Intan Pariwara Bahasa Inggris Kelas XI Semester 1)
G. Research Instruments Reliability
The good instrument in a study is not only the instrument valid but also
reliable to measure what supposed to be measured. Reliability is a necessary characteristic of any good test for being valid at all, a test must first be reliable as
a measuring instrument.52 Reliability is of primary importance in the use of both public achievement and proficiency test and classroom test.
The writer will examine the reliability of the item by using
M : the mean score on the test for all the testers
Vt : the standard deviation of all the testers’ score
The steps in tabulated of tests scores. a. Made tabulated of tests scores.
b. Measured the mean of the testees' scores with the formula: M= 𝑌
𝑁
c. Measured the total variants with the formula:
Vt= 2−
( 𝑌) )2
𝑁 𝑦
𝑁
Where:
Vt : the total variants
ƩY : the total of score
ƩY2 : the square of score total
N : the number of testes
d. Calculated the instrument reliability using KR-21.
e. The last decision was compared the value of Г11and Гt
Г11>Гtable= Reliable
Г11< Гtable= Nor Reliable
f. To know the level of reliability of instrument, the value of Г11 was interpreted based on the qualification of reliability as follows:
0.200 – 0.399: Poor Reliability 0.000 – 0.199: Very Poor Reliability
From the measurement of instrument try out reliability know that the numbers of test items were reliable or not.
H. Research Instrument Validity
The validity of a test is the extent to which it measures what is supposed to
measure and nothing else.53 The test can be said valid if it is able to measure what it is supposed to be measure.
a. Content Validity
Content validity is concerned with what goes into the test. A test will have high content validity if the items are representative of the population of
thepossible task. The content of a test should be decided by considering the purpose of the assessment and then drawn up as a list known as a content
specification.54
The instrument must be valid in content. It means that the items in the instrument are equal and proportional in their distribution as the indicators of the
test.From the measurement of validity, it was known that were 65 items (92, 85%) valid and 5 items (7,142%) invalid. (See Appendix 2)
b. Construct Validity
According to Heaton construct validity assumes the existence of certain learning theories and constructs underlying the acquisition of abilities and skills.
53Ibid
, p. 153 54
If a test has constructed, it is capable of measuring certain specific characteristics in accordance with a theory of language.55
The validities did in order to know the degree of the validity of the test items based on the coefficient correlation. To measure the validity of the
instrument, the writer will use the formulation of Product Moment by Pearson as follows56:
𝑋𝑌 ∶Multiplication Result between score X and score Y
N : Number of students
Furthermore, it was calculated using Test-t calculation below:
tobserved
r = The coefficient of correlation of the result of robserved
n = Number of students
The distribution of ttable at alpha 5% and the degree of freedom (n-2) with
the measurement of validity using these criteria:
55
J.B. Heaton. Language Testing. p. 154. 56
To know the validity level of the instrument, the result of the test will be interpreted to the criteria or the correlation index as follows:
0.800 – 1.000 = Very High Validity 0.600 – 0.799 = High Validity
0.400 – 0.599 = Fair Validity 0.200 – 0.399 = Poor Validity 0.000 – 0.199 = Very Poor Validity57
In the measurement of validity, the criteria are:
a. If the value of tobservedis greater thanttable, the instrument is valid.
b. If the value of tobservedis lower than ttable, the instrument is invalid.
c. The value of ttable can be seen at alpha= 5%
I. Index of Difficulties and Discrimination Power 1. Index Difficulties
The index of difficulty (or the facility value) of an item simply shows how easy or difficult the particular item proved in the test.58 The index of difficulty
57Ibid, 58
J.B. Heaton. Language Testing...p. 172
tobserved> ttable = Valid
(F.V.) is generally expressed as the fraction (or percentage) of the students who answered the item correctly. It is calculated by using the formula59:
F.V = 𝑅
𝑁
Notes:
F.V : Facility Value
R : Represent the number of correct answers
N : The total students
Then the result of the formula above is related to the value F.V as the following classification60:
F.V 0.00-0.30 : difficult F.V 0.30-0.70 : fair
F.V 0.70-1.00 : easy
From the measurement index of difficulties, it was known that there were 54 items
(77, 14%) fair and 16 items (22,85%) difficult. (See Appendix 2). 2. Discrimination Power
The method of extreme groups can be applied to compute a very simple
measure of the discriminating power of a test item. If a test is given to alarge group of people, the discriminating power of an item can be measured by
comparing the number of people with high test scores who answered that item correctly with the number of people with low scores who answered the same item
59Ibid, 60
correctly. If a particular item is doing a good job of discriminating between those who score high and those who score low, more people in the top-scoring group
will have answered the item correctly.
The item index of an item indicates the extent to which the item
discriminates between the tests, separating the more able tests from the less able. The index discriminationtells us whether those who performed well on the whole test tended to do well or badly on each item in the test.61
There are various methods of obtaining the index of discrimination; all involve a comparison of those students who performed well on the whole test and
who performed poorly on the whole test. It is calculated by using the formula.
D = 𝐶𝑜𝑟𝑟𝑒𝑐𝑡 𝑈−𝐶𝑜𝑟𝑟𝑒𝑐𝑡 𝐿
𝑛
Where : D = Discrimination Index U = Correct answer Upper half L = Correct answer lower half
N = The number of students
The writer most carefully distinguishes between n and N.
N = The number in the whole group.
n = The number of candidates in either the U or L group.
61
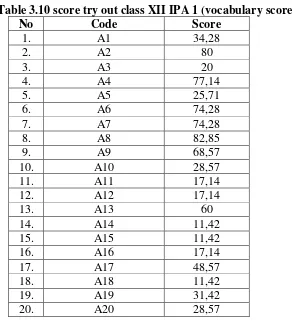
1. Distribution of Try out Scores of the X class
The test scores were presented in the following table.
Table 3.10 score try out class XII IPA 1 (vocabulary score)
No Code Score
Based on the data above, it can be seen that the students’ highest score was
82, 85 and the students’ lowest score was 11,42. To determine the discriminating
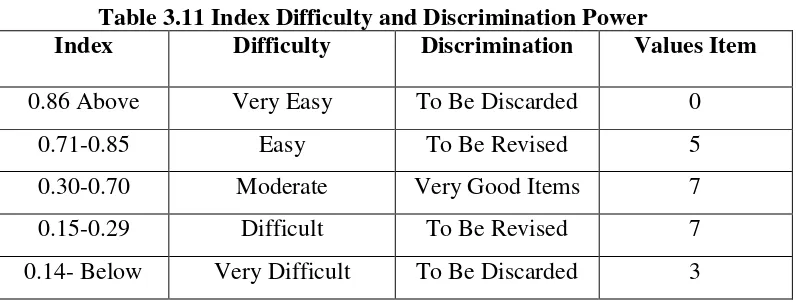
Table 3.11 Index Difficulty and Discrimination Power
Index Difficulty Discrimination Values Item
0.86 Above Very Easy To Be Discarded 0
0.71-0.85 Easy To Be Revised 5
0.30-0.70 Moderate Very Good Items 7
0.15-0.29 Difficult To Be Revised 7
0.14- Below Very Difficult To Be Discarded 3
Based on the data from the discrimination power (see appendix 2), it can
be seen that students’ get very good items was 7 and to be revised 12 then to be
discarded is 3 items.
J. Data Collection
To collect the accurate data in this study, the writer will use the instruments that appropriate to the problem statement:
1. Test
The test is a set of questions or exercises and other tools which are used to
measure skill, intelligence, knowledge, and ability those are had by individual or group.62 This method is used to get data about ascore of the pre-test and post-test
that was given for both of groups. The test in this study is a test for students’
vocabulary mastery and reading comprehension.
For collecting the data, the writer will use some steps in the procedure as
follows:
62
1. The writer observed the class.
2. The writer did try out in the tryout class.
3. The writer ask students to underlined the unknown word or difficult words in text.
4. The writer will analyze the result of the tryout, so the data gain from the test are valid and reliable.
5. The writer gives treatment to the text based on student’s underlined by using
lexical simplification and without lexical simplification. 6. The writer gave a score to data.
7. The writer analyzed the data that have been obtained from pre-test and post-test.
8. The writer interpreted the analysis result.
9. The writer concluded the activity of the study whether the effect of lexical simplification toward vocabulary mastery and reading comprehension, based
on the obtained.
2. Documentation
Based on Daymone and Holloway state that documentation is that data consisted of speech and pictured recorded. The document can be available in
thescript, activity report, sound, pictures, and digital data.63
63
In this study, documentation is used to get the data that related to the
object of research such as students’ reading comprehension, the number of
students, and the result of vocabulary and reading test. K. Data Analysis
In this study, the writer used ANOVA for analysis the data. Simple or one-way analysis of variance (ANOVA)is a statistical procedure used to analyze the data from a study with more than two groups. The data of this study is ascore of
students pre-test and post-test. Therefore, the data are in quantitative data. The data will be analyzed by means of inferential statistics. This statistical analysis is
suitable to answer the research problem. In this case, the writer will apply
one-way ANOVA to examine the students’ vocabulary mastery and reading
comprehension use that lexical simplification and the students’ vocabulary
mastery and reading comprehension use that not lexical simplification.
1. Techniques of Data Analysis
Before analyzing data using ANOVA Test, the writer should fulfill the requirements of ANOVA Test. They are Normality test, Homogeneity test, and
Hypothesis test.
a. Normality Test
It is used to know the normality of the data that is going to analyze whether both groups have normal distribution or not. In this study to test the normality, the writer will apply SPSS 18.0 program using Kolmogorov-Smirnov
significance is higher than α (5%) so the distribution data was normal. In the contrary, if the result of an asymptotic significance is lower than α (5%), it meant
the data was not anormal distribution. b. Homogeneity Test
Homogeneity is used to know whether experimental group and control group that are decided, come from apopulation that has arelatively same variant or not. To calculate homogeneity testing, the writer applied SPSS 18.0 program used
Levene's testing with thelevel of significance α (5%). If calculation result was higher than 5% degree of significance, so Ha was accepted, it means both groups
hadthe same variant and homogeneous. c. Testing Hypothesis
The writerapplied the one-way ANOVA statistical to test thehypothesis
with thelevel of significance 5% one-way ANOVA could be applied to test a difference mean or more. The steps are as follows:
1). Find out the grand mean (X) each group: Ʃ𝑋2𝑡 = 𝑋2 −( 𝑋2
𝑁 )
2). Find out the sum of square among group:
SSt= ∑X2–
( Xt )2)
𝑁
Where:
SSt = sum of square total
∑X2
= each score squared, then summed
(∑Xt)2 = all the scores summed first, then this sum squared
N = number of scores
SSb =
( X1 )2)
n1 +
( X2)2)
n2 -
( X2)2)
N
4).The sum of squares within groups SSw = SSt - SSb
5).Find out degree of freedom between group: Dfb= G-1
6).Calculate the between-groups mean square (MSb):
MSb = 𝑆𝑆𝑇
𝑑𝑓𝑏
7).Find out the degree of freedom within group: Dfw= N-1
8).Calculate within group mean score (MSw):
MSw = 𝑆𝑆𝑏
𝑑𝑓𝑤
9).Find the F ratio
F=MSb
MSw
10).Determine the level of significant of Fobservedby comparing the Fobservedwith
the Ftable.
2. Data Analysis Procedures
The writer did some steps in data analysis procedure, they are as follows:
a. Collected the students’ vocabulary and reading.
b. Arranged the obtained score into the distribution of frequency of score table.
c. Calculated mean, median, modus, standard deviation and standard
d. Measured the normality and homogeneity.
e. Analyzed the data by using one-way analysis of variance to answer the
problem of the study. In addition, the SPSS program is applied. f. Interpreted the result of analyzing data.
g. Make discussion clarify the research finding. h. Drawn conclusion.