Non-pharmacological interventions for perceptual disorders
following stroke and other adult-acquired, non-progressive
brain injury (Review)
Bowen A, Knapp P, Gillespie D, Nicolson DJ, Vail A
This is a reprint of a Cochrane review, prepared and maintained by The Cochrane Collaboration and published inThe Cochrane Library 2011, Issue 4
T A B L E O F C O N T E N T S
1 HEADER . . . .
1 ABSTRACT . . . .
2 PLAIN LANGUAGE SUMMARY . . . .
2 SUMMARY OF FINDINGS FOR THE MAIN COMPARISON . . . .
5 BACKGROUND . . . .
6 OBJECTIVES . . . .
6 METHODS . . . .
9 RESULTS . . . .
Figure 1. . . 13 Figure 2. . . 14 16 DISCUSSION . . . .
18 AUTHORS’ CONCLUSIONS . . . .
18 ACKNOWLEDGEMENTS . . . .
19 REFERENCES . . . .
21 CHARACTERISTICS OF STUDIES . . . .
38 DATA AND ANALYSES . . . .
Analysis 1.2. Comparison 1 Perceptual intervention versus control, Outcome 2 Activity at scheduled end of intervention. 40 Analysis 1.4. Comparison 1 Perceptual intervention versus control, Outcome 4 Perceptual impairment at scheduled end of
intervention. . . 41 Analysis 2.2. Comparison 2 Perceptual interventions: direct comparisons, Outcome 2 Activity at scheduled end of
intervention. . . 42 Analysis 2.4. Comparison 2 Perceptual interventions: direct comparisons, Outcome 4 Perceptual impairment at scheduled
end of intervention. . . 42 42 APPENDICES . . . .
49 HISTORY . . . .
49 CONTRIBUTIONS OF AUTHORS . . . .
49 DECLARATIONS OF INTEREST . . . .
50 DIFFERENCES BETWEEN PROTOCOL AND REVIEW . . . .
[Intervention Review]
Non-pharmacological interventions for perceptual disorders
following stroke and other adult-acquired, non-progressive
brain injury
Audrey Bowen1, Peter Knapp2, David Gillespie3, Donald J Nicolson4, Andy Vail5
1HCD, School of Psychological Sciences, Ellen Wilkinson Building, University of Manchester, Manchester, UK.2School of Healthcare,
University of Leeds, Leeds, UK.3Department of Neuropsychology, Astley Ainslie Hospital, Edinburgh, UK.4The Health Informatics Centre, Division of Clinical & Population Sciences & Education, University of Dundee, Dundee, UK.5Health Methodology Research Group, University of Manchester, Salford, UK
Contact address: Audrey Bowen, HCD, School of Psychological Sciences, Ellen Wilkinson Building, University of Manchester, Oxford Road, Manchester, M13 9PL, [email protected].
Editorial group:Cochrane Stroke Group.
Publication status and date:New, published in Issue 4, 2011. Review content assessed as up-to-date: 15 August 2010.
Citation: Bowen A, Knapp P, Gillespie D, Nicolson DJ, Vail A. Non-pharmacological interventions for perceptual disorders follow-ing stroke and other adult-acquired, non-progressive brain injury.Cochrane Database of Systematic Reviews2011, Issue 4. Art. No.: CD007039. DOI: 10.1002/14651858.CD007039.pub2.
Copyright © 2011 The Cochrane Collaboration. Published by John Wiley & Sons, Ltd.
A B S T R A C T
Background
Stroke and other adult-acquired brain injury may impair perception leading to distress and increased dependence on others. Perceptual rehabilitation includes functional training, sensory stimulation, strategy training and task repetition.
Objectives
To examine the evidence for improvement in activities of daily living (ADL) six months post randomisation for active intervention versus placebo or no treatment.
Search strategy
We searched the trials registers of the Cochrane Stroke Group and the Cochrane Infectious Diseases Group (May 2009) but not the Injuries Group, the Cochrane Central Register of Controlled Trials (The Cochrane Library2009, Issue 3), MEDLINE (1950 to August 2009), EMBASE (1980 to August 2009), CINAHL (1982 to August 2009), PsycINFO (1974 to August 2009), REHABDATA and PsycBITE (May to June 2009). We also searched trials and research registers, handsearched journals, searched reference lists and contacted authors.
Selection criteria
Randomised controlled trials of adult stroke or acquired brain injury. Our definition of perception excluded visual field deficits, neglect/ inattention and apraxia.
Data collection and analysis
Main results
We included six single-site trials in rehabilitation settings, involving 338 participants. Four trials included people with only stroke. All studies provided sensory stimulation, sometimes with another intervention. Sensory stimulation typically involved practising tasks that required visuo-perceptual processing with occupational therapist assistance. Repetition was never used and only one study included functional training. No trials provided data on longer term improvement in ADL scores. Only three trials provided any data suitable for analysis. Two of these trials compared active to placebo intervention. There was no evidence of a difference in ADL scores at the scheduled end of intervention: mean difference (95% confidence interval (CI)) was 0.9 (-1.6 to 3.5) points on a self-care ADL scale in one study and odds ratio (95% CI) was 1.3 (0.56 to 3.1) for passing a driving test in the other, both in favour of active intervention. The trial that compared two active interventions did not find evidence of difference in any of the review outcomes.
Authors’ conclusions
There is insufficient evidence to support or refute the view that perceptual interventions are effective. Future studies should be sufficiently large, include a standard care comparison and measure longer term functional outcomes. People with impaired perception problems should continue to receive neurorehabilitation according to clinical guidelines.
P L A I N L A N G U A G E S U M M A R Y
Non-pharmacological interventions for perceptual disorders following stroke and other adult-acquired, non-progressive brain injury
S U M M A R Y O F F I N D I N G S F O R T H E M A I N C O M P A R I S O N [Explanation]
Non-pharmacological interventions compared with standard care for perceptual disorders
Patient or population:people with perceptual disorders following acquired brain injury (stroke and trauma) Settings:rehabilitation units
Intervention:non-pharmacological therapy
Comparison:placebo or no treatment in addition to standard care
Outcomes Illustrative comparative risks* (95% CI) Relative effect (95% CI)
No of Participants (studies)
Quality of the evidence (GRADE)
Comments
Assumed risk Corresponding risk
Standard Perceptual intervention
Independence in activities of daily living
Effects lasting up to 6 months
No data No data None None
Independence in activities of daily living (ADL) Effects at scheduled end of intervention
The mean Rivermead ADL scale was 10.0 in the only trial to report this outcome
The mean Rivermead ADL in the intervention groups was 10.9
33 (1) ++OO
low
Based on single small study with unclear meth-ods: allocation and in-terim analysis processes Independence in activities
of daily living (ADL): driv-ing test pass rate Effects at scheduled end of intervention
Medium risk population OR 1.3 (0.56 to 3.1) 97 (1) +++O
moderate
Based on single small study
28 per 100 34 per 100
(18 to 55)
*The basis for theassumed risk(e.g. the median control group risk across studies) is provided in footnotes. Thecorresponding risk(and its 95% confidence interval) is based on the assumed risk in the comparison group and therelative effectof the intervention (and its 95% CI).
CI: Confidence interval; OR: Odds Ratio.
GRADE Working Group grades of evidence
High quality:Further research is very unlikely to change our confidence in the estimate of effect.
Moderate quality:Further research is likely to have an important impact on our confidence in the estimate of effect and may change the estimate. Low quality:Further research is very likely to have an important impact on our confidence in the estimate of effect and is likely to change the estimate. Very low quality:We are very uncertain about the estimate.
B A C K G R O U N D
Description of the condition
Stroke is the second most frequent cause of mortality worldwide (Murray 1997;WHO 2008), a key cause of disability (Donnan 2008) and results in a greater range of disabilities than any other condition (Dept of Health 2000). Each year around 15 million people around the world have a stroke (Mackay 2004). Traumatic brain injury (TBI) is a leading cause of death and disability in adults worldwide (Perel 2006). Estimates from England suggest the annual incidence of adults admitted to hospital with traumatic brain injury is 113,000 out of a population of over 50 million (Dept of Health 2000).
Stroke, and other adult-acquired brain injury, may impair a son’s perceptual abilities. Psychologists use perception (and per-ceptual disorders) as an umbrella term for a wide range of abil-ities (and difficulties). One psychologist’s detailed definition of perception is that it “involves active processing of the continu-ous torrent of sensations. This process comprises many successive and interactive stages. Those that deal with the simplest physical characteristics, such as colour, shape, or tone ... and ... more com-plex, ’higher’ levels of semantic and visuoconceptual processing ...” (Lezak 1995).
There are several controversies within the topic of perception. The main argument is about what is and what is not a perceptual dis-order. There is a difference of opinion as to whether perception is itself a subset of the broader area of cognition. Some health pro-fessionals distinguish between cognitive abilities (by which they mean attention, memory and thinking) and perceptual abilities. However, this review assumes that it is more useful to consider per-ception as a part of cognition when evaluating the adverse effects of brain injury and the interventions employed in rehabilitation. The topic of perception is particularly difficult to delimit precisely and appears to overlap with other cognitive and sensory areas. Perceptual disorders may affect any or all of the sensory modali-ties. This is demonstrated in the wide range of perceptual disor-ders which include visual, object, visual object agnosia, prosopag-nosia, spatial, visuospatial, tactile, body, sensation, location, mo-tion, colour processing and auditory perceptual disorders. Visual perceptual disorders are the most commonly researched. In the latest version of Lezak’s classic textbook of neuropsychological sessment, 30 of the 39 pages on perception are devoted to the as-sessment of visual perceptual disorders (Lezak 2004). In contrast, perceptual disorders of the auditory, tactile and olfactory modal-ities are briefly covered, particularly the latter two. Taste is not covered.
Assessment of perceptual disorders is one of the most difficult ar-eas for neuropsychologists working in clinical settings (Beaumont 1992). Most perceptual assessment tools appear to draw on other cognitive functions as well, for example attention, spatial orienta-tion, or memory.Lezak 1995argues that such overlap in
assess-ments is inevitable and in fact desirable given the overlap in the underlying mental functions and the ways they can be impaired. There are several standardised assessment batteries. The oldest is the Rivermead Perceptual Assessment Battery (RPAB). The RPAB (Whiting 1985) contains 17 different subtests (e.g. object match-ing, figure ground, body image). The Visual Object and Space Perception (VOSP) battery (Warrington 1991) contains four vi-sual object assessments (for example silhouettes) and four space perception tasks (for example position discrimination). The Birm-ingham Object Recognition Battery (BORB) contains 14 subtests (Riddoch 1993) including orientation match and foreshortened view. These test batteries tend to be used for identifying the under-lying perceptual impairment rather than as measures of the impact on everyday functioning. What they illustrate is the number of ways in which visual perception can be affected.
The prevalence of visual perceptual problems after stroke or TBI varies depending on the timing and types of assessments. Re-ported rates range from 54% of hemiplegic patients experiencing visual perceptual disturbances up to two years post stroke (van Ravensberg 1984), toEdmans 1991, who identified perceptual problems in 69% of patients one month post stroke and in 74% of patients two years post stroke. When compared to normative sam-ples, visual perceptual changes are evident in patients with severe TBI (McKenna 2006). Visual perceptual impairments at one year post injury have been reported for 31% of TBI patients, of which 18% had mild impairment and 12% severe impairment (Kersel 2001).
The impact of perceptual disorders on activities of daily living (ADL) is varied. It can range from difficulty crossing the road (due to an impairment of distance perception) to an inability to recog-nise a familiar object (for example a toothbrush - object agnosia) or person’s face (such as a spouse - prosopagnosia). These disor-ders can cause distress for the person affected and their family, and increase their dependence on others. Perceptual disorders can also hinder a person’s ability to participate fully in their rehabilitation programme, for example their sessions with the physiotherapist or occupational therapist. As such, the reduction of perceptual dis-orders, or their effects, is often an initial aim of therapists. Spe-cialist rehabilitation resources, which could be used to focus on improving motor functioning, are often hampered by co-existing perceptual disorders.
Description of the intervention
functional training, sensory stimulation, strategy training and task repetition.
How the intervention might work
Functional training
Functional training involves the repetitive practice of activities of daily living, e.g. washing, dressing, and preparing meals. The emphasis is on treating the symptom rather than the cause of the problem (Edmans 2000). The rationale for the intervention is that patients will become more independent as their performance improves on the specific everyday tasks that are carried out in therapy.
Sensory stimulation
Sensory stimulation describes a mixed set of procedures that are de-signed to target visuo-perceptual processes such as colour match-ing, shape recognition, judgement of line length. The rationale for the intervention is that when individuals carry out perceptual tasks their performance will improve on other (i.e. non-trained) tasks that share similar perceptual elements. This is sometimes known as the transfer of training approach.
Strategy training
Strategy training involves learning a rule or technique that can be applied when the individual encounters activities requiring percep-tual processing. Examples include verbalisation, self-pacing and chunking. The rationale is that patients will process visual mate-rial more effectively if they have a strategy to help them overcome their acquired perceptual deficits.
Repetition
Repetition describes therapy in which the individual repeats a particular task(s) over and over until performance improves. It involves some components of the above interventions, but in straightforward repetition there is no practice of everyday activities (as in functioning training), no focus on basic sensory processing (as in sensory stimulation), and no explicit strategies are taught (as in strategy training).
Why it is important to do this review
This review was designed to evaluate the evidence for the rehabili-tation of perceptual disorders. The working definition we adopted for this review excluded the rehabilitation of sensory impairments (for example visual field defects such as homonymous hemianopia) or attentional impairments (such as visual or spatial neglect or
inattention). We also excluded the condition known as mild cog-nitive impairment (MCI) and the review focused on non-progres-sive brain injury.
O B J E C T I V E S
This review examined the effectiveness of non-pharmacological interventions aimed at the rehabilitation of perceptual disorders following stroke and other adult-acquired brain injury. It consid-ered three questions.
1. Did the intervention result in a persisting reduction in the level of disability when outcome was compared with those allocated to placebo or no intervention?
2. Was one specific targeted intervention more effective than another in terms of a persisting reduction in disability?
3. Were interventions effective for the subgroup of those with stroke?
The primary objective was to examine the evidence for an im-provement in activities of daily living up to six months post ran-domisation for active intervention versus placebo or no treatment.
M E T H O D S
Criteria for considering studies for this review
Types of studies
We included randomised controlled trials of interventions aimed at the rehabilitation of perceptual disorders following stroke and other adult-acquired brain injury. In the case of crossover trials we would have used only data from the first phase. The crossover de-sign is inappropriate for this research question because first phase effects are expected to be maintained and would contaminate sub-sequent phases.
Types of participants
Participants were adults (18 years and older) with impaired per-ception following a stroke or other adult-acquired brain injury (e.g. TBI, subarachnoid haemorrhage, meningitis, encephalitis). We considered all types of perceptual disorders for inclusion. We included visuo-constructional impairments.
Similarly we excluded apraxia (West 2008). We excluded the lay use of the term perception, such as perception of pain, numbness or weakness, from this review. We did not include children with stroke or acquired brain injury, adults with developmental brain injury, and adults with progressive dementia or malignant brain tu-mour. Children and adults with developmental pathology may not have developed the perceptual abilities expected of an unimpaired adult and the outcome measures may not be appropriate. Adults with progressive conditions may not respond to intervention in the way that those with stroke or other non-progressive conditions would be expected to. Additionally, we excluded adults who have received a diagnosis of MCI based on the diagnostic criteria de-scribed in the ICD-10 (WHO 1993) as “Objective evidence of decline in cognitive performance not attributable to other mental or behavioural disorders identified in ICD-10. May be reversible”. However, as cognitive problems post stroke are common, we in-cluded adults who were cognitively impaired at a mild level due to the effects of stroke or non-progressive brain injury.
Types of interventions
We included trials in which a comparison was made between an active treatment group that received one of the various perceptual interventions versus a control group that received either placebo or no treatment (Objectives1) or an alternative perceptual interven-tion (Objectives2). We included interventions aimed specifically at reducing the resulting perceptual impairments or the disabili-ties. We categorised the studies according to therapeutic approach (see descriptions above). These approaches included:
• functional training (practicing activities of daily living, e.g. washing, dressing, preparing meals, household tasks);
• sensory stimulation (which may include cueing or visual scanning);
• strategy training; • repetition (of a task).
As the focus of the review is on non-pharmacological interventions, we excluded trials including only drug therapies.
Types of outcome measures
Primary outcomes
We measured the primary outcome at the disability (activity) level, for example the average level of independence in activities of daily living. We used data from standardised measures, for example the Barthel Index (BI) (Mahoney 1965), the Functional Independence Measure (FIM) (Keith 1987) and the Assessment of Motor and Process Skills (AMPS) (Fisher 1994). We also used data from struc-tured observational instruments and considered subjective mea-sures of improvement. If a trial provided data on more than one of these, we extracted the BI data above those from the FIM and then the AMPS. If a trial provided outcome data at several time
points we extracted the data from the last time point within the six-month follow-up.
Secondary outcomes Secondary outcomes included:
1. independence in ADL at the scheduled end of the intervention (ordinal);
2. performance on standardised impairment level measures of perception e.g. RPAB, BORB, VOSP at end of intervention and at six months (ordinal);
3. quality of life measures at six months (ordinal); 4. effects on carer at six months (ordinal);
5. destination on discharge: institutional care setting or not (binary);
6. adverse events, such as death, fatigue, falls, accident rates (binary).
Search methods for identification of studies
Electronic searches
Seethe ’Specialized register’ section in theCochrane Stroke Group module.
We searched the trials registers of the Cochrane Stroke Group and the Cochrane Infectious Diseases Group (last searched May 2009), the Cochrane Central Register of Controlled Trials (CENTRAL) (The Cochrane Library2009, Issue 3), MEDLINE (1950 to August 2009) (Appendix 1), EMBASE (1980 to August 2009) (Appendix 2), CINAHL (1982 to August 2009), PsycINFO (1974 to Au-gust 2009) (Appendix 3), REHABDATA (http://www.naric.com/ research) and PsycBITE (Psychological Database for Brain Im-pairment Treatment Efficacy:http://www.psycbite.com/) (May to June 2009).
Searching other resources
In an effort to identify further published, ongoing and unpub-lished studies:
1. we searched the following trials and research registers in May and June 2009:
i) UK National Research Register Archive (http:// www.nrr.nhs.uk/search.htm) (records up to September 2007);
ii) UK Clinical Research Network Study Portfolio (http:/ /public.ukcrn.org.uk/search/);
iii) Current Controlled Trials Register (http:// www.controlled-trials.com);
apps1.jhsph.edu/cochrane/masterlist.asp). At the time of publishing our protocol we had planned to handsearch five journals but, when it came to carrying out the review, expansion of the Master List reduced our workload;
3. we searched reference lists of included articles; 4. we contacted authors of included articles and other researchers in the field.
We contacted the Cochrane Injuries Group to request a search of their trials register but they confirmed there was no need to search their register as all trials were sent regularly to CENTRAL. We searched for trials in all languages and planned to arrange transla-tion of trial reports published in languages other than English: we found no relevant non-English language trials.
Data collection and analysis
Selection of studies
One review author searched titles, abstracts and keywords of both published and unpublished papers to assess their eligibility for in-clusion using a systematic approach. We discarded only those pa-pers that obviously did not meet the eligibility criteria. We ob-tained and screened articles that possibly met the inclusion crite-ria. All review authors read the remaining studies and formed a consensus on the final inclusion and data extraction.
Data extraction and management
At least two review authors independently extracted data. In ad-dition to outcome data, we documented the following:
1. setting (e.g. hospital, community, nursing home); 2. type of intervention;
3. length of rehabilitation; 4. profession(s) involved; 5. co-interventions implemented; 6. length of disease;
7. level of severity;
8. presence of other symptoms that may affect the level of disability (e.g. hemiplegia, unilateral spatial neglect);
9. tools the authors used to identify perceptual disorders. We contacted the corresponding authors to request additional information that was unclear or missing from the reports. We recorded duration and frequency of intervention and also service delivery issues (for example by which professional and in what setting).
We recorded a number of design features and quality criteria in addition to risk of bias indicators below, including:
1. randomisation method (whether stratified or unclear); 2. type of design (e.g. parallel, factorial, crossover); 3. prospective power calculation (whether reported, correct and realistic);
4. definition of terms (e.g. of stroke, apraxia, outcome, and intervention);
5. outcome measures (e.g. total number and whether a primary outcome was stated);
6. intention-to-treat analysis (whether undertaken, possible from report, impossible or unclear);
7. selection of patients clearly described; 8. groups of patients comparable at baseline; 9. interventions clearly described;
10. concordance to treatment comparable in groups.
Assessment of risk of bias in included studies
At least two review authors independently performed assessment. We described the risk of bias in the included studies for the follow-ing aspects: allocation process; blindfollow-ing of outcome assessment; incomplete outcome data; selective reporting; and others.
Measures of treatment effect
We treated activities of daily living and other ordinal scales for the secondary outcomes as continuous outcomes as accepted meta-analytic techniques for ordinal outcome data are not yet available. We abstracted, calculated or requested means and standard de-viations. For all binary outcomes, we incorporated deaths in the worse outcome category and calculated Peto odds ratios. We ex-cluded deaths from outcomes that were treated as continuous. We envisaged that the death rates between the two groups would be low and similar because studies would only have included patients who were well enough to undergo rehabilitation for perceptual disorders. We discuss any imbalance in death rates between the groups, including descriptive consideration of whether analyses of raw data from individual trials could alter conclusions.
Our intention was to analyse the mean (and standard deviation) for the primary outcome. However, where activities of daily living were reported as a binary outcome this was not appropriate. Instead we abstracted and compared binary data for the primary outcome as an additional secondary analysis.
Unit of analysis issues
We did not anticipate any specific unit of analysis issues. Crossover trials would not be appropriate in this setting, and we would have only included data from the first phase of such trials.
Dealing with missing data
Assessment of heterogeneity
We noted and discussed statistical heterogeneity guided by the I2 statistic.
Assessment of reporting biases
We assessed the scope for reporting bias by absence of anticipated outcomes, less detailed reporting of non-significant outcomes, and control for multiple hypothesis testing (via either statistical adjust-ment or pre-specification of a primary outcome).
We would have examined a funnel plot for suggestion of possible publication bias if 10 or more studies had been identified reporting a single outcome.
Data synthesis
Our primary analysis pooled all therapeutic studies of active in-tervention versus placebo or no treatment to answer question 1 (seeObjectives). We stratified this analysis according to therapeu-tic approach, as outlined underTypes of interventions, to answer question 2 (seeObjectives). This included a comparison of each approach versus placebo or no treatment, as well as direct compar-isons of different approaches. To answer question 3 (seeObjectives) we repeated the analyses planned for questions 1 and 2 but re-stricted these to the subgroup of stroke patients. This subgroup was operationally defined as deriving from studies that only in-cluded stroke patients, and mixed aetiology studies where stroke patient data could be separately analysed. If the stroke data could not be separated we included the study if at least 80% of the sam-ple had stroke.
Where possible, we combined results for continuous outcomes using mean difference (MD) by a fixed-effect model. However, we anticipated that studies would use different scales to measure the same underlying constructs. Where this occurred, we used the standardised mean difference (SMD) and translated the results back into one of the original scales for reporting purposes. We combined results for binary outcomes using the Peto odds ratio, and translated to risk differences across the observed range of con-trol group rates for reporting purposes.
Subgroup analysis and investigation of heterogeneity
We prospectively planned the subgroup analysis of stroke patients to address this review’s third objective. We would consider further post-hoc subgroups defined by methodological characteristics in the exploration of heterogeneity on the primary outcome.
Sensitivity analysis
We carried out sensitivity analyses on the primary outcome. These included use of a random-effects analysis, omission of studies that did not describe an adequate method of allocation concealment, and imputing values for missing data where appropriate.
R E S U L T S
Description of studies
See: Characteristics of included studies; Characteristics of excluded studies;Characteristics of studies awaiting classification; Characteristics of ongoing studies.
Results of the search
The searches were initially run in 2008 and updated between May and August 2009. For the period 1950 (MEDLINE searches) to August 2009 we identified 25 potentially eligible studies: six stud-ies that met our inclusion criteria, 16 that we excluded and three that are awaiting assessment. Searching on the topic of ’perception’ was problematic due to the lack of clinical agreement on terminol-ogy. Our search strategies resulted in thousands of unrelated hits. The search of the Cochrane Stroke Group’s trials register identified 274 publications including all six included trials.
Included studies
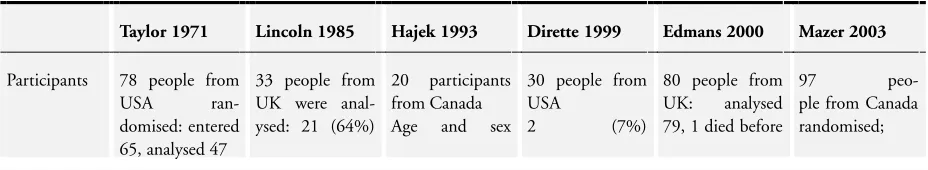
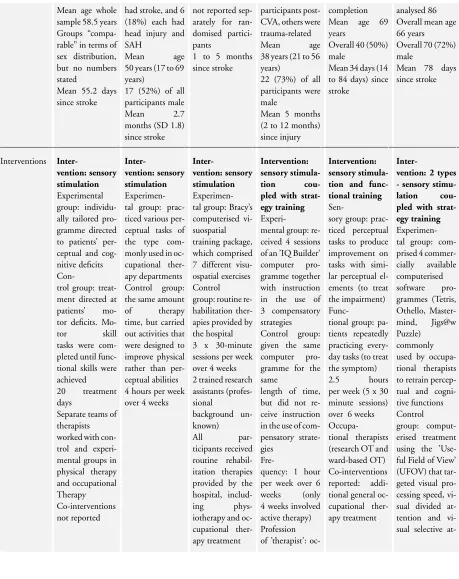
We included six studies with a total of 338 participants from three countries (Canada, UK, and USA). The number initially ran-domised per study ranged from 10 (Hajek 1993) to 97 (Mazer 2003). These six studies are described in theCharacteristics of included studiestable and in a summary table comparing them (Table 1).
Table 1. Variability in participants, interventions and outcomes
Taylor 1971 Lincoln 1985 Hajek 1993 Dirette 1999 Edmans 2000 Mazer 2003
Participants 78 people from
USA ran-79, 1 died before
97
Table 1. Variability in participants, interventions and outcomes (Continued)
Mean age whole sample 58.5 years Groups “compa-rable” in terms of sex distribution, but no numbers stated
Mean 55.2 days since stroke
had stroke, and 6 (18%) each had
tar-Table 1. Variability in participants, interventions and outcomes (Continued)
2 to 4 sessions per week (each 30 to 60 minutes)
Outcomes End of interven-tion ADL, but
16 tests of RPAB and ADL pre-: no - impairment and activity level outcomes: > 40 in battery after end of inter-vention tion Task and the Matching
eval-Table 1. Variability in participants, interventions and outcomes (Continued)
ADL: activities of daily living CVA: cerebrovascular accident
RPAB: Rivermead Perceptual Assessment Battery SAH: subarachnoid haemorrhage
SD: standard deviation
Authors of four of the studies provided helpful personal com-munication, clarifying methods and clinical issues (for detailssee Characteristics of included studiestable). We were unable to con-tact the authors of one study (Hajek 1993), and a co-author of the sixth and oldest study (Taylor 1971) confirmed that the first author had died and no unpublished data or details were available. All six were single-site trials that recruited patients from rehabil-itation settings. Stroke was the most common aetiology with the exception of one study in which it was exclusively head trauma (Dirette 1999). A second study included people with TBI or sub-arachnoid haemorrhage but the majority of their participants had a stroke (Lincoln 1985).
Time since onset varied from approximately two weeks to five months. Collectively the studies represent a wide age range, from 17 to 86 years, although the oldest person inDirette 1999was 56 years old, and an upper age limit was sometimes set e.g. 70 years (Taylor 1971). Examples of other exclusion criteria employed by the studies were: previous stroke/injury (Taylor 1971;Hajek 1993;Dirette 1999), bilateral lesions (Mazer 2003), and unable to transfer with two nurses (Edmans 2000).
The tools used to confirm the presence of a perceptual problem varied but were always a battery of neuropsychological tests, some-times including other cognitive abilities such as memory and at-tention. In two studies (Hajek 1993;Dirette 1999) the original authors did not select their participants on the basis of a perceptual impairment (e.g. “visual processing” inDirette 1999) but further details from personal communication informed our decision that inclusion in this review was warranted.
The severity and nature of the perceptual disorders was difficult to determine in most studies. In some cases (Lincoln 1985) a cut-off was pre-set e.g. > 2 SDs below norms on at least three subtests of the RPAB, which has eight subtests that further subdivide into 14 tests (four subtests forEdmans 2000).Mazer 2003described the severity within each treatment arm as: 28% mild, 51% moderate, 21% severe (experimental group), 28% mild, 54% moderate, and 18% severe (control group).
As commonly experienced in rehabilitation trials of other cognitive conditions, the interventions were rarely described with sufficient detail to allow replication or implementation into practice. This is most likely due to word limit restrictions set by journals and the clinical heterogeneity of the samples studied. Some studies published separate reports on the interventions.
Three of the four expected interventions were used in the included studies: functional training, sensory stimulation and strategy train-ing, with no studies providing repetition as a sole strategy.Seethe Characteristics of included studiestable for further details on the intervention provided in each study, but in summary all six studies provided sensory stimulation. Two studies (Dirette 1999;Mazer 2003) coupled this with strategy training but the latter was never provided in isolation. Sensory stimulation typically involved one-to-one time with an occupational therapist practising tasks that required visuo-perceptual processing. In one study (Hajek 1993) it was not known whether the research assistants providing the intervention were occupational therapists. Tasks included shape recognition games, stick length sorting and cube copying. Three studies included computerised tasks (Hajek 1993;Dirette 1999; Mazer 2003). Sessions lasted for 30 to 60 minutes, usually sev-eral days per week for a total duration ranging from four sessions (Dirette 1999) to 30 sessions (Edmans 2000). Only one study (Edmans 2000) included a functional training intervention. Control interventions included activities aimed at reducing mo-tor or physical disabilities or what was termed as ’routine reha-bilitation’ (Taylor 1971;Lincoln 1985;Hajek 1993). Two studies (Dirette 1999;Mazer 2003) provided computerised tasks such as those addressing visual attention and speed.Edmans 2000 com-pared two interventions: functional training (e.g. practising every-day tasks such as dressing) and transfer of training (categorised in this review under our definition of sensory stimulation).
We excluded 16 studies and these are individually described in the Characteristics of excluded studiestable. We excluded five studies on the basis of design: not a randomised controlled trial (Gordon 1985;Towle 1990; Flynn 2000;Connor 2002;Beschin 2005). Another 10 studies were not evaluating interventions for percep-tual problems, e.g. some recruited people with unilateral neglect or other cognitive problems. The sixteenth study (Wagenaar 1992) was neither a randomised controlled trial nor a perceptual study, but we list it here as excluded because it was included in theJutai 2003review.
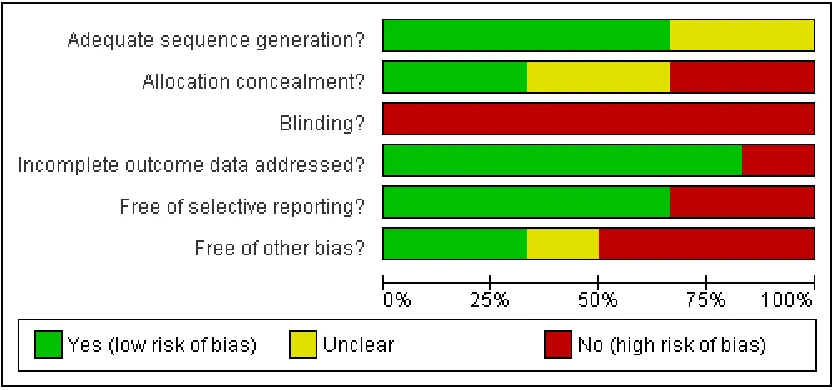
Risk of bias in included studies
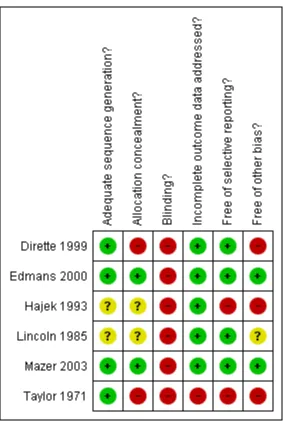
SeeFigure 1’Risk of bias graph’ andFigure 2’Risk of bias
sum-mary’.
Figure 2. Risk of Bias summary: review authors’ judgements about each methodological quality item for each included study.
Allocation
All included studies reported using random allocation. It was not possible to confirm the methods of allocation used in two of the earlier studies (Lincoln 1985; Hajek 1993). OnlyMazer 2003 clearly used adequate allocation concealment. InEdmans 2000the investigator herself prepared the sealed randomisation envelopes. Although not strictly ’adequate’ we have rated this as low risk of bias following discussion with the investigator. The earlier studies were unclear or inadequate on the issue of concealment.
Blinding
Incomplete outcome data
Losses to follow-up were unlikely to bias results in all except Taylor 1971. The remaining studies experienced very low loss to follow-up exceptMazer 2003, but losses were clearly described and unlikely to be related to intervention.
Selective reporting
Selective reporting was clearly an issue inHajek 1993, where re-sults were tabulated only for statistically significant items within the battery of assessments. However, the data from this study are not included in meta-analyses for other reasons. Similarly,Taylor 1971reported tables of F-statistics and P-values for all assessments, but only reported means for each group within the text for those differences that were statistically significant. There was no evi-dence of selective reporting in the other studies.
Other potential sources of bias
InTaylor 1971separate teams of therapists worked within each treatment group. Any differences observed could be due to the particular skill sets of the study therapists rather than to differences between the therapies themselves.
In Lincoln 1985there was a change to eligibility criteria part-way through the recruitment phase of the study. This was due to slow recruitment, but it is unclear what interim analyses were undertaken and exactly what the decision-making process was for continuation, adaptation and eventual stopping of the trial. In Hajek 1993 the first 10 patients were randomised, but the second 10 were allocated systematically. We have not been able to contact the authors to seek data for the randomised participants. Risk of bias would remain high even if raw data were available, as it is unclear what interim analyses were undertaken on the accruing data.
The study byDirette 1999was a matched pairs design, in which participants were allocated to the alternative therapy if their base-line characteristics matched a previously randomised participant. No account of this design was taken in the analysis.
Effects of interventions
See:Summary of findings for the main comparison
Perceptual intervention versus control
From a total of five studies that randomised 248 participants, only two studies with 130 participants (Lincoln 1985;Mazer 2003) provided data suitable for analysis. We were not able to obtain sep-arate data for the randomised participants inHajek 1993, and the authors confirmed the loss of original data or summary statistics by group for bothTaylor 1971andDirette 1999. The sixth study (Edmans 2000) compared two interventions rather than a control
condition and so is described instead under ’functional training versus sensory stimulation’ below.
Primary outcome
No trials reported on sustained differences in activity level up to six months following the end of intervention.
Secondary outcomes
Only outcomes at end of scheduled intervention were recorded (see Analysis 1.2). For activity levelLincoln 1985reported a difference (95% confidence interval (CI)) of 0.94 (-1.6 to 3.48) on a scale of ADL self-care following sensory stimulation, favouring percep-tual intervention.Mazer 2003reported pass rates for a driving test assessment of 16/47 (34%) following mixed strategy training and sensory stimulation versus 14/50 (28%) using control inter-vention. This translates to OR (95% CI) of 1.3 (0.56 to 3.1) in favour of perceptual intervention.Taylor 1971andDirette 1999 each reported that differences were not statistically significant. We combined impairment level data forLincoln 1985andMazer 2003to give a SMD (95% CI) of 0.07 (-0.29 to 0.43) standard deviations with no evidence of statistical heterogeneity: I2= 0% (seeAnalysis 1.4). Using the standard deviations observed in these two trials this confidence interval rules out a difference of more than 8.5 points on the shape copy task from the RPAB or two points on the Motor-free Visual Perception Test.Taylor 1971and Dirette 1999each reported that differences were not statistically significant.
None of the remaining secondary outcomes was reported by any trial.
Functional training versus sensory stimulation This comparison was assessed by a single trial that randomised 80 participants (Edmans 2000). Original (raw) data were provided by the author who also confirmed that all participants were eligible for inclusion in this review. The analyses we present here are not available from the report.
Primary outcome
There was no data collection regarding differences in activity level up to six months following the end of intervention.
Secondary outcomes
For impairment level outcome, mean improvement in the RPAB at scheduled end of intervention was 22.0 in the functional training group and 21.6 in the sensory stimulation group. This gave a mean difference (95% CI) of 0.4 (-11.8 to 12.6) points favouring functional training (seeAnalysis 2.4). This translates to a SMD (95% CI) of 0.02 (-0.42 to 0.45) standard deviations.
None of our remaining secondary outcomes were reported by this trial.
Effectiveness for the subgroup with stroke
Five studies recruited people with stroke and three of them (Lincoln 1985;Edmans 2000;Mazer 2003) provided data suitable for this review. One of these (Lincoln 1985) also included peo-ple with TBI or subarachnoid haemorrhage although the majority (64%) of participants had stroke. The above results are therefore predominately based on data from the clinical population of peo-ple with stroke and will not be repeated here.
D I S C U S S I O N
Summary of main results
There is currently insufficient evidence to support or refute the view that interventions for perceptual problems are effective. Only six studies were eligible for inclusion, three of which provided data suitable for analysis. In these three, sample sizes were small (ranging from 33 to 89 participants) and smaller studies provide less precise estimates of effect. We are aware of three further studies (seeCharacteristics of studies awaiting classification) but these have even smaller sample sizes.
As shown in theSummary of findings for the main comparison, there were no available data with which to answer the primary research question, nor several of the secondary questions. Where data were available, the difference in the effects of the interventions overlaps the null value, therefore the results of the analysis are compatible with both benefit and harm.
It is important to consider the nature of the comparator when ex-amining the results of any study. In our review, one study (Edmans 2000) usefully compared two potentially active interventions to see if one was better than the other.Dirette 1999andMazer 2003 explored the benefits of coupling sensory stimulation with strategy training. Both studies provided the control group with comput-erised sensory stimulation without the strategy training. Interpre-tation of evidence from these three studies needs to bear in mind that they do not provide evidence on whether perceptual interven-tion is better than no treatment or usual care or placebo.Hajek 1993included a ’routine rehabilitation’ control group to inves-tigate any added benefit of the sensory stimulation intervention.
However, such ’usual care’ requires careful definition and measure-ment as it varies between services and from country to country. Taylor 1971andLincoln 1985included a control condition where tasks focused on motor or physical skills. This model is designed to isolate any specific effect of working on perceptual skills over and above any general ’dose’ effect and is becoming more popular as seen in the emergent use of ’attention control’ in rehabilitation research.
There are many remaining uncertainties. In fact, on completion of this review the only certainty is that the question of effectiveness has not yet been answered by existing research. It remains uncer-tain whether any intervention is more effective than no interven-tion, or one intervention is better than any other, or whether com-bining interventions is beneficial. Similarly, we have no evidence from the studies to guide us on the amount or duration of inter-vention, nor information about service delivery and organisational issues. These issues include when and where intervention should be provided (e.g. early in-patient versus post-acute community rehabilitation), and whether it should be delivered by a qualified occupational therapist or psychologist, or an assistant working un-der their supervision. Only adequately sized trials, using relevant outcome measures, could provide answers to these clinically im-portant questions.
Overall completeness and applicability of evidence
This review aimed to synthesise evidence relevant to adults with stroke and other non-progressive brain injuries. The included stud-ies covered a good age range from 17 to 86 years. It was encour-aging to note that, with one exception (Taylor 1971), studies did not impose artificial cut-offs, such as retirement age.
Most of the participants in the included trials had a stroke. A small proportion had TBI or subarachnoid haemorrhage. However, we argue that this does not restrict the review’s relevance. In designing the review’s protocol we argued that interventions for perceptual impairments would be similar for people with stroke and non-progressive injuries. This remains our view.
consider publishing separate papers on demographic and clinical characteristics to inform the external validity of the trial. The crucial limitation in fully meeting this review’s objectives is the absence in the included studies of longer-term functional out-come measures, which we defined as measurements taken up to six months post-randomisation. Although data were reported on functional outcome at the scheduled end of intervention, a key aim of rehabilitation research is to evaluate maintenance of ben-efits. Similarly the identified trials did not conduct longer-term follow-up on the impairment level measures used. A lack of data on quality of life, destination on discharge, and effects on carers limit the scope of the evidence resulting from this review. In terms of fit to current practice, the included studies were con-ducted in Canada, UK, and USA. We cannot say with certainty that interventions represented standard occupational therapy prac-tice in those countries, but an interesting observation is that all six studies included an intervention approach categorised as sen-sory stimulation. All participants were assisted by a therapy worker and this was confirmed as an occupational therapist in all but one study (Hajek 1993). Although different materials were used, in-cluding three which involved computerised tasks (Hajek 1993; Dirette 1999;Mazer 2003) all studies used a common approach of practising activities that draw on visual perceptual abilities. Ses-sions lasted for 30 to 60 minutes, usually several days per week for several weeks (from four to 30 sessions). Less typical of clinical practice (certainly in the UK) was the absence of functional task training: it was used in only one (UK-based) study in the review.
Quality of the evidence
The evidence summarised in this review comes from six small stud-ies conducted in three countrstud-ies spanning more than 30 years. The total number of participants was 338 although we could extract outcome data from only three studies, the largest of which ran-domised 97 people (all with stroke). A robust conclusion cannot be drawn about the effectiveness of non-pharmacological inter-ventions for people with perceptual disorders following stroke and other adult, acquired, non-progressive brain injury. Key method-ological limitations of the included studies and recommendations for future trials are detailed below (seeImplications for research).
Potential biases in the review process
In our opinion this review identified all relevant studies. We suc-cessfully contacted several of the original authors, who provided clarification and data that were not available in the published re-ports.
Agreements and disagreements with other studies or reviews
Jutai 2003conducted a “critical review and synthesis” of published research evidence of visual perceptual disorders following stroke (based on searching five electronic databases from 1995 to June 2002 and MEDLINE from 1970 to 1994). Their definition of perception was broader than our own, including both spatial ne-glect and apraxia. Although only brief details of the search terms used are provided the reviewers did assess the methodological qual-ity of each published study that they included (using PEDro) and two reviewers independently assessed each article. They included eight studies (classifying six as RCTs) concluding there was “strong evidence” that specific treatment of perceptual disorders improves perceptual functioning based on summarising the original stud-ies’ findings as three positive, one negative and one mixed. They also concluded that one study which included head injury patients (Lincoln 1985) did not show a significant difference for perceptual training and that there was “moderate evidence” that one approach was no more effective than another, based on theEdmans 2000 study.
Our systematic review differed in methods and conclusions. We searched for unpublished as well as published studies. We included adult, acquired, non-progressive brain injury such as TBI and sub-arachnoid haemorrhage in addition to stroke. We excluded ne-glect and apraxia, which were separately systematically reviewed (Bowen 2007;West 2008). We considered and excluded six of the eight studies included byJutai 2003either because the participants had neglect or because the study was not a randomised controlled trial (Weinberg 1977;Weinberg 1979; Weinberg 1982; Carter 1983,Gordon 1985,Wagenaar 1992). Our review andJutai 2003 included only two studies in common (Lincoln 1985;Edmans 2000). We share Jutai’s conclusion that no one intervention ap-proach has proven efficacy over any other. We disagree with their conclusion that there is evidence for the effectiveness of specific treatments for perceptual disorders.
Cicerone 2005conducted an updated systematic review (as far as 2002) of the effectiveness of cognitive rehabilitation for people with TBI or stroke. In addition to examining the evidence for com-prehensive holistic cognitive rehabilitation the authors searched for studies categorised under six other categories, one of which was visual perception as distinct from the category of apraxia but in-cluding visual neglect. All of the studies identified were for neglect rehabilitation or interventions for visual field loss. They concluded that the rehabilitation of “more complex visuospatial abilities re-quired for functional activities (e.g. meal preparation, driving)” requires randomised controlled trials.
repe-tition exclusively as a rehabilitation intervention. The intervention labelled in our review as ’sensory stimulation’ involved one-to-one time with an occupational therapist practising tasks that required visuo-perceptual processing such as shape recognition games or computerised tasks, whereasDoyle 2010reviewed interventions for sensory impairment of the upper limb. As expected, we found that occupational therapists were the professionals most likely to deliver the interventions for perceptual problems. The reader may be interested in two other reviews of occupational therapy,Legg 2006for patients with problems in activities of daily living after stroke, andHoffmann 2010for occupational therapy for cognitive impairment in stroke patients.
A U T H O R S ’ C O N C L U S I O N S
Implications for practice
There is insufficient evidence to support or refute the view that any specific intervention is effective at reducing the impact of im-paired perceptual functioning, and so more conclusive evidence is required before decisions are made on the provision of these services. Absence of evidence is not evidence of absence. The four main intervention approaches may be categorised as: functional training, sensory stimulation, strategy training and task repetition. Although research interest has focused on sensory stimulation to the exclusion of repetition, at present the possible merits of any one treatment approach over any other are unknown. Anecdotal evidence suggests that all four approaches are currently used in clinical practice, often in combination with each other. As we did not review whether individuals with perceptual problems bene-fit from general rehabilitation (e.g. physiotherapy, occupational therapy, nursing, etc), they should continue to receive standard neurorehabilitation services in accordance with available clinical guidelines.
Implications for research
Future studies should:
1. provide a sufficiently detailed theoretical rationale for, and description of, the interventions including type and amount to allow implementation into clinical practice and research replication;
2. provide a standard care control group, carefully
documenting the content and amount of standard care, which can be highly variable;
3. include detailed diagnostic information on individuals’ perceptual problems given the heterogeneity in perceptual problems in terms of type, severity and likely impact on everyday function;
4. ensure low risk of study bias through rigorous methodological development and reporting, e.g. ensure allocation concealment, attempt to blind outcome assessors and report the success or failure, report all loss to follow-up, report results from all outcome measures, control for other possible sources of bias;
5. be of sufficient size to have adequate statistical power to answer clinically important questions about long-term functional outcomes;
6. specify a primary endpoint and include analysis of other key outcomes such as adverse events, psychosocial benefits and other outcomes deemed important by service users;
7. adopt an intention-to-treat approach to measurement of outcomes in all individuals as well as to analysis of measured outcomes by treatment group;
8. include a health economic assessment.
A C K N O W L E D G E M E N T S
R E F E R E N C E S
References to studies included in this review
Dirette 1999 {published and unpublished data} Dirette DK, Hinojosa J, Carnevale GJ. Comparison of remedial and compensatory interventions for adults with acquired brain injuries. Journal of Head Trauma Rehabilitation1999;14(6):595–601.
Edmans 2000 {published and unpublished data} Edmans JA, Webster J, Lincoln N. A comparison of two approaches in the treatment of perceptual problems after stroke.Clinical Rehabilitation2000;14:230–43.
Hajek 1993 {published data only (unpublished sought but not used)} Hajek VE, Kates MH, Donnelly R, McGree S. The effect of visuo-spatial training in patients with right hemisphere stroke. Canadian Journal of Rehabilitation1993;6(3): 175–86.
Lincoln 1985 {published and unpublished data} Lincoln NB, Whiting SE, Cockburn J, Bhavnani G. An evaluation of perceptual retraining. International Rehabilitation Medicine1985;7:99–101.
Mazer 2003 {published and unpublished data}
Mazer B, Sofer S, Korner-Bitensky N, Gelinas I, Hanley J, Wood-Dauphinee S. Effectiveness of a visual attention retraining program on the driving performance of clients with stroke.Archives of Physical Medicine and Rehabilitation 2003;84:541–50.
Taylor 1971 {published data only (unpublished sought but not used)} Taylor MM, Schaeffer JN, Blumenthal FS, Grisell JL.
Perceptual training in patients with left hemiplegia.Archives of Physical Medicine Rehabilitation1971;52:163–9.
References to studies excluded from this review
Beschin 2005 {published data only}
Beschin N, Cocchini G, Della Sala S. Effect of optokinetic stimulation, prism adaptation and tens on anosognosia for motor deficits. In: Proceedings of the The Stroke Association 10th Scientific Conference. 2005. Carter 1983 {published data only}
Carter LT, Howard BE, O’Neil WA. Effectiveness of cognitive skill remediation in acute stroke patients. American Journal of Occupational Therapy1983;37:320–6.
Connor 2002 {published data only}
Connor BB, Wing AM, Humphreys GW, Bracewell RM, Harvey DA. Errorless learning using haptic guidance: research in cognitive rehabilitation following stroke. Proceedings of the 4th International Conference on Disability, Virtual Reality and Associated Technologies. 2002:77–83.
Flynn 2000 {published data only}
Flynn A. Investigation into whether psychology led cognitive rehabilitation of attentional and visio-spatial skills improves performance in these areas beyond spontaneous recovery. National Research Register 2001, issue 1:https:
//portal.nihr.ac.uk/Profiles/NRR.aspx?Publication˙ID= N0280012930 (accessed 21 January 2011).
Gordon 1985 {published data only}
Gordon WA, Hibbard MR, Egelko S, Diller L, Shaver MS, Lieberman A, et al.Perceptual remediation in patients with right brain damage: a comprehensive program. Archives of Physical Medicine and Rehabilitation1985;66:353–9. Lincoln 1997 {published data only}
Lincoln N, Drummond A, Berman P. Perceptual impairment and its impact on rehabilitation outcome. Disability and Rehabilitation1997;19(6):231–4. Morioka 2008 {published data only}
Morioka S, Fujita H, Kataoka Y. Effects of hardness discrimination training on sitting postural balance in hemiplegic patients following stroke.International Journal of Stroke2008;3 Suppl 1:350.
Perez 1997 {published data only}
Perez L, Wittink M, Kalra L. Visuospatial dysfunction and stroke rehabilitation.Cerebrovascular Diseases1997;7 Suppl 4:83.
Rossi 1990 {published data only}
Rossi PW, Kheyfets S, Reading MJ. Fresnel prisms improve visual perception in stroke patients with homonymous hemianopia or unilateral visual neglect . Neurology1990; 40:1597–9.
Shapovalenko 2008 {published data only}
Shapovalenko T, Baidova T, Isaeva T. Influence on proprioception and cognitive disorders in the early period of acute disturbances of cerebral blood flow. International Journal of Stroke.2008;3 Suppl 1:348.
Shi 1994 {published data only}
Shi J, Wang SY, Huan SS, Huan QM, Wang CL. Activity of daily living (ADL) of patients with stroke after rehabilitation training.Chinese Journal of Physical Therapy1994;17(3): 160–1.
Towle 1990 {published data only}
Towle D, Edmans J, Lincoln N. An evaluation of a group treatment programme for stroke patients with perceptual deficits. International Journal of Rehabilitation Research 1990;13:328–35.
Wagenaar 1992 {published data only}
Wagenaar RC, van Wieringen PC, Netelenbos JC, Meijer OG, Kuik DJ. The transfer of scanning training effects in visual inattention after stroke: five single case studies. Disability and Rehabilitation1992;14:51–60.
Weinberg 1977 {published data only}
Weinberg J, Diller L, Gordon WA, Gerstman LJ, Lieberman A, Lakin P, et al.Visual scanning training effect on reading related tasks in acquired right brain damage. Archives of Physical Medicine and Rehabilitation1977;58:479–86. Weinberg 1979 {published data only}
organisation in people with right brain damage.Archives of Physical Medicine and Rehabilitation1979;60:491–6.
Weinberg 1982 {published data only}
Weinberg J, Piasetsky E, Diller L, Gordon W. Treating perceptual organization deficits in non-neglecting RBD stroke patients.Journal of Clinical Neuropsychology1982;4 (1):59–75.
References to studies awaiting assessment
Kang 2009 {published data only (unpublished sought but not used)} Kang SH, Kim D-K, Seo KM, Choi KM, Yoo JY, Sung SY, et al.A computerised visual perception rehabilitation programme with interactive computer interface using motion tracking technology - a randomised controlled, single blinded, pilot clinical trial study. Clinical Rehabilitation2009;23:434–44.
Leer 1984 {published data only}
Leer WB. . . Block Design Training with Stroke Patients: A Study on the Effects of Cognitive Retraining on Improving Certain Activities of Daily Living Skills. Michigan, USA: Michigan State University, 1984.
Matz 2007 {published data only (unpublished sought but not used)} Matz K, Teuschl Y, Eckhardt R, Herbst A, Dachenhausen A, Brainin M. Cognitive training in patients with first lacunar stroke - a randomized pilot trial for the prevention of post-stroke cognitive decline.Cerebrovascular Diseases2007;23 Suppl 2:42.
References to ongoing studies
Mazer 2009 {unpublished data only}
Ongoing study Starting date of trial not provided. Contact author for more information.
Additional references
Beaumont 1992
Beaumont J, Davidoff J. In: Crawford JR, Parker DM, McKinlay WW editor(s).A handbook of neuropsychological assessment. Hove: Lawrence Earlbaum Associates, 1992. Bowen 2007
Bowen A, Lincoln NB. Cognitive rehabilitation for spatial neglect following stroke. Cochrane Database of Systematic Reviews2007, Issue 2. [DOI: 10.1002/ 14651858.CD003586.pub2]
Cicerone 2005
Cicerone KD, Dahlberg C, Malec JF, Langenbahn DM, Felicetti T, Kneipp S, et al.Evidence-based cognitive rehabilitation:updated review of the literature from 1998-2002.Archives of Physical Medicine and Rehabilitation2005; 86:1681–92.
Dept of Health 2000
Hospital Episode Statistics. Department of Health, UK 2000–2001.
Donnan 2008
Donnan GA, Fisher M, Macleod M, Davis SM. Stroke. Lancet2008;371:1612–23.
Doyle 2010
Doyle S, Bennett S, Fasoli SE, McKenna KT. Interventions for sensory impairment in the upper limb after stroke. Cochrane Database of Systematic Reviews2010, Issue 6. [Art. No.: CD006331. DOI: 10.1002/ 14651858.CD006331.pub2]
Edmans 1991
Edmans JA, Lincoln N. The recovery of perceptual problems after stroke and the impact on daily life.Clinical Rehabilitation1991;5:301–9.
Fisher 1994
Fisher AG. Development of a functional assessment that adjusts ability measures for task simplicity and rater leniency. In: Wilson M editor(s). Objective Measurement: Theory into Practice. Norwood: Ablex, 1994.
French 2007
French B, Thomas LH, Leathley MJ, Sutton CJ, McAdam J, Forster A, et al.Repetitive task training for improving functional ability after stroke. Cochrane Database of Systematic Reviews2007, Issue 4. [Art. No.: CD006073. DOI: 10.1002/14651858.CD006073.pub2]
Hoffmann 2010
Hoffmann T, Bennett S, Koh CL, McKenna KT. Occupational therapy for cognitive impairment in stroke patients. Cochrane Database of Systematic Reviews 2010, Issue 9. [Art. No.: CD006430. DOI: 10.1002/ 14651858.CD006430.pub2]
Jutai 2003
Jutai JW, Bhogal SK, Foley NC, Teasell RW, Speechley MR. Treatment of visual perceptual disorders post stroke. Topics in Stroke Rehabilitation2003;10(2):77–107.
Keith 1987
Keith RA, Granger CV, Hamilton BB, Sherwin FS. The functional independence measure: a new tool for rehabilitation. In: Eisenberg NG, Grzesiak RC editor(s). Advances in Clinical Rehabilitation. New York: Springer, 1987.
Kersel 2001
Kersel D, Marsh N, Havill D, Sleigh J. Neuropsychological functioning during the year following severe traumatic brain injury.Brain Injury2001;15(4):283–96.
Legg 2006
Legg L, Drummond A, Langhorne P. Occupational therapy for patients with problems in activities of daily living after stroke.Cochrane Database of Systematic Reviews2006, Issue 4. [DOI: 10.1002/14651858.CD003585.pub2]
Lezak 1995
Lezak MD.Neuropsychological Assessment. 3rd Edition. New York: Oxford University Press, 1995.
Lezak 2004
Mackay 2004
Mackay J, Mensah G, editors.The Atlas of Heart Disease and Stroke. Geneva: World Health Organization, 2004.
Mahoney 1965
Mahoney FI, Barthel DW. Functional evaluation: the Barthel Index. Maryland State Medical Journal1965;14: 61–5.
McKenna 2006
McKenna K, Cooke D, Fleming J, Jefferson A, Ogden S. The incidence of visual perceptual impairments in patients with severe traumatic brain injury.Brain Injury2006;20(5): 507–18.
Murray 1997
Murray CJ, Lopez AD. Mortality by cause for eight regions of the world: Global Burden of Disease Study.Lancet1997; 349:1269–76.
Perel 2006
Perel P, Edwards P, Wentz R, Roberts I. Systematic review of prognostic models in traumatic brain injury.BMC Medical Informatics and Decision Making2006;6:38.
RevMan 2008
The Nordic Cochrane Centre, The Cochrane Collaboration. Review Manager (RevMan). 5.0. Copenhagen: The Nordic Cochrane Centre, The Cochrane Collaboration, 2008. Riddoch 1993
Riddoch J, Humphreys G.Birmingham Object Recognition Battery. Psychology Press, 1993.
van Ravensberg 1984
van Ravensberg C, Tyldesley D, Rozendal R, Whiting H. Visual perception in hemiplegic patients. Archives of Physical Medicine and Rehabilitation1984;65:304–9. Warrington 1991
Warrington EK, James M.Visual Object and Space Perception Battery. Bury St Edmunds: Thames Valley Test Company, 1991.
West 2008
West C, Bowen A, Hesketh A, Vail A. Interventions for motor apraxia following stroke. Cochrane Database of Systematic Reviews2008, Issue 1. [DOI: 10.1002/ 14651858. CD001432.pub2]
Whiting 1985
Whiting S, Lincoln NB, Cockburn J, Bhavnani G.The Rivermead Perceptual Assessment Battery. Windsor: NFER-Nelson, 1985.
WHO 1993
World Health Organization. The ICD-10 classification of mental and behavioural disorders: diagnostic criteria for research. Geneva: World Health Organization, 1993. WHO 2008
The World Health Report 2008 - Primary Health Care (Now More Than Ever). World Health Organization 2008: http://www.who.int/whr/2008/whr08˙en.pdf (accessed 21 January 2011).
C H A R A C T E R I S T I C S O F S T U D I E S
Characteristics of included studies [ordered by year of study]
Taylor 1971
Methods Setting: Detroit Rehabilitation Institute Sites: 1
Countries: USA Trial design: parallel
Recruitment dates: not specified
Participants Numbers: 78 randomised, 65 entered programme, 47 analysed
Definition of stroke: this is probably only clinical, given the age of the study, though this is not explicitly stated. It does state a clear history of stroke involving the right cerebral hemisphere
Time since stroke: eligible if 14 to 180 days at admission, “average” 55.2 days Time since start of rehabilitation: not specified
Comorbidities affecting disability reported: no
Excluded: yes - excluded if unable to co-operate, vision too poor to read, inadequate cardiovascular reserve, amputee, history of psychiatric care, previous stroke, neurologic disorder
Tools used to define perceptual disorders: PCMF test battery Severity of perceptual disorders: not specified
Included visuospatial neglect: yes; frequency/severity not stated
Age: average for whole sample 58.5 years (eligibility limits: 40 to 70 years) Sex: Groups “comparable” (but numbers not stated)
Race/ethnicity: not specified
Interventions Described adequately to replicate: no, but treatment procedures were outlined in a manual (apparently unpublished) and a final report (also apparently unpublished) Broad class: sensory stimulation
Specific nature: the intervention group received an individually tailored programme directed to patients’ perceptual and cognitive deficits. This included gait training, visual tracking, object identification, and assembly tasks. When motor function was primarily involved, patients’ attention was drawn to their sensory deficits
The control group received treatment directed at patients’ motor deficits according to “orders written by the attending physician”. Motor skill tasks were completed until functional skills were achieved
Frequency: 20 treatment days (where less than 3 consecutive treatment days could be lost to acute illness, and less than 10 scheduled hours lost for any reason)
Duration (from first to last treatment): 20 treatment days (presumably consecutive) Profession of ’therapist’: separate teams of therapists worked with control and experi-mental groups in physical therapy and occupational therapy
Co-interventions reported: not stated
Outcomes Reported:
• 6-month ADL: no
• End of intervention ADL: yes, but not in analysable format
Taylor 1971 (Continued)
• End of intervention perception impairment: yes, but not in analysable format • 6-month QoL: no
• 6-month effect on carer: no • Discharge destination: no
Adverse events:
• Death: no • Fatigue: no • Falls: no • Accidents: no • Others: no
Notes No additional information available from authors, confirmed by contact with co-author Dr Blumenthal who also confirmed that the first author has since died
Risk of bias
Item Authors’ judgement Description
Adequate sequence generation? Yes Not fully described, but referenced
devel-opment of “a random system” developed by Richard Remington PhD, a pioneer of randomised trials in the USA
Allocation concealment? No Even if sequence concealed, randomisation
occurred before pre-treatment evaluation, which 13/78 (17%) eligible patients failed to complete. Allocation is likely to have been clear before final assessment of eligi-bility
Blinding? All outcomes
No No reference to blinding
Incomplete outcome data addressed? All outcomes
No Loss to follow-up at least 28% (18/65),
ar-guably 40% (31/78)
Free of selective reporting? No Tables of F-ratio and whether P < 0.01
for all outcomes. Only reported mean val-ues (in text) for statistically significant out-comes
Free of other bias? No “Separate teams of therapists worked with