Effects of Faster Airflows on Human Thermal Comfort in Summer
Listiani Nurul Huda*1,3, Hiroshi Homma2 and Hiroshi Matsumoto2
1 Research Associate, Department of Architecture and Civil Engineering, Toyohashi University of Technology, Toyohashi, Japan
2 Professor, Department of Architecture and Civil Engineering, Toyohashi University of Technology, Toyohashi, Japan
3 Lecturer, Department of Industrial Engineering, University of Sumatera Utara, Medan, Indonesia
Abstract
A same comfort condition for the majority of people in temperate and tropical areas can be obtained with air-conditioning using a faster air velocity and a higher air temperature. This leads to more economical energy consumption. Thus, a location on a body was identified where comfort was attained efficiently by local airflow. The present study examined if any difference existed in subjects perception of the airflow between the back of the necks and ankles when local airflows of varying temperatures and velocities were directed at the two locations. The subjective responses in the summer experiments were discussed. The results indicate that the airflows caused stronger thermal sensation and airflow perception at the necks more so than at the ankles. The higher temperature airflow was evaluated to be more comfortable than the lower temperature airflow at both locations. The percentages dissatisfied (PDs) were smaller at the necks than the ankles.
Keywords: neck and ankle; local airflow; perception & sensation; thermal comfort; dissatisfied
1. Introduction
Faster airflow than what is commonly used indoors appears to be more comfortable for the majority of people who have sedentary behavior in tropical and temperate areas. The faster air movement seems to be able to generate comfortable conditions in an air-conditioned space in such indoor areas. This suggests that there is a possibility that the same comfort level or physical performance can be attained with a combination of a higher temperature and a faster airflow economically.
The experiments, which were conducted in hot areas such as Thailand by Khedari et al. (2000) and Australia by Cena et al. (1999), reported that a condition of comfort was held with airflow with a velocity as fast as 1m/s in air-conditioned spaces, and the temperatures varied from 26°C and countries exceeding 35°C in summer conditions. Even in experiments within the United States and European countries, comfort was reported to be obtained even when air velocity exceeded 0.8 m/s by Arens (1998) and McIntyre (1978). Even in an experiment conducted in winter in Denmark by Fanger et al. (1974), it was reported that comfort was maintained when the subjects were exposed to a velocity of 0.8 m/s, when the temperature was 27.7°C. From these experiments it seems that airflow
with a faster velocity than the present standards may be acceptable for people in hot or temperate areas alike.
There are various research results on the total body sensation, but there are only a few studies that mention the difference in perception of local airflow on body locations. Houghten et al. (1938), Fanger and Christensen (1986) suggested that the back of the neck was less tolerable to cold drafts compared to the ankles. Tanabe et al. (1972) investigated thermal comfort on Japanese subjects during the summer. It was found that the neutral comfort temperature of Japanese was 26.3°C. This is not significantly different from studies with Danish and American subjects. Toftum, Zhou, and Melikov (1997), showed that at a temperature of 26°C airflow from above and towards the back caused most dissatisfaction due to draught, but generally only a few of the subjects perceived discomfort at this temperature. Xia, Niu, Zhao and Burnet (2000) investigated the effect of turbulent airflow on thermal sensations in a warm isothermal environment. The experiments were performed at air temperatures of 26, 27.5, 29, 30.5°C, two turbulent levels of 25% and 40%, and two relative humidity indexes of 35% and 65%. During the experiments the air velocity was controlled at the subjects' preference. The airflow was directed from the chest to the knees of sitting subjects. The results have shown that most subjects could attain comfort after adjusting the air velocity, as they liked. The preferred velocity was in a range between about 0.3 to 1.2 m/sec. Although at the higher temperature, the velocity, which was chosen by the subjects, might be lower than the velocity that was needed by the subjects to attain their thermal neutrality. A new model of Percentage Dissatisfied at Preferred
*Contact Author: Listiani Nurul Huda, Research Associate, Department of Architecture and Civil Engineering,
Toyohashi University of Technology, Toyohashi, 441-8580 Japan
Tel: +81-532-44-1175; Fax: +81-532-44-6831 e-mail: [email protected]
Velocity (PDV) was presented to predict the percentage of feeling of draft in warm isothermal conditions in this paper. Homma (2002), studied the physical side of thermal comfort of local draft. The effect of the draft was compared at the back of the neck and the ankle of a thermal manikin. The results indicated that the local airflows affected the ankles more strongly than the neck.
Thus, in the present study a higher velocity was directed to the back of the necks and the ankles, and we examined which part of the body's surface was more sensitive, so as to concentrate the airflow of air-conditioning to this location.
In the targeted technology, air of a higher temperature is supplied with a higher velocity than in the conventional technology to raise the thermal performance of air conditioners. This should contribute toward cooling energy saving. The results from the summers of 2001, 2002, and 2003 are reported here.
2. Experimental Procedure
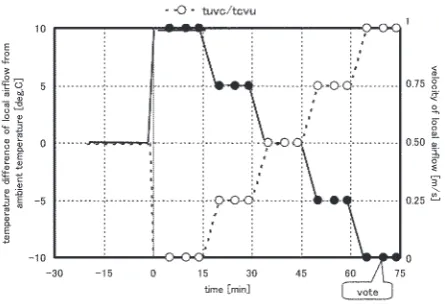
Horizontal local airflows were directed to the back of the neck, and the left side of the ankle of a human subject. Four different conditions including temperature and air velocity were investigated. In the two conditions of temperature, the temperature of local airflow was changed by increments of 5°C while the air velocity was kept at 0.5 m/s. In one test, the temperature was changed from lower to higher. The tested temperature differences were –10, -5, 0, +5, and +10°C from the laboratory temperature, and were labeled as tuvc. When the temperature change was reserved, it was labeled as tdvc. In the velocity change experiments, velocities of the local airflow were changed from null to 1 m/s or vise versa by velocity increments of 0.25 m/s while its temperature was the same as the ambient temperature. In the rising velocity experiment, which was labeled tcvu, the local airflow velocity started from null, and ended at 1 m/s. In the falling velocity experiment, the velocity change was opposite and was labeled tcvd. The schedule of the experiments is shown in Fig.1.
The laboratory was thermally well isolated from outdoor temperature change. The temperature was controlled between 26°C and 28°C. The temperature change in an experiment of 95 minutes was less than experiment. Two draft producers were constructed using thermo-modules, which pumped heat from or to, and cooled or warmed the air, which was blown. The temperature of the local airflow was controlled by the electric current to the modules switching the direction of the electric current changed direction of
the heat flow. The change in temperature of the airflow was completed in five minutes by supplying more power than was required to maintain the temperature. The applied airflow had low turbulent intensity. The standard deviation of the airflow was 0.02 m/s when the velocity at the nozzle face was 0.25 m/s. It increased to 0.08 m/s when the velocity at the nozzle face was 1.00 m/s.
their tympanic temperature. The subjects measured their weight at the beginning and the end of the experiment with a balance with a resolution of one gram.
The local airflow was blown from a nozzle of a diameter of 50 mm. The distance between the nozzle and the objective location was adjusted to 0.4 m. These two locations of the local airflow application were chosen because the natural convection by the body heat starts at the ankle level and develops fully at the neck level. The base position of the neck measurement was chosen to the indent point on the back of the neck, while the ankle position was chosen at where the ankle protrudes.
The details of the experimental arrangements of this study were reported in an earlier paper (L.Nurul H, 2004).
3. Results
The means and standard deviations of the subject's votes regarding thermal sensation, airflow perception, and thermal comfort in summer are shown in Table 2. The responses showed that the uppermost and the lowermost semantics were rarely entered for both of the locations. The comparison between tuvc, tdvc, tcvu, and tcvd for the three votes at the neck and the ankles were all significantly different with a covariance coefficient (F) larger than 6 (see Table 3.).
The ages, heights, and weights of the subjects had no significant influence on the responses to the three questions. The pulse rate and body temperature of each subject changed irregularly, but no tendency was found. From these, all types of the experiment appeared to be conducted under almost the same thermal stress condition.
3.1 Thermal Sensation and Airflow Perception
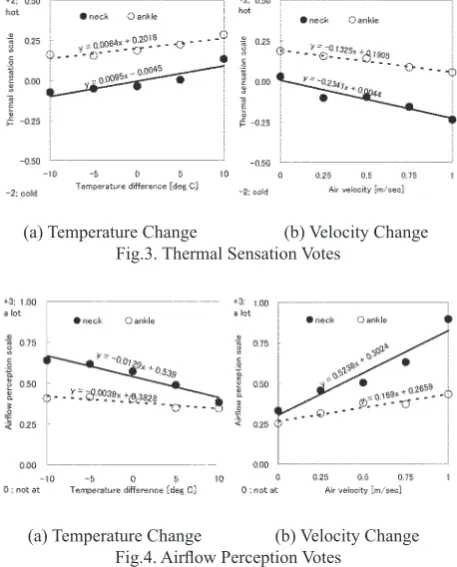
The relation between the thermal sensation and the temperature differences are shown in Fig.3. (a). All of the lines for thermal sensation at the neck and ankles increased with temperature. The ankles felt warmer than the neck. Fig.3. (b) shows that all of the lines decreased with velocity. Throughout the velocity change, the thermal sensation was slightly cool at the necks but slightly warm at the ankles. The gradients of their regression lines were gentle.
The changes in the airflow perception are shown in Fig.4. (a) and (b). In the temperature-change experiments, the regression lines were larger at the necks than at the ankles, as shown in Fig.4. (a).
The neck has a slightly stronger sense regarding airflow on airflows (a mean of 0.54) compared to the ankles (a mean of 0.46). The ankles' sense on airflow change remained almost unchanged throughout the experiment periods. Fig.4. (b) shows the change of airflow sensitivity in the velocity change experiments. The regression lines of the necks were steeper than those of the ankles. The necks responded to the velocity change more strongly than the ankles. The necks seemed to have a better sensor of the local airflows.
3.2 Thermal Comfort
The changes in the thermal comfort votes for the temperature-change experiments are shown in Fig.5. (a). The gradients of the regression lines were positive at the necks and it was negative at the ankles. The necks evaluated the local airflows as being slightly comfortable, but slightly uncomfortable at the ankles.
Fig.2. Scales of Thermal Sensation, Airflow Perception, and Thermal Comfort Votes
Table 2. Mean and Standard Deviation of Three Questionnaire Votes in Summer
Table 3. The ANOVA Results between tuvc-tdvc-tcvu-tcvd in Summer
(a) Temperature Change (b) Velocity Change Fig.3. Thermal Sensation Votes
The changes in the thermal comfort votes for the velocity-change experiments are shown in Fig.5. (b). The gradients of all the regression lines were positive. Generally, the values for the ankles were less than those for the neck.
3.3 Percentage of Dissatisfied
The percentages of dissatisfied (PD) were calculated from the thermal comfort votes. When an average response was below -0.5 over the full scale of -2 to 2, the response was assumed to be dissatisfaction. Most of the PDs of the necks were lower than those of the ankles in both experiment changes. In the temperature-change experiments, as shown in Fig.6. (a), all the PDs tended to decrease slightly with the temperature increases. Fig.6. (b) shows that the PDs at the neck tended to increase as the velocity increased, while it decreased at the ankles. The neck appeared to prefer lower velocity, but the ankles preferred higher velocity.
4. Discussion
4.1 Faster airflow in summer
The experiment results showed that the local airflow, which penetrates through the natural convection boundary layer, caused the sensations of warmth or coolness and air motion. The subjects felt the local airflow differently between the necks and ankles. In summer conditions, the above results indicated that the local airflow with higher airflow than the present standards seems to be accepted for both locations. The frequency distribution of thermal comfort votes was made into a table by combining the three votes at the temperature and velocity-change experiments as a mean value as is shown in Table 4.
Figs.7. (a) and (b) show the relative frequency of the thermal comfort votes at the neck and the ankles in the temperature-change experiments (air velocity was 0.5 m/sec). The uncomfortable votes are located at the left side, and the comfortable votes are located at the right side of the figures. In the following, the airflow with temperature differences of -5 and –10°C is called cool airflow, and those with temperature differences of +5 and +10°C are called warm airflow.
A slightly higher percent of subjects (about 2.8% higher) felt discomfort in their necks in the cool temperature than they felt in the warm temperature. A slightly lower percentage of necks (about 2.5% lower) felt comfortable.
Fig.7. (b) shows that the percentages for comfort and discomfort, as recorded at the ankles were higher in the cool temperature than in the warm temperature. These differences were 1.8% and 0.7% for the uncomfortable and comfortable votes, respectively. These indicated that the ankles felt more uncomfortable than those that felt comfortable when the cool temperature was applied. However it felt more neutral for the warm temperature. These results indicated that at the necks and the ankles, higher temperature airflow was more acceptable than the lower temperature at an air velocity of 0.5 m/sec.
Figs.8. (a) and (b) show the relative frequency of the subjects who felt the airflow to be uncomfortable, neutral and comfortable at the necks and the ankles in the velocity change experiments (room temperature and local airflow temperature were between 26 and 28°C). At the necks (see Fig.8.(a)), the uncomfortable frequency increased slightly with the velocity increase. The average frequency of the five velocities was 12%. The frequency of comfort votes increased with velocity increase generally, and their average was 31%. The relative frequencies of the uncomfortable votes at the
(a) Temperature Change (b) Velocity Change Fig.5. Thermal Comfort Votes
(a) Temperature Change (b) Velocity Change Fig.6. Percentage Dissatisfied
ankles decreased averagely with air velocity see Fig.8. (b). The average of the uncomfortable votes through all the velocities was 21%. The relative frequency of the comfortable votes increased with air velocity. Their average was 13%. These results indicated that the faster airflow was more favorable than the slower airflow at the necks, but it was not true at the ankles.
The above results suggest that there is a possibility to attain a comfortable condition with a combination of higher temperature and faster airflow for summer condition. The relative frequencies of the uncomfortable and comfortable votes indicated that this combination of local airflow should in practice be directed to the neck rather than the ankles. It may be more efficient in terms of energy use.
4.2 Influence of temperature and velocity in common conditions
The local airflow with different temperatures or different air velocities gave a different sensation for thermal comfort at the back of the necks and the ankles. Fig.9. shows the relative frequency distribution of thermal comfort votes at a combination of temperature difference of 0°C and velocity of 0.5m/s, which were chosen from the temperature and velocity change experiments. Here the votes of males and females are treated together. The relative frequency distributions in the temperature and velocity change experiments were not significantly different (p=0.77)
at the neck, and it was also true at the ankles (p=0.89). This means that the votes at this condition in the four types of experiments can be combined for statistical analysis. The responses of the necks and the ankles to the temperature change experiment were significantly different (p< .05).
Fig.7. Votes Frequency in Temperature Change Experiments
Fig.8. Votes Frequency in Velocity Change Experiments
When the votes were grouped in three categories of uncomfortable, neutral, and comfortable, the relative frequency of uncomfortable vote at the necks was lower by 12% in temperature, and by 7% in velocity change experiments than the ankles. Those of neutral votes at the necks were slightly lower by 2% and by 7% in temperature change and in velocity change experiment, respectively. The comfortable votes were higher at the necks than the ankles by 14% for both experiment changes. These indicated that the necks were more tolerant than the ankles in the summer for both experiment changes. The necks seemed to be in more favor of change to the air velocity in the summer. The allowable thermal environment defined in ASHRAE Standard 55 is a condition, which is accepted by 80% of occupants, where the experiments were conducted with the mean air velocity of under 0.15 m/s and the votes above -0.5 in the full scale of 7-steps were assumed to be comfortable. When 80% is taken as the border of acceptance, the present results showed that the local airflow of a velocity of 0.5 m/s was accepted at the necks but not accepted at the ankles.
5. Conclusions
The results of the present experiment showed that the thermal sensations and the airflow perceptions were less sensitive at the ankles than the necks for the stimulation of the temperature and the air velocity in summer experiments. The effects of the temperature changes were not so clear as that of the velocity changes in thermal comfort votes at the necks and ankles. The necks and the ankles felt the faster airflows more comfortably than the slower airflows. The higher air velocity than what is suggested in the ASHRAE Standard as the allowable mean air velocity in an office space (0.18 m/sec for summer and 0.15 m/sec for winter) was acceptable at the necks but not at the ankles in the summer of a tropical or temperate area.
The necks evaluated the faster airflow more comfortably than the ankles. It seems that the airflow at the necks increased a feeling of freshness and encouraged a sedentary performance. The percentages of dissatisfied were higher at the ankles than the necks. These may indicate that cool airflows should be concentrated to the back of the necks, and not to the ankles.
Acknowledgments
This study was supported partly by the 21st Century COE Program on "Ecological Engineering for Homeostatic Human Activities" of the Ministry of Education, Culture, Sports, Science and Technology, Japan.
References
1) Arenas, et.al., 1998."A study of occupant cooling by personally controlled air movement", Energy and Buildings, 27, pp.45-59.
2) ASHRAE. 1992. ANSI/ASHRAE Standard 55-1982, Thermal Environmental Conditions for Human Occupancy, Atlanta: American Society of Heating, Refrigerating, and Air Conditioning Engineers, Inc.
3) Cena, K. et.al., 1999. "Field study of occupant comfort and office thermal environments in a hot, arid climate", ASHRAE Transaction, 105 (2), pp.204-217.
4) Fanger, P.O. et.al., 1974. "The effect on man's comfort of a uniform airflow from different directions", ASHRAE Transactions, 80 (2), pp.142-155.
5) Fanger, P.O, and Christensen, N.K., 1986. "Perception of draught in ventilated spaces", Ergonomics, 29 (2), pp.215-235.
6) Homma, H., 2002. "An experimental study of convection heat transfer of a body disturbed by local airflow", ASHRAE Transactions, 107 (2), pp.406-414.
7) Houghten, F.C. et.al., 1938. "Draft temperatures and velocities in relation to skin temperature and feeling of warmth", ASHRAE Transaction, pp.289-308.
8) Khedari, J. et.al., 2000. "Thailand ventilation comfort chart", Energy and Buildings, 32, pp.245-249.
9) L. Nurul H., et.al, 2003. "The effect of temperature and air velocity change on human sensation, Proceeding 7th International
Conference on Energy-Efficient Healthy Buildings, Vol.2,
pp.761-767.
10) L.Nurul H., Homma H., 2004. "Thermal Comfort Disturbed by Local Airflow in Winter. Journal of Asian Architecture and Building Engineering (JAABE), Vol. 3, No.1, pp.55-62, May, 2004.
11) L. Nurul H., Homma, H., 2005. "Thermal sensation of local airflow with temperature and velocity changes: comparison between summer and winter. ASHRAE Transactions, Vol. 111. Part 1, pp.123-131, 2005.
12) McIntyre, D.A., 1978. "Preferred air speeds for comfort in warm conditions", ASHRAE Transaction, 84 (1), pp.264-277.
13) Tanabe, S., et.al., 1972. "Thermal comfort requirements during the summer season in Japan", ASHRAE Transaction, pp.564-577. 14) Toftum, J., et.al. 1997. "Effect of airflow direction on human
perception of draught", Clima 2000, paper 366.