International Journal of Software Engineering & Applications (IJSEA), Vol.3, No.1, January 2012
DOI : 10.5121/ijsea.2012.3109 117
Vikash Lalsing
1, Somveer Kishnah
2and Sameerchand Pudaruth
31
TNT Express ICS Mauritius, Ebene Cybercity, Rose Hill [email protected]
2Department of Computer Science Engineering, University of Mauritius, Reduit, Moka [email protected], [email protected]
A
BSTRACTWith the increasing popularity of Agile Methods, many software organisations are moving away from traditional methods to adopt Agile development methodologies. Instead of being predictive, Agile is rather adaptive and people-focussed. It advocates a small and collaborative team that work closely together. But team size is a factor that is in turn constrained by people factors. When implementing Agile, these key factors are often overlooked. This study aims at identifying the underlying people factors to consider when adopting Agile for a team to be effective. The method used is the study of three different sized Agile teams developing products based on the same technologies and using Scrum. Both objective and subjective measures were used and the results are supported by a survey. The results clearly show that for agile methodologies to work well, it is crucial to select the right people for the right team.
K
EYWORDSAgile Methodology, Scrum, Agile Teams, Software Development, Project Management
1.
I
NTRODUCTIONAgile project management is a conceptual framework in software engineering where software is built within a relatively short period of time and has several iterations which yield stable release of software (Hariyadi, 2011). According to the Agile Manifesto (2011), Agile is based on a set of principles that focus on customer value, iterative and incremental delivery, intense collaboration, small integrated teams, self-organization and small and continuous improvements. It is often stated that Agile Management works best with small teams. According to Bustamante and Sawhney (2011), the ideal Agile project team is small, co-located, communicate face to face on a daily basis and has an ideal team size not exceeding nine people. Along with this, Agile methods such as Scrum recommend an optimal team size of seven plus or minus two. However some industry specialists claim that Agile is a one size fits all methodology and that it can be scaled up to a 150 person team. In general Agile Management is faced with one key challenge:
International Journal of Software Engineering & Applications (IJSEA), Vol.3, No.1, January 2012
118
Since Agile is very people focussed, there is a further need to understand how team size affects individual behaviour and productivity within an Agile team. This gives rise to another challenge:
• What people factors should be considered when managing an Agile team to make it
effective?
This paper analyses an Agile project management methodology, pilot it in practice with real life projects and aims at identifying the people factors to be considered for an Agile team to be effective. This study takes into consideration to some extent a few psychological factors that can affect team collaboration such as working memory, optimal experience and recommended team size based on social behaviours. To achieve this, three sample Agile teams of different size will be used and managed with the same Agile principles. The results will help determine which team, given that they all have all the necessary skills sets and similar team member profiles, will work best and produce the most optimal results. Agile recommends that, instead of having only developers, Agile teams should have all the required skills sets.
Although some Agile methodologies such as Scrum do have a recommended team size, it is a widely believed that Agile is a concept of one size fits all and is therefore scalable. But the question then arises, how big is too much for an Agile team before it starts to lose its efficiency? In a research performed by Ancona and Caldwell’s (1992), the results indicated that team size may have a direct impact on group performance and communication. Agile Management is very people focus whereas Software Project Management is a rather technical discipline. Project Managers moving from traditional to Agile Methods often spend more time managing projects rather than managing the people working on the projects. This implies that people factors are often not considered when managing Agile teams and they may not be performing at their optimal level.
In spite of the growing popularity of Agile Management (Agile Manifesto, 2011) the rate at which software projects are failing is still alarming. According to the Standish 2009 Chaos Report (Standish, 2009), the average success rate is of all IT projects is 32%, 44% were challenged and the failure rate is 24%. The project success rate has decreased from previous years with only 32% being successful, whereby these were delivered on time, to budget and with all required functionalities. 44% of the projects were challenged which means that either they were delivered late, over budget, and/or with less functionalities that were initially intended. The remaining 24% of IT projects failed and had to be cancelled prior to completion and were never used.
Furthermore, according to Scott W. Ambler (2010a), the success rates for Agile projects are 60% are successful, 28% are challenged, and 12% are failures. The success rate for Agile projects is 83% for small teams (less than eleven people), 70% for medium-sized teams (between eleven and twenty-five people), and 55% for large teams (more than twenty-five people). Based from these figures it is clear that Agile team size has a direct incidence on the success rate of the project.
International Journal of Software Engineering & Applications (IJSEA), Vol.3, No.1, January 2012
119
discussion from the study are included in sections 4. Section 5 presents a conclusion and an outline for future work.
2.
L
ITERATURER
EVIEWThis chapter analyses existing research and studies performed on Agile development teams.
2.1. Agile and People Management
People and team management are based on various models such as “The five dysfunctions” (Lencioni, 2001) and Tuckman’s model (Tuckman, 1965). All of these models require that team members have a lot of interaction. The more persons there is on a team, the more interaction is required and the more difficult it is to manage such teams. In an Agile team, the project manager must define the relationships between the roles to enable the effective coordination and control of the project. The following rules should be applied when defining organisational structures:
• Ensure that each member of the team reports to one and only one person (the “unity of command principle”)
• Ensure that each person has no more than seven people reporting directly to him or her (the
“rule of seven” principle) (Fayol, 1917).
However, individuals with different personalities are often expected to work together as a cohesive team. Team efficiency is often dependent on the interaction between team members and the coordination of the team leader. According to studies, team efficiency is at its peak when team size is of 3 to 7 and it starts to decrease when team size goes beyond 9 members (Abilla, 2006). Agile teams also work best in a common workspace or “war room,” which enable team members to work in a shared environment. This approach facilitates communication and collaboration and has proved to an effective mean of increasing team productivity.
In a software project the objective is to deliver a project on time, to budget and within the agreed quality level. Therefore software project managers have the responsibility for the success of projects. Managers should be skilled leaders and good at organising problem-solving sessions that enable maximizing collaboration across departments (Johnson, 2008).
“AGILE like many methods ... look great on paper but fail to work in reality because they forget the human factor. Any paradigm, which has human interaction at its heart, will fail if human psychology is not understood and taken into account. The key aspects of human nature which IT development/project management methods have to take into account are no different to those at the heart of most modern economic theories”, (Brady, 2006):
• People will always put their own interests ahead of the interests of the group
• People are self-interested
International Journal of Software Engineering & Applications (IJSEA), Vol.3, No.1, January 2012
120
• Karl Popper’s “First law of collective action”. You can never get more than 5 people to
agree on anything.”
Cognitive studies tend to explain the state of mind of team members working in a collaborative environment. This is addressed by the Theory of Flow (Csíkszentmihályi, 1990). Flow (Optimal Experience), is the rational state in which a person in an activity is totally absorbed, totally focus, have full engrossment, and eventually acquires success in the process. The state of flow is attained when a person has both higher than above challenge and skills in a specific activity. Not only Flow is important to individuals but it can also contribute to team efficiency and organizational goals. Flow generally leads to higher productivity, innovation, and employee development (Csikszentmihalyi, 1990). While it is not readily feasible to identify the state of mind of employees within an Agile team, a psychological evaluation may be required in order to determine how to achieve the optimal experience for individuals in an Agile team.
Alan Baddeley represented the model of working memory and clearly demonstrated how the short-term memory works (Baddeley and Sala, 1996). He stipulates that the mind processes different types of information in different ways. The human mind is limited in its capacity to retain short term information and this can have an impact on an individual’s performance in an Agile team whereby work progressed is continuously changing and in short periods of time.
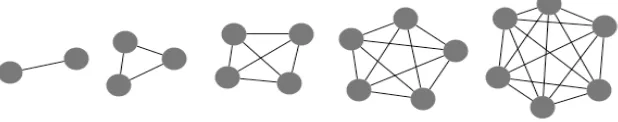
One of the root causes of failure in projects is communication — either a lack thereof, or miscommunication. Large teams are inherently vehicles for bad communication. This is based on the number of communication channels which grow geometrically, not linearly (Abilla, 2006). A three member team has three communication channels and a five member team has ten, twice the number of persons. However a six member team has as much as fifteen communication channels. This can be represented as below:
Figure 1. Overview of communication channel complexity (N x (N - 1) / 2)
Therefore the more persons there is on a team the more difficult it is to communicate and share information among team members. Thus team size affects both efficiency and productivity of teams directly. For Agile to work best each team member should have visibility of what the team is doing. Given that the human mind has such limitations as discussed above then Agile may probably work best with a small team size consisting of highly motivated individuals. Staffs have a sense of belonging towards the company or the team if there is group project and social events and well-being. Recognition and appreciation of work, promotion and job designation is the achievement of esteem needs. Knowing that people achieve best when they reach the esteem and self actualization level, Agile Management may need to focus a lot on ensuring that team members reach that level of satisfaction within the team.
International Journal of Software Engineering & Applications (IJSEA), Vol.3, No.1, January 2012
121
to traditional methods. This creates cohesion between Agile team members and has a positive impact on both personal and team productivity. The author does not go into detail to understand the motivation and cohesion of Agile team members based on the team size in which they have worked. This can be a key differentiator to determine the level of satisfaction and motivation one has when working in different team sizes.
In a study performed by Sudhakar et al. in 2011, it was found that there are several soft factors that can affect the performance of team members in a software development team. It is stated that there are four categories of factors that affect the performance of a development team: technical, non-technical, organizational and environmental.
The authors proposed the following soft factors that can affect software team performance:
• Team climate: shared perceptions and objectives to achieve organisational goals.
• Team diversity: The variation of team member skills, levels of experience, qualifications, gender and race for instance.
• Team innovation: new approaches to problem solving and value added skills.
• Team member competencies and characteristics: Technical and personal competencies
of people on team that impact familiarity and collaboration.
• Team leader behaviour: Less micro-management approach and more people management and a facilitator role.
• Top management support: Commitment from management to the project
From this study, two key factors were found to be the most influential on software team performance, namely: trust and effective communication. The study is generalised and fails to identify the relationship between the project management methodologies used with these soft factors. It may be that different people factors influence the success of an Agile team.
Shane Hastie (2004) discusses how Agile differs from traditional methods by putting much more emphasis on team work, cooperation and self organisation. One of the key to the success of Agile is trust, which needs to be present both between the leader and the team and among the team members themselves.
The paper does give a good insight on the factors that may influence the productivity of Agile teams. However the factors were not investigated with relation to team size and did not make adequate consideration on how this could influence people factors in an Agile team. As seen from previous studies, team size can be a key factor to the success of a software project. It can also influence individual’s behaviour and possibly give rise to other soft factors that may need consideration.
International Journal of Software Engineering & Applications (IJSEA), Vol.3, No.1, January 2012
122
and quality of software. In a software project, the key areas which are impacted by people factors are:
• Staffing: The right persons should be selected to work for the development of a software
project. In broad terms, it means that the customer should be represented by skilled staffs who are collaborative, representative, authorized, committed, and knowledgeable (CRACK) (Turner and Boehm, 2003). The characteristics of developers within an Agile team should include amicability, talent, skill, and communication.
• Culture: Agile requires a true cultural change from plan based approach, not only a simple change in the processes used.
• Values: One of the most neglected challenges in software development is the consolidation
and value of requirements from all stakeholders involved.
• Communication: Agile requires more frequent and intense communication, the more persons on a team the more challenging and problematic it becomes to communicate effectively.
• Managing Expectations: Software development teams often fail to manage expectations and
this can cause issues between the teams and the customer.
Whilst the paper covers the major areas impacted by people factors in a development team and even mention communication complexity and impact of team size, the authors do not explore the ideal team size that can affect the effectiveness of an Agile team. There is also limited reference to the actual people factors that should be considered within Agile but more on the areas impacted.
In a study published in 2011 (Conboy et al., 2011) it was found that the increasing use of Agile approaches and growing pressure to adopt Agile Management, contribute to the need for human resource departments and project managers to address people challenges. There is a need to identify the problems that the Agile transition may cause. A list of the most important people challenges in Agile was proposed as follows: developer fear caused by transparency of skill deficiencies, the need for developers to be a ‘master of all trades’, increased reliance on social skills, a lack of business knowledge among developers, the need to understand and learn values and principles of Agile, not just the practices, lack of developer motivation to use Agile methods and the need for Agile compliant performance evaluation.
International Journal of Software Engineering & Applications (IJSEA), Vol.3, No.1, January 2012
123
3.
P
ROPOSEDM
ETHODOLOGYThe following chapter focuses on the methodology used to identify the people factors that can affect an Agile team’s performance.
3.1 Company background
This study has been made with the development teams of an organisation that specialises in transportation and freight services. The organisation is a major player in Europe and is fully operational across the Middle East, Asia, South America and Australia. The IT department of the organisation exist for well over 30 years and has reached a sound level of maturity in the software industry. It has been using several development methodologies including a fully customised Rational Unified Process and recently moved to Agile Methodology using Scrum. The software development teams are based in Mauritius with the head office located in the United Kingdom.
3.2 Study of Agile Teams
This study has been performed using three different sized projects using Agile Methodology over a period of six months. Not all the projects have taken the full six months for completion; as some have been completed within a shorter timeframe. Completion is considered as the phase at which the project is successfully deployed into production and signed off by the customer. Based on the subject matter of this study and to increase the rate of accuracy, no other parameters apart from the project size and team size were drastically different. All three agile teams had the same roles, skill sets and using the same Agile processes i.e.: Scrum. For confidentiality purposes, the projects used will be referred to as A, B and C within this study.
3.2.1 Project size
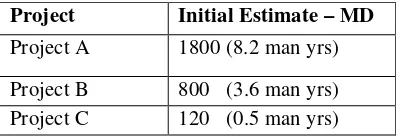
The projects were initially estimated as follows:
Table 1. Overview of Project Size.
Project Initial Estimate – MD
Project A 1800 (8.2 man yrs) Project B 800 (3.6 man yrs) Project C 120 (0.5 man yrs)
3.2.2 Architecture and Level of complexity
International Journal of Software Engineering & Applications (IJSEA), Vol.3, No.1, January 2012
124
Table 2. Overview of technologies and complexity.
Project Language/Technology Complexity
A Java Services, WebSphere Portal, Oracle, Spring MVC, Free-Marker High B Java Services, WebSphere Portal, Oracle Database, Spring MVC High C Java Services, WebSphere Portal, Oracle Database, Spring MVC,
Free-Marker
High
All three projects used for this study have the same architecture, similar complexity but different scale. The applications have been developed using WebSphere Portal technology for the User Interface and Java back-end services which in turn talk to Domain objects and Oracle database.
3.2.3 Team Profile and Structure
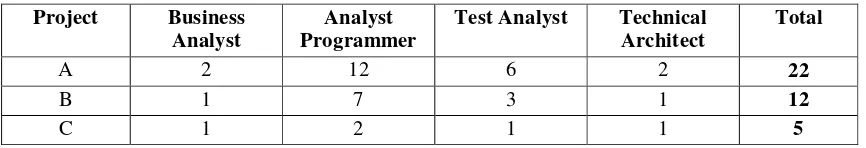
Each team is lead by a Project Leader and the whole project is owned by a Project Manager. The table below gives an overview of the various roles that were allocated within each team:
Table 3. Overview of Project Teams.
Project Business Analyst
Analyst Programmer
Test Analyst Technical Architect
Total
A 2 12 6 2 22
B 1 7 3 1 12
C 1 2 1 1 5
3.2.4 Method of Measurement
A project outcome can be measured using both objective and subjective measures (Kemerer, 1989; Bahli and Bu¨yu¨kkurt, 2005; Ong et al., 2005). A team’s performance can be measured by evaluating whether the output produced is on schedule and on budget (Boehm, 1981). This includes measuring the quality of software produced and compliance to schedules and budget (Huckman et al., 2009). Quality of software can be measured using number of defects found in testing (Boehm, 1981). For the purpose of this study, the objective measures used are metrics based whereas the subjective measures are based on a team survey and management observations. The following metrics were measured for each team.
Budget
International Journal of Software Engineering & Applications (IJSEA), Vol.3, No.1, January 2012
125 On Time Delivery
Project planning is performed on JIRA and it provides a road map with different releases and their planned release dates. The actual release dates are updated whenever the release goes out to the consumer. At the end of the project, any release deadlines that are not achieved can easily be tracked on JIRA.
Defects
Defects are categorised as non fulfilment of requirements as per defined documentation or undesired functionality due to coding error. Defects can have four types of severity:
• Critical: Resulting in a total loss of the functionality of the system or a partial loss in a key
area of the system that makes the software unusable or unstable.
• Major: Resulting in a core requirement not being fulfilled and impact a main functional flow or process. Often causes data discrepancy and failure of several alternative flows.
• Blocker: A coding error or a pending change based on requirements that impacts the
alternate flows of a requirement and prevents the usage of a particular functionality which is regarded as low impact.
• Minor: A negligible defect that can pertain to graphical user interface, basic validation with non-breaking effect.
Rework Level
Rework is calculated as the actual man-days spent on a project to fix defects that have been raised by system or integration testing. This figure is then divided by the budget actual to determine the percentage of rework:
JIRA is used as the tool to track defects and time spent fixing a defect. This provides the data to calculate rework level.
Defect Rate
Defect rate is based on the number of defects detected on a software over the total amount of actual time spent on the development of the software. For instance:
Number of days spent on a project : 100 man-days Total number of defects found on the project : 150
Defect rate of the team : 1.5
So for every day of work produced, approximately 1.5 defects are introduced.
Rework Level =
Time spent fixing defect
International Journal of Software Engineering & Applications (IJSEA), Vol.3, No.1, January 2012
126 Release and Change Management
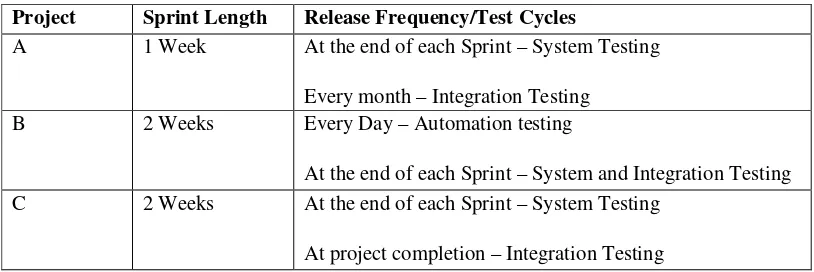
In a team where the number of issues fixed or functionalities being developed on a daily basis are high, nightly builds help in identifying any potential issues with the code as early as possible so that a stable release is made available to the test team as the end of each sprint. This has been the case mostly for Project B whereby a high number of defects were raised by test team and needed to be fixed as soon as possible. Table 4 provides an overview of the release frequency for each project as well that the frequency for testing cycles and the types of testing that were done.
Table 4. Release Frequency.
Project Sprint Length Release Frequency/Test Cycles
A 1 Week At the end of each Sprint – System Testing
Every month – Integration Testing B 2 Weeks Every Day – Automation testing
At the end of each Sprint – System and Integration Testing C 2 Weeks At the end of each Sprint – System Testing
At project completion – Integration Testing
Changes in each project are managed through the organisation change process which consists of the following stages:
• Initiation – Changes are documented and raised by the Business Analysts and created on
JIRA
• Analysis and estimation – This stage involves the approval from Technical Architect for the
change to be performed from an architecture perspective. Changes are then reviewed by the development team with the risks and impact assessed and estimates are produced.
• Approval – Business Analyst and Project Manager approve both budget and planning on the
change
• Implementation and delivery – Changes are planned in the appropriate Sprints and delivered
as per agreed timelines and budget spends. Whenever changes are approved and implemented, the estimated costs are added to the overall estimate of the project.
Questionnaire Design
International Journal of Software Engineering & Applications (IJSEA), Vol.3, No.1, January 2012
127
• Section A – Agile Management. This section consists of five questions and aims at
understanding how the team members felt about the way their respective projects were run from an Agile Management perspective.
• Section B – Team Work. This section of the questionnaire will help understand the
mindset of the team members and motivation. It will also help in identifying some key people factors that have been mentioned in the previous research.
• Section C – Product. The questions in this section are aimed to understand the level of
challenge that the individual has to face in the project and overall perception of the end product to gauge the satisfaction level.
Each team members will be required to fill in the questionnaire at the end of the project and the data will be collected on a per project basis.
4.
R
ESULTS ANDD
ISCUSSIONIt should be noted that the results that came out of this research should not be considered as wide practice or as a standard across the software industry. However they do provide an insight of what is the best option for an Agile team size and the factors that need to be considered.
4.1 Budget
The budget spent for each projects were collated following their completion from tools such as JIRA and Clarity. The results are as follows:
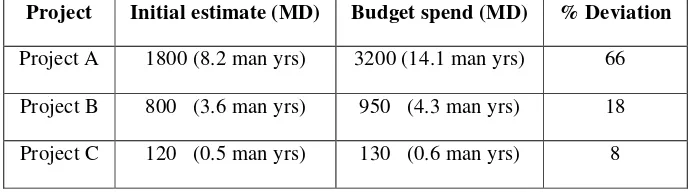
Table 5. Budget.
Project Initial estimate (MD) Budget spend (MD) % Deviation
Project A 1800 (8.2 man yrs) 3200 (14.1 man yrs) 66
Project B 800 (3.6 man yrs) 950 (4.3 man yrs) 18
Project C 120 (0.5 man yrs) 130 (0.6 man yrs) 8
As seen in the table above, the over spend has been largest in Project A with a deviation of over 65%. This has been mainly attributed to the following factors:
• Team Communication and Collaboration: There was little interaction between the two
International Journal of Software Engineering & Applications (IJSEA), Vol.3, No.1, January 2012
128
the early stage of the project. This had a significant impact on the project budget as not only time was required to fix unexpected issues but also to ensure proper integration after these fixes were made.
• Trust: It was observed that there were trust issues amongst team members. In some
situations, individuals would not allocate tasks to others on the basis that they did not think the other person could complete the work in an effective manner and on time and hence took up these tasks themselves. This has caused delays on certain areas.
• Team Interaction: Each sub team had to hold its own daily meeting and pass any information relevant to the other team through the project leaders. However the coordination between the two teams was not always easy. It was not very practical to hold the daily Scrum meetings. More than often about an hour was spent in the daily updates. Some members who had already provided their updates for the day were keen to leave the meeting to be able to continue working on their assigned tasks. They did not think that they the information being discussed was relevant to them and felt that they were being unproductive.
• Code Integration: There have been a large number of code integration issues between the two Agile sub teams that caused a lot of rework to make the integration of components work as expected. Each team were performing their own daily Scrums and aiming at completing tasks assigned to their respective team. However there was little visibility on what the other teams was doing, mainly because there was not enough time for team members to dig into the tasks assigned to the other team. There were simply too many tasks for a team to look into the other teams work basket. A lot of functionalities were not in synched, for instance components did not match the expected behaviour due to developers making changes in their component without proper evaluation of impact on its dependencies or did not remember communicating the changes to everyone or even did not communicate information to people who they do not get along that well.
• Last minute defects: Integration issues were often uncovered at the last minute when performing a release as both sub Agile teams would start integrating their work as least one day before a planned release date. This was performed on a weekly basis and a release made to system testing team. However since the issues were uncovered late, this caused a lot of rework and quite a number of releases got delayed.
• Defect Rate: The fact that a lot of functionalities were being delivered on a weekly basis
meant that continuous testing had to be performed. This in turn gave rise to a significant amount of defects to be raised and require fixing. The impact was that rework level increased and impacted on the budget.
• Requirements Clarification: The velocity at which the teams were working was quite
International Journal of Software Engineering & Applications (IJSEA), Vol.3, No.1, January 2012
129
Management views on Project A are that is was difficult to manage the team using Agile approach and there were many instances where team members focussed mainly on their own deliverable rather than team output and forgot to pass information to everyone.
Project B was 18% over budget and this was mainly attributed to:
• Communication and Collaboration: Communication was not effective in the team as a few
team members would not share information obtained fro the Business Analysts either because they tend to forget to pass the information to all team members or they thought that the information would not be relevant to the other areas being developed. Based on this, quite a number of requirements were not properly implemented and required some re-work.
• Requirements: Some of the development team members were not familiar enough with
the business processes that were being implemented and therefore more time was spent in requirements clarifications with the business analyst. There were also little or no documentation for some areas of the project and the knowledge resided with some key team members only.
• Quality of information shared: There was often inaccurate information being provided
when clarifications were requested. This caused a large number of defects to be raised by testers as they would test according to documentation available whereas developers would perform development based on knowledge and information gathered from the Business Analyst.
• Conflicting views: Daily Scrum meetings would sometime overrun because it was
difficult to get agreements on some issues and this meant that separate meetings had to be held to ensure that a consensus is reached so that development could run smoothly.
Management views are that the project was delivered late and over budget but it matched all requirements requested by the business.
The budget deviation for budget for Project C was around 8% and the main causes were:
• Underestimated areas of work: Due to the fact that requirements were not properly analysed at the start of the project, some areas of development were not properly estimated and the impact on sub components not identified. During development the impact became obvious and impacted to initial budget.
The allowable deviation from budget for all projects based on the organisation standards is 10%. Therefore only Project C was within the standards whereas Project A was well outside.
4.2. On Time Delivery
International Journal of Software Engineering & Applications (IJSEA), Vol.3, No.1, January 2012
130
Table 6. On Time Delivery.
Project Releases performed Releases on time % on Time
Project A 40 12 30
Project B 25 15 60
Project C 10 9 90
From Table 6, it can be seen that Project A had the largest number of releases and due to the fact that most of them were performed late and testing and deployment were in turn delayed. The project itself was not implemented on time and way off its target delivery date. The main reasons for late deliveries were the large number of defects that were raised due mainly to integration and coding issues.
Project B also faced some similar issues as Project A. Releases were not on time due to integration problems and also lack of coordination with external teams such infrastructure meant that environments were often not working as expected. Deployment and configuration were not performed in an effective manner as the team were focussing mainly on completion of pure development tasks as a priority and often meant that setting up of environments were requested late. The organisations standards allow for a minimum of 90% on time delivery for all projects. Based on the information collected, only Project C satisfied this criterion.
4.3 Rework
The rework level for each project has been calculated as below:
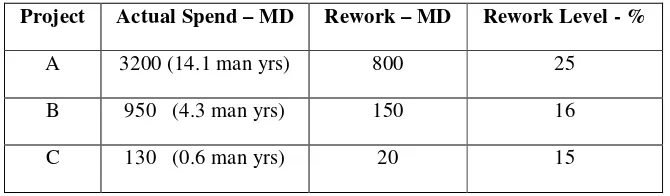
Table 7. Rework Level.
Project Actual Spend – MD Rework – MD Rework Level - %
A 3200 (14.1 man yrs) 800 25
B 950 (4.3 man yrs) 150 16
C 130 (0.6 man yrs) 20 15
International Journal of Software Engineering & Applications (IJSEA), Vol.3, No.1, January 2012
131
4.4 Defect Rate
The defect rates recorded have been as follows:
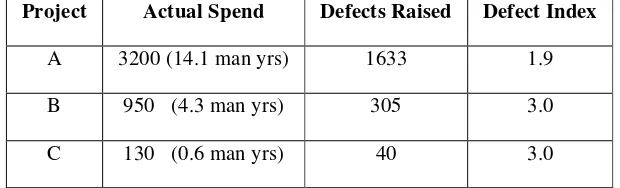
Table 8. Defect Rate.
Project Actual Spend Defects Raised Defect Index
A 3200 (14.1 man yrs) 1633 1.9
B 950 (4.3 man yrs) 305 3.0
C 130 (0.6 man yrs) 40 3.0
Project A has that highest defect index, for every 1.9 man days of work produced a new defect was being introduced. In Project C, the index was higher and for every three days of worked produced a new defect was obtained.
Based on the figures for both rework level and defect count, in general a defect on all three projects would cost about 0.5 man day to be fixed i.e.:
• Project A: 1633 defects requiring 800 man days rework
• Project B: 300 defects for 150 man days rework
• Project C: 40 defects for 20 man days rework
This clearly indicates that the level of complexity for all three projects is comparable and therefore confirms that the projects used were ideal candidates for this study.
4.5 People Aspect
During this study, soft factors of the Agile teams were not measured with any tools or methods except the employee survey and subjective measures such as observations.
As part of the subjective measures, some observations were made on how the individuals behaved during the life of the projects. For all three projects used it this study, particular attention were made to make use of people management best practices. A few issues were encountered in some areas due to inherent complexity in managing particular teams. Such issues could not be quantified on a scale but from an objective view only as described below:
• Accountability: members of all three teams were given clear tasks ownership and this was
International Journal of Software Engineering & Applications (IJSEA), Vol.3, No.1, January 2012
132
to produce the work. This meant that management had to intervene to allocate such tasks to the appropriate teams or individuals. There was a clear lack of visibility and communication that was demonstrated by the fact that some team members did not have a clear knowledge of who does what or who owns what.
• Empowerment: all persons involved on the teams were provided adequate technical training
where required and the authority to create dependant JIRA tasks where necessary. These tasks were then either assigned to other team members or to external teams to progress. Initiators of such tasks were required to monitor the progress until completion.
• Developer Skills and Fear: On project A three of the developers who were not good
communicators did not raise concerns regarding technical areas where they not really good at. This was attributed to the fact that they did not want to show in the daily Scrum meetings that they were technically behind the other team members. This led to more time being spent on tasks assigned to them. The same issue was encountered on Project B whereby one developer did not raise his concerns. But on Project C there were no such issues and when developers needed coaching, this was raised promptly without any fear in daily Scrum meetings. Based on this reaction, it would seem that individuals fear to raise their skill deficiencies in a large group while this creates no concerns when in a much smaller group.
• Leadership: The teams were provided coaching when required and blockers or impediments
that were raised promptly during the daily Scrums had to be progressed either by the Project Leader or Project Manager. This ensured that management acted as a facilitator to the teams while they focus on the delivery of the product.
• Performance management: JIRA provides the facility to view a project’s progress and status
via a dashboard. This was monitored on a day to day basis to ensure that the individual and hence the team is performing as expected and any discrepancies were readily visible and corrective actions could be taken. For instance if a team member were to stay too long on a JIRA ticket this will be seen on the dashboard as below and enable prompt action to be taken during the daily Scrum meetings.
• Effective Communication: The main role of the Project Leader was not only to ensure that any blockers from external dependencies are progressed but as well to ensure that all information received were cascaded in an effective manner to the team. Changes in requirements were always cascaded and regular feedback on how the team is performing was provided.
As recommended by Agile, the project teams worked in a shared workspace in an open office structure that aimed at facilitating communication and collaboration. This was not easily achievable with project A whereby the two sub Agile teams were located in different geographical locations thus hindering communication to some extent.
The way the team members interact were somehow different across the three teams and there were several observations made:
• Interdependence: At least five team members from Project A, although their work had
International Journal of Software Engineering & Applications (IJSEA), Vol.3, No.1, January 2012
133
estimates even at the cost of not ensuring that integration is taken into consideration, at least not until the last minute when it is actually required. This was also observed with a least two members of team B. However for team C the team spirit was quite different and members were communicating quite easily. On project B the same behaviour was observed with only two team members who did not collaborate effectively and causing their completed work to be incompatible with those of other team members. However no such issues were raised from project team C.
• Social Interaction: Although most of the teams had direct face to face communication on a daily basis, some team members from Project A and B would make the use of chat tools to communicate with each other during the day even if the other was in the same office within a few metres. This meant that communication was kept to strict minimum between these persons, only when obliged to do so via team meetings. For Project C the interaction was much better and the team bonded more easily. Members would interact socially by going out to lunch and communicate verbally quite often during the day and this improved their familiarity. The general observation was that for teams A and B, most of the team members did not allow much time to develop the social relationships between each other but rather focussed on the deliverables and often seemed to work under stress. Agile has a high reliance on social skills.
• Perception of a group: While this was easily accepted in Project C and Project B, it was much more difficult in Project A. The fact that there were two sub Agile teams, each member acted as if they were part of their own sub team and could not easily fit themselves in the overall Agile team. This meant that the teams worked independently from each other and often led to communication gaps and integration issues. Most of the team members who were based in the UK were emergent leaders and often took ownership of tasks and at some point even formed mini-teams.
• Commonality of purpose: This characteristic of an Agile team was seen in both Projects B and C but as mentioned above there was not enough motivation for the group to work as one team for project A. There was a lot of individuality in whereby some of the developers were focussed on delivering their own work rather than seeing the overall picture and where it fits in the whole project.
• Motivation: The work on Project B was organised in such a way that specific areas of
development were assigned to a team member. One of the issues encountered however was that some team members express themselves on the fact that they did not feel that the work allocated to them were challenging enough.
4.6 Communication Channels
International Journal of Software Engineering & Applications (IJSEA), Vol.3, No.1, January 2012
134
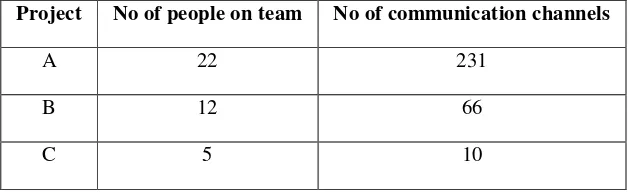
Table 9. Communication Channels.
Project No of people on team No of communication channels
A 22 231
B 12 66
C 5 10
The above table clearly shows 231 communication channels for Project A which gives an insight on how difficult and poor communication could have been among the team members. Agile principles require than team members work in intense collaboration and have face-to-face communication. This was achieved without any problem on Project C whereby the team was small and showed intense collaboration. In project B, even if the team worked closely together there were instances where team members will request to skip meetings so as to complete their tasks. In project A however face to face communication was not always possible between the two geographically dispersed teams even with the use of Video Conferencing systems. It was difficult to coordinate the teams to work together and the distance did not allow direct communication.
5.
C
ONCLUSIONSThis study has been made exclusively based on the Agile Methodology and within an organisation that is making use of Scrum. It did not take into consideration any projects using other types of development methodologies. Therefore it is imperative that before any organisation decides to adopt an Agile Method, it needs to assess whether the company culture, operating structure, business processes and projects are suited for the use of an Agile Project Management Methodology. This study was aimed at evaluating the people factors that can affect the performance of an Agile team. The research was made with a small group of similar projects that differed by size and team size only. This work will give valuable insight to team leaders to select the appropriate number and type of people on each project. It will also be highly beneficial to software organisation which will be in a better position to assess whether agile could work for them. Future work will need to be performed to evaluate whether the same result can be obtained with projects of varying organization, complexity and technology.
A
CKNOWLEDGEMENTSThe authors would like to thank TNT Express ICS Mauritius for allowing them to run this study with actual projects.
R
EFERENCES1.Abilla, P., 2006. Team Dynamics: Size Matters Redux. [Online]. Available: http://www.shmula.com/team-dynamics-size-matters-redux/182/. [Accessed: 27th April 2011]
2.Agile Manifesto (2011). The Agile Manifesto. [Online]. Available : www.Agilemanifesto.org. [Accessed: 10th August 2011)
International Journal of Software Engineering & Applications (IJSEA), Vol.3, No.1, January 2012
135 4.Ancona, D.G., Caldwell, D.F., 1992. Work-groups; climate; Organizational-effectiveness. Administrative Science Quarterly. 37(??)p. 634-65.
5.Baddeley A, Della Sala, S., 1996. Working memory and executive control. Philos. Trans. R. Soc. Lond., B, Biol. Sci. 351 (1346): 1397–403.
6.Boehm, B., 1981, Software Engineering Economics, Englewood Cliffs, N.J., USA, Prentice-Hall. 7.Bahli, B. and Bu¨yu¨kkurt, M.D., 2005. Group performance in information systems project groups: an empirical study, Journal of Information Technology Education, Vol. 4.
8.Bustamante, A., Sawhney, R., 2011. Agile XXL: Scaling Agile for Project Teams, Seapine Software, Inc.
9.Brady, K., 2006. AGILE/SCRUM Fails to get to grips with Human Psychology. [Online]. Available:
http://www.claretyconsulting.com/it/comments/Agile-Scrum-fails-to-get-to-grips-with-human-psychology/2006-08-17/. [Accessed : 3rd August 2011]
10.Conboy, K. Coyle, S. Lero, X.W. Pikkarainen, M., 2011. People over Process: Key Challenges in Agile Development July/August 2011 (vol. 28 no. 4) pp. 48-57
11.Csíkszentmihályi, M., 1990. Flow: The Psychology of Optimal Experience. New York: Harper and Row, ISBN 0-06-092043-2.
12.Fayol, H., 1917. (French), Administration industrielle et générale; prévoyance, organisation, commandement, coordination, contrôle. Paris, H. Dunod et E. Pinat.
13.Hastie, S., 2004. The Agile Mindset: what does it take to make this stuff work? Software Education Associates Ltd, Agile Development Conference Wellington & Sydney, September 2004
14.Huckman, R.S., Staats, B.R. and Upton, D.M., 2009. Team familiarity, role experience, and performance: evidence from Indian Software Services, Management Science, Vol. 55 No. 1, pp. 85-100.
15.Johnson, R., 2008. Six Principles of Effective Management. [Online]. Available:
http://ezinearticles.com/?Six-Principles-of-Effective-Team-Management&id=1803062. [Accessed: 28th March 2011]
16.Kemerer, C., 1989. An agenda for research in the managerial evaluation of computer-aided software engineering (CASE) tool impacts, Proceedings of the 22nd Annual Hawaii International Conference on System Sciences, Hawaii, pp. 219-28.
17.Lencioni, P., 2002. The Five Dysfunctions of a Team. Jossey-Bass
18.Ong, A., Tan, G.W. and Kankanhalli, A., 2005. Team expertise and performance in information systems development projects, Proceedings of the 9th Asia Pacific Conference on Information Systems, Bangkok, Thailand, July 7-10.
19.Standish Group., 2009. Chaos Report 2009. [Online]. Available from: http://www1.standishgroup.com/newsroom/chaos_2009.php. [Accessed 20th May 2011].
20.Sudhakar, G.P. Farooq, A. Patnaik, S., 2011. Soft factors affecting the performance of software development teams. Team Performance Management Vol. 17 No. 3/4, 2011 pp. 187-205
International Journal of Software Engineering & Applications (IJSEA), Vol.3, No.1, January 2012 how you perceived it within the team (1 - Lowest, 5 - Highest)
How suitable was the team size for the project? how you perceived it within the team (1 - Lowest, 5 - Highest)
1 2 3 4 5
6
What was the level of trust between you
and the team members in terms of:
How did you perceive the wellness of the
team in terms of:
9 How well did you integrate the team?
International Journal of Software Engineering & Applications (IJSEA), Vol.3, No.1, January 2012 how you perceived it within the team (1 - Lowest, 5 - Highest)
1 2 3 4 5
11
What was the level of challenge of the project?
12
What was the level of difficulty of tasks assigned to you as per your expertise?
13 What was quality level of the project?