Not All Data Is Created Equal
Balancing Risk and Reward in a Data-Driven EconomyNot All Data Is Created Equal
by Gregory Fell and Mike Barlow
Copyright © 2016 O’Reilly Media, Inc. All rights reserved. Printed in the United States of America.
Published by O’Reilly Media, Inc., 1005 Gravenstein Highway North, Sebastopol, CA 95472.
O’Reilly books may be purchased for educational, business, or sales promotional use. Online editions are also available for most titles (http://safaribooksonline.com). For more information, contact our corporate/institutional sales department: 800-998-9938 or
[email protected]. Editor: Courtney Allen
Production Editor: Kristen Brown
Copyeditor: Kristen Brown
Interior Designer: David Futato
Cover Designer: Randy Comer
Illustrator: Rebecca Demarest
Revision History for the First Edition
2016-03-30: First Release
The O’Reilly logo is a registered trademark of O’Reilly Media, Inc. Not All Data Is Created Equal, the cover image, and related trade dress are
trademarks of O’Reilly Media, Inc.
While the publisher and the authors have used good faith efforts to ensure that the information and instructions contained in this work are accurate, the publisher and the authors disclaim all responsibility for errors or omissions, including without limitation responsibility for damages resulting from the use of or reliance on this work. Use of the information and instructions contained in this work is at your own risk. If any code samples or other technology this work contains or describes is subject to open source licenses or the
intellectual property rights of others, it is your responsibility to ensure that your use thereof complies with such licenses and/or rights.
Not All Data Is Created Equal
When you’re driving through a blizzard, all the snow on your windshield looks the same. If you were to stop and examine the individual snowflakes more closely, you would discover an astonishing variety of shapes and
formations. While linguists and anthropologists bicker over how many words the Eskimos really have for snow, the simple truth is that there are many different kinds of snow.
Like snow, data comes in a wide variety. There’s personal data, demographic data, geographic data, behavioral data, transactional data, military data, and medical data. There’s historical data and real-time data. There’s structured data and unstructured data. It often seems as if we are surrounded by rising mountains of data.
The big difference between snow and data is that unless you own a ski resort, snow isn’t perceived as economically valuable. Data, on the other hand, is increasingly seen as a source of power and wealth.
If you live in a region where winter snowstorms are common, then your town probably has a fleet of snowplows and a snow emergency plan. Very few companies, however, have developed comprehensive policies and robust practices for categorizing and prioritizing their data.
“The main challenge in creating policies and practices for managing data effectively is the limited ability of most businesses to identify data assets and categorize them in terms of criticality and value,” says Chris Moschovitis, an IT governance expert and chief executive officer at tmg-emedia, an
independent technology consulting company.
owning a warehouse full of items, but not knowing how many or what kind of items are in it.
“Data is a business asset, which means it’s owned by the business and the business is responsible for managing it. Business owners should perform regular audits of their data so they have a good grasp of what they own and understand its current value,” he says.
The failure to audit and categorize data can be harmful to a company’s health. “The downside is significant,” says Moschovitis. In most companies, for example, low-value data far outnumbers mid-value and high-value data. Spending the same amount of money protecting all kinds of data, regardless of its value, can be financially crippling.
“If low-value data assets are distributed across systems, then protecting them with controls designed for higher-value assets violates the basic principle that the value of an asset must exceed the cost of the controls,” he says.
“Otherwise, you’re wasting your money.”
Most companies find it difficult to assess the current value of their data assets. Different companies place different values on similar assets. Additionally, the value of data changes over time. Data that was highly
What Your App Isn’t Telling You
Monica Rogati is an independent data science advisor and an equity partner at the Data Collective, a venture capital fund that invests in big data startups. Ideally, she says, companies should develop data acquisition strategies. “You want to capture all the signals contributing to the process of understanding your customer, adapting to changes in markets and building new products,” Rogati explains.
For many digital companies, the challenge is imagining the world beyond the edges of their apps. “Let’s say you make food and deliver it. Your customers use your app to order the food. You capture the data about the order. But what about other data, like the items the customer looked at but didn’t order? It’s also important to capture data about the choices and the pricing, in
addition to seeing what the customer finally ordered. It’s important to know how people are reviewing your food and what they’re saying about it on Twitter. Or if they’re emailing you,” says Rogati.
Knowing what your customers considered ordering can be “nontrivial” data that would help your business, she says. “Most companies don’t log that information. There are many signals from the physical realm that you’re not collecting.”
Weather data, for example, can be extremely useful for many kinds of businesses, since most people are heavily influenced by the weather. “You should also be looking at commodity prices, census data, and demographic data,” says Rogati. If you’re in the food or restaurant business, you need to know the competitive landscape. Do you have many competitors nearby, or only a few?
“There’s a lot of emphasis on coming up with great algorithms, but the data itself is often more important. I’m a big fan of keeping the algorithm simple and thinking creatively about the quality and variety of signals you’re pulling in,” she says.
natives” are superseded by “data natives.” If she’s right, organizations will have to significantly ramp up their data management skills.
“Digital natives are people who are comfortable with computers and who cannot imagine a world without the Internet,” she says. Data natives, on the other hand, are people who expect the digital world to adapt to their
Combining Data Can Be Risky Business
The self-learning machines of tomorrow will require lots more data than today’s smart devices. That’s why forward-looking companies need formal data acquisition strategies — merely trying to guess which data will be important or valuable won’t be enough to stay competitive.
“Everybody realizes that if you want to be competitive, you’ve got to have a data-driven organization,” says Jeff Erhardt, the CEO of Wise.io, a company that builds machine learning applications for the customer experience market. “At the same time, it’s extremely hard to predict who will need access to which types of data to make good decisions.”
Moreover, some of the most profitable decisions are often made by
combining data in novel or unexpected ways. Retailers combine econometric data with weather data to predict seasonal demand. Oil producers combine geological data with political data to predict the cost of drilling new wells. Banks combine data on interest rates with data on personal income to predict how many people will refinance their homes.
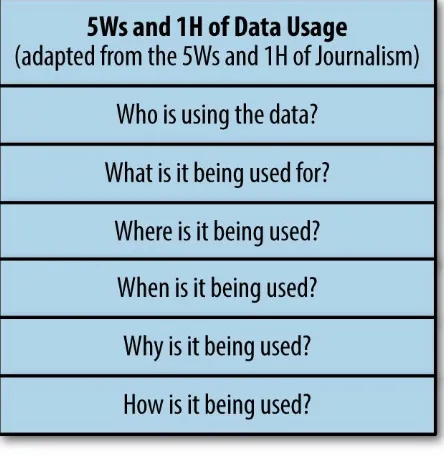
From Erhardt’s perspective, the primary challenge is enabling decision makers to merge various types of data without compromising an
organization’s ability to protect and manage its data. “It’s not just a question of who is using the data, it’s also what the data is being used for,” says
Erhardt. “What’s the impact of the data if it gets into the wrong hands?” Creative combinations of ordinary data can spawn entirely new universes of unknown risks and unexpected consequences. Combining two or three pieces of seemingly innocuous data creates second-order constructs that can easily serve as proxies for race, gender, sexual preference, political affiliation, substance abuse, or criminal behavior. Data that might be harmless in isolation can become dangerous when mixed with other data.
Laws, rules, and guidelines devised to prevent discrimination will be circumvented — intentionally or accidentally — as organizations use
global economy fueled by data.
Remaining anonymous will become virtually impossible. It’s become relatively easy to unmask the identities of anonymous sources, as
demonstrated nearly a decade ago when Arvind Narayanan (then a doctoral candidate at the University of Texas at Austin) and his advisor, Vitaly Shmatikov, developed techniques for finding the identities of anonymous Netflix users. Latanya Sweeney, professor of government and technology at Harvard University and former chief technology officer at the U.S. Federal Trade Commission, has shown that 87 percent of the US population can be personally identified by using their date of birth, gender, and zip code.
In The Algorithmic Foundations of Differential Privacy, Cynthia Dwork and Aaron Roth write that “data cannot be fully anonymized and remain useful ... the richer the data, the more interesting and more useful it is.” That richness, however, invariably provides clues that can be exploited to uncloak hidden identities.
For example, when Professor Sweeney was a graduate student at MIT, she used anonymized public data to identify the medical records of the
Massachusetts governor. As a result, medical privacy rules were tightened, but the underlying principles of information science remain unchanged. “Saying ‘this data is sensitive’ and ‘this data isn’t sensitive’ or ‘this data is identifiable’ and ‘this data isn’t identifiable’ is completely misguided, especially when there is lots of other data available,” says Tal Malkin, associate professor in the Department of Computer Science and the Data Science Institute at Columbia University. “You just can’t say, ‘this data
A Calculated Risk
The easiest solution would be to stop publishing research data, but that would essentially bring scientific research in critical areas such as healthcare, public safety, education, and economics to a dead halt. “A binary approach won’t work. There are lots of gray areas,” says Malkin. “A lot depends on the data and the types of questions you ask.”
In some instances, the best course might be publishing some of the data, but not all of it. In some situations, it’s possible to sanitize parts of the dataset before publishing results. Researchers might choose to keep some of their data secret, while allowing other researchers to pose simple queries that won’t reveal the identities of their subjects.
“Maybe you would provide answers to queries from authorized people. Or maybe it’s something more nuanced, like adding noise to the answers for some types of queries and only answering a limited number of queries,” she says.
Privacy Isn’t Dead; It’s on Life Support
Malkin does not believe we should just throw in the towel and give up on the idea of personal privacy. She sees several possible ways to reduce the risk posed by collecting personal data. “We can be more explicit about the risk and what we’re doing with the data. The biggest danger is ignorance.
Realizing the data isn’t harmless is an important step,” she says. “And we can try to keep as little of the data as necessary. I know that companies don’t want to hear that, but it’s a practical approach.”
For example, it makes sense for the Metropolitan Transportation Authority (MTA), North America’s largest transportation network, to collect ridership data. But does the MTA, which serves a population of 15.2 million people in a 5,000–square-mile area including New York City, Long Island,
southeastern New York State, and Connecticut, really need to know which subway station you use to get to work every day?
You could argue that it’s important for the MTA to track ridership at each of its 422 subway stations, but the MetroCard you use to get through the
turnstile is also a handy device for collecting all kinds of data.
“I understand why the MTA wants to know how many people are riding the subway,” says Malkin. “But do they also have to know everywhere I’ve traveled in New York? What are their goals?”
Are Your Algorithms Prejudiced?
As mentioned earlier in this report, combinations of data are more potentially dangerous than data in isolation. In the near future, it might seem quaint to even think of data in isolation. All data will be connected and related to other data. We won’t just have data lakes — we’ll have data oceans.
In that version of the future, the data we collect will be less important than the algorithms we use to analyze and process it. Even if an organization’s rules and policies expressly forbid using data to discriminate against people, the algorithms they use could be discriminating, either accidentally or
unintentionally.
“That’s why companies need to be responsible for looking at the algorithms they’re using and making sure the algorithms aren’t discriminating against individuals or groups of people,” says Roxana Geambasu, an assistant
professor of computer science at Columbia University whose research spans broad areas of computer systems, including distributed systems, security and privacy, operating systems, databases, and applications of cryptography and machine learning to systems.
“As human beings, we understand ... there are written rules in many
circumstances for not discriminating against certain populations on purpose,” says Geambasu. “But I’m not sure that too many companies are actually analyzing the impact of their algorithms on their user populations. It’s a huge responsibility and I don’t think companies are taking it seriously.”
Seeking the Goldilocks Zone for Data
When you consider that many of today’s products are built from data and that it’s relatively inexpensive to store data, it seems wasteful to just throw it away. That said, it’s hard to tell how much data is too much, and how much is too little. You can’t operate software without data — it would be like trying to drive a car with no gasoline in the tank.
“Everyone collects data and everyone stores data,” says Peter Skomoroch, a San Francisco-based entrepreneur and former principal data scientist at
LinkedIn. “Just because you don’t know exactly how you’re going to use data doesn’t mean you should delete it. That’s a bad idea. It slows down the
development of new or better products that would benefit users.”
Skomoroch believes that companies “are being shortsighted” when they discard data that doesn’t seem immediately useful. For example, some
companies have arbitrary rules about how long they keep emails. In a system that’s used mostly for transactions, it probably makes sense to automatically delete emails after a certain period of time.
But those same emails might contain information that could be mined to reveal customer preferences or uncover reliability issues with products.
Deleting the emails would effectively destroy valuable information that could be used to help the company improve its offerings.
The lesson here is that since it’s often hard to determine which data will prove valuable, it doesn’t make sense to toss it in the garbage because it has no immediate use or because it might overload a particular system.
“That’s the rationale for hiring a chief data officer,” says Skomoroch. “Then you have one person who is clearly responsible for making good decisions about managing data across the enterprise.”
Chief data officers oversee data management issues and resolve difficult questions such as:
Which data needs the most protection and which needs the least?
Which data is most valuable to the company today?
Which data will be most valuable in the future?
The chief data officer would also weigh in on a basic question that every company should ask before deciding whether to keep or delete data: is this decision in the best interests of our customers?
“That should be the guiding light,” says Skomoroch. “If you determine
Consider How the Data Will Be Used
But who determines the “intrinsic value” of data? Most companies don’t have chief data officers. Most companies don’t have formal rules for categorizing data. Unless they compete in tightly regulated industries such as healthcare and financial services, most companies have weak or immature policies for dealing with data.
“Lots of companies just dive in without thinking it through,” says Q Ethan McCallum, a data strategy consultant. “Many companies don’t really know what kinds of data they have; nor do they know what they can do with data. From the standpoint of data strategy, they are immature. They’re more likely to gather data ‘just in case,’ lump their data into one big pile, and sort through it later. But that means they might be holding on to data that could harm
them, or missing out on potentially useful data they could have collected if they’d made a plan upfront.”
As a result, those companies find it challenging to create policies and practices for organizing data. That, in turn, makes it difficult for them to manage data effectively and make use of its potential business value. In
Business Models for the Data Economy (O’Reilly, 2013), McCallum and coauthor Ken Gleason offer seven core strategies for monetizing data: Collect/Supply
Gather and sell raw data Store/Host
Hold onto someone else’s data for them Filter/Refine
Strip out problematic records or data fields or release interesting data subsets
Enhance/Enrich
Simplify Access
Help people cherry-pick the data they want in the format they prefer Obscure
Inhibit people from seeing or collecting certain information Consult/Advise
Provide guidance on others’ data efforts
The authors’ basic premise is that once you have an idea of how you will be using your data, it will be easier to organize and manage it. It’s hard to argue with their logic, and the list provides a good starting point for getting a
handle on your data.
Figure 1-1.
Knowing Which Data Needs the Most
Protection
Many large companies now employ a chief information security officer (CISO) to manage data risks and oversee data security. One of the first
questions every CISO needs to ask is: which data needs the most protection? The CISO also needs to know the business value of the company’s data. The value of data depends on many variables, including accuracy, age, and
source. If the data is related to a secret formula that creates an important competitive advantage for the company, it will have more value than data that’s related to the company’s organization chart. Knowing the value of data allows the CISO to allocate the appropriate level of protection.
The C-I-A Method
It’s common for CISOs to employ the C-I-A method for managing data risk. In this instance, C-I-A stands for confidentiality, integrity, and availability. Here are quick explanations of each:
Confidentiality
The degree of secrecy required for the data. A list of your customers’ zip codes, for example, would be considered less confidential than a list of their Social Security numbers.
Integrity
The degree of consistency and accuracy of the data. Your company’s sales data, for example, needs to be accurate so the sales execs know precisely how many more deals they need to close to meet their goals. Availability
The level of uptime or reliability required for systems or applications that are storing or processing the data. If the data is critical to the business, its level of availability needs to be high. For example, if the data is required for your ecommerce site, downtime would result in lost sales revenue.
The C-I-A method makes assessing risk and weighing value relatively easy. The first step is setting up a 3×2 risk profile matrix, like this:
Confidentiality Integrity Availability
Then you assign values on a scale of three to one (three being the highest and one being the lowest) to the second row under each column. For example, the matrix for your company’s financial data (which requires high
confidentiality, high integrity, and high availability) looks like this:
3 3 3
The matrix for planning and budget forecast data (which requires high confidentiality, medium integrity, and low availability) looks like this:
Confidentiality Integrity Availability
3 2 1
The matrix for operating data (which requires low confidentiality but high integrity and availability) would probably look like this:
Confidentiality Integrity Availability
1 3 3
Let’s look at another example: data for your external website must be readily available, but since much of it is already public, confidentiality isn’t a
priority. On the other hand, a lot of the data will change from moment to moment. So the C-I-A matrix for your external website will probably look like this:
Confidentiality Integrity Availability
1 2 3
Since your ERP (enterprise resource management) system requires the highest levels of confidentiality, integrity, and availability, its matrix will look like this:
Confidentiality Integrity Availability
What’s the Downside?
Setting up the C-I-A matrices and assigning values to the three attributes is Step 1. Step 2 is calculating the downside/risk — in other words, how much will it cost if the data is lost or compromised?
Let’s look at the example of the external website. We rated the need for
availability at 3, the highest level, because we don’t want the site going down when customers are trying to use it. But now we need to ask ourselves two more questions:
1. What are the odds that the site will crash?
2. If the site crashes, what’s the impact on the company?
If the website generates $100 million in business for your company and it costs $500,000 to back it up, then the answer is easy: spend the money to back up the system.
But if the risk of a crash is very low and the website generates only a small portion of your company’s annual sales revenue, then maybe it makes more sense to invest your money in something else.
Here’s a mathematical way of reaching the same decision: multiply the dollar value at risk by the probability of something bad happening.
For the website, the value at risk is $100 million and the risk of a crash is probably in the neighborhood of .5 percent. Here’s the math: 100 million × .005 = $500,000.
Is it worth spending $500,000 to insure the company against a potential loss of $100 million? We would say yes, but with a qualification. Even if the site crashes, the likelihood of it remaining down for more than a few hours is very low. So you need to really drill down into the sales data and see how much money the website generates on an hourly basis, and during which hours of the day.
Risk versus Rewards
Toby J.F. Bishop is an independent anti-fraud strategy advisor and former director of the Deloitte Forensic Center. He is coauthor of Corporate Resiliency: Managing the Growing Risk of Fraud and Corruption (Wiley, 2009) and a related article, “Mapping Your Fraud Risks”, which appeared in Harvard Business Review.
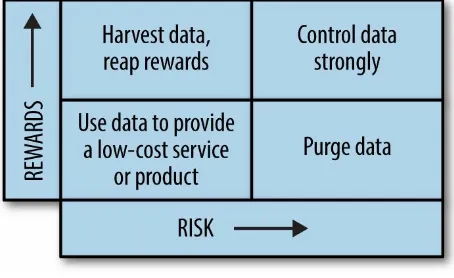
Bishop is a forensic accountant, not a data scientist, but he sees lessons from his anti-fraud work that can be applied to managing risk associated with data. One way for visualizing the risk/reward tradeoffs of data, he suggests, would be mapping it on a quadrant grid, as in this diagram:
Figure 1-2.
quadrant (low rewards, high risk).
For data in the upper-right quadrant (high reward, high risk), you would probably want to explore adding strong controls to mitigate or reduce risk. And for data in the lower-left quadrant (low reward, low risk), you might explore ways of improving profitability or reducing costs, which would nudge the value of the data closer to the top-left quadrant.
Imagine, for example, a large financial services firm with thousands of
dormant credit accounts. From a risk perspective, it makes sense for the firm to close down the accounts and delete the customer data associated with them, since they are easy targets for fraudsters who obtain information from call center employees with access to the account data.
But historically, a certain number of those accounts are reactivated by their legitimate holders, and the reactivated accounts generate profits for the firm. “The accounts are highly vulnerable to fraud, but you want to hang onto them because they also represent potential sources of profit,” says Bishop.
Rather than closing the accounts and deleting the customer data, the firm could set up a special group to handle the dormant accounts. Access to data about the dormant accounts would be limited to members of the special group, reducing the risk of identity theft or other misuse of the data by call center employees.
“In the event that a customer decides to reopen his or her account, the call would be transferred to the special group and they would handle the
reactivation,” says Bishop. “The business objective — preserving both the customer relationship and the potential for additional profit — has been achieved.”
From a risk/reward perspective, the customer data has been shifted from the lower-right quadrant to the lower-left quadrant. The firm’s decision makers can tell at a glance that the dormant account data poses a low risk. Although the potential rewards are moderate, they would be considered worthwhile since the level of risk has been lowered.
shipping documents for decades. In some cases, those documents were used by the US Environmental Protection Agency to identify companies as
“Potentially Responsible Parties” (PRPs) with substantial liability for
Superfund cleanup costs. In hindsight, it would have made more sense — and been perfectly legal — for the companies to have discarded the data after a certain period of time.
Data Is Not a Commodity
Several years ago, industry analysts compared big data to oil. Like oil, big data would fuel an economic revolution and transform the world. In
retrospect, it seems clear that treating data as some kind of commodity is misguided and dangerous. Data isn’t oil — it’s us. It’s our lives, our
About the Authors
Greg Fell is a general partner in The Investors Collaborative, a Boston-based venture capital group. He is the former chief strategy officer at Crisply, an enterprise SaaS company that pioneered the algorithmic quantification of work. Previously, he served as vice president and chief information officer of Terex Corp., a global manufacturer of industrial equipment.
Before joining Terex, Fell spent nearly 20 years with Ford Motor Company. He started as a developer, and worked his way through a variety of
management roles supporting the global Engineering and Manufacturing functions of the company. He has domain expertise on CAD/CAM/CAE systems, lean manufacturing, and control systems.
Fell is a graduate of Michigan State University, and spent several years on staff in the College of Engineering as a senior research programmer and instructor.
Fell is active in the CIO community. He is the former chairman of the Fairfield Westchester Society of Information Managers, a former board member with Junior Achievement, and has mentored high school students through the First Tee Program.
His book, Decoding the IT Value Problem (Wiley, 2013), is used widely by CIOs to calculate the economic value of IT projects.
Mike Barlow is an award-winning journalist, author, and communications strategy consultant. Since launching his own firm, Cumulus Partners, he has worked with various organizations in numerous industries.
Barlow is the author of Learning to Love Data Science (O’Reilly Media, 2015). He is the coauthor of The Executive’s Guide to Enterprise Social Media Strategy (Wiley, 2011), and Partnering with the CIO: The Future of IT Sales Seen Through the Eyes of Key Decision Makers (Wiley, 2007). He is also the writer of many articles, reports, and white papers on numerous topics such as collaborative social networking, cloud computing, IT infrastructure, predictive maintenance, data analytics, and data visualization.
Stamford Advocate. His feature stories and columns appeared regularly in The Los Angeles Times, Chicago Tribune, Miami Herald, Newsday, and other major US dailies. He has also written extensively for O’Reilly Media.
Not All Data Is Created Equal
What Your App Isn’t Telling You
Combining Data Can Be Risky Business
A Calculated Risk
Privacy Isn’t Dead; It’s on Life Support
Are Your Algorithms Prejudiced?
Seeking the Goldilocks Zone for Data
Consider How the Data Will Be Used
Knowing Which Data Needs the Most Protection
The C-I-A Method
What’s the Downside?
Risk versus Rewards