Refer to Important disclosures in the last page of this report
Stock DataTarget price (Rp) Rp2,700
Prior TP (Rp) Rp2,700
Shareprice (Rp) Rp2,490
Upside/downside (%) +8.4
Sharesoutstanding (m) 22,359
Marketcap. (US$ m) 3,757
PT Unita Branindo 32.9%
Mayora Dhana Utama 26.1%
Jogi Hendra Atmadja 25.2%
Estimate Change; Vs. Consensus 2018F 2019F PT Indo Premier Sekuritas [email protected] +62 21 5793 1169
Road to recovery
Improvement in 3Q18, although slightly below expectation.
Signs of domestic demand recovery.
Margin pressure still remained, due to high opex growth.
Upgrade rating to HOLD with TP of Rp2,700.
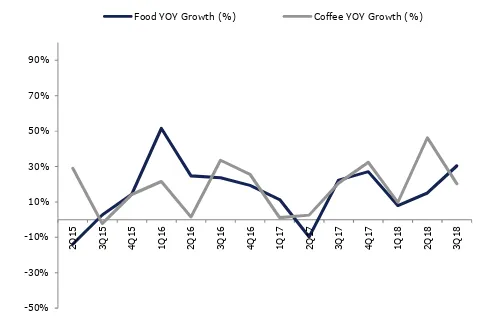
Improvement in 3Q18, but still falls short of expectation. MYOR recorded net earnings of Rp373bn in 3Q18 (-4% yoy; +33% qoq) and Rp1.1tn in 9M18 (+19% yoy), forming 75% of ours but only 63% of consensus estimate. This is partly contributed to the strengthening of the USD and minimal increase in raw material prices, causing forex gain to spike in 3Q18. Meanwhile, net sales recorded Rp6.5tn in 3Q18 (+33% yoy; +21% qoq) and Rp17.4tn cumulatively in 9M18 (+21% yoy), forming 74% and 73% of ours and consensus respectively. Growth in 3Q18 was mainly driven by food processing growing by +34% qoq (+30% yoy), contributing to 55% of sales (vs. 2Q18: 44%). Despite falling slightly below expectation, we think that the company is on the right track to recovery.
Signs of pick up in domestic demand. After a decline in domestic sales in 2Q18 (-7.3% qoq), a significant recovery was seen in 3Q18, booking Rp3.6tn or a +24%qoq/+34%yoy growth. This considerable recovery can be attributed to increase in sales volume, as the company has not increased their ASP this year. Export sales also remained strong in 3Q18, booking Rp3tn or growing +18%qoq/+32%yoy, making up around 46% of total sales. We believe that the company still has more upside potential, as they have not increased their ASP coupled with the recovery in domestic sales. The management has also hinted at a 2%-3% increase in ASP in 2019.
Margin pressure still remained. In 3Q18 opex growth remained high, growing at +113%yoy/+24%qoq to Rp1.2tn (vs. 2Q18: Rp993bn; 3Q17: Rp580bn), still driven by high A&P spending. A&P expense still grew at an unusually inflated rate of +164%yoy/+22%qoq in 3Q18 (vs. 2Q18: 121% yoy; 3Q17: +81% yoy), making up around 14.7% of net sales for the quarter. This has pressured the company’s EBIT margin to stagnate at 7.4% in 3Q18 (vs. 2Q18: 7.4%; 3Q17: 11.1%). However, NPM still managed to expand slightly to 5.7% (+60bps qoq), on the back of higher forex gain in 3Q18 (+137% qoq). Management has also guided for a considerably lower A&P spending in 4Q18, easing the pressure on EBIT margin going forward.
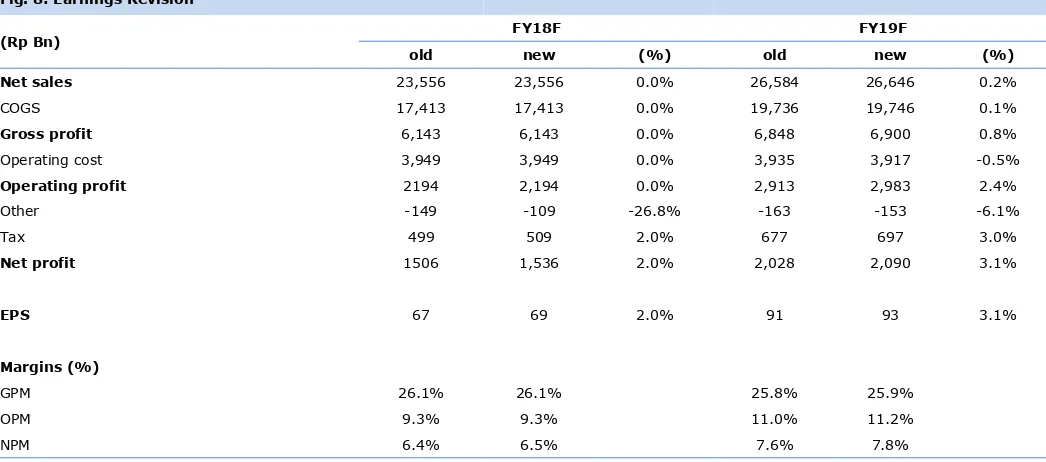
Valuation. We slightly improve our FY19F revenue forecast on the back of expected ASP increase next year. We also raise our net earnings forecast by 2.0%/3.1% following the higher than expected forex gain caused by strengthening of USD. We are more optimistic on MYOR going forward, on the back of domestic demand improvement and benefit of stronger USD. We roll over our valuation to FY19F and upgrading our call to HOLD with a TP of Rp2,700 (based on target P/E of 29x). We transfer coverage from Putri Tobing to Elbert Setiadharma.
Mayora Indah
(
MYOR IJ
)
13 November 2018
Company Update
HOLD
(From Sell)
Year To 31 Dec 2016A 2017A 2018F 2019F 2020F
Source : MYOR, IndoPremier Share Price Closing as of : 12-November-2018
2
Refer to Important disclosures in the last page of this report
Fig. 1: Sales and segmental growth forecast Fig. 2: Quarterly segmental sales growth trend
10,511
2012 2013 2014 2015 2016 2017 2018F 2019F
Sales (Rp Bn; LHS)
Food Processing YOY Growth (%; RHS)
Coffee YOY Growth (%; RHS) -50%
-30%
Food YOY Growth (%) Coffee YOY Growth (%)
Source: Company, IndoPremier Source: Company, IndoPremier
Fig. 3: 3Q18 sales breakdown Fig. 4: Quarterly advertising & promotion expense trend
Domestic Sales
A&P Expense (Rp Bln; LHS) A&P-as-percentages-of-sales (%; RHS)
Source: Company, IndoPremier Source: Company, IndoPremier
Fig. 5: MYOR EBIT forecast Fig. 6: Earnings and ROE forecast
1,157
2012 2013 2014 2015 2016 2017 2018F 2019F
EBIT (Rp Bn; LHS) EBIT Margin (%; RHS)
730
2012 2013 2014 2015 2016 2017 2018F 2019F
Earnings (Rp Bn; LHS) ROE (%; RHS)
3
Refer to Important disclosures in the last page of this report
Fig. 7: 9M18 result summary(IDR Bn) 3Q17 2Q18 3Q18 % QoQ % YoY 9M17 9M18 % YoY vs. cons vs. ours
Source: Company, IndoPremier
Fig. 8: Earnings Revision
4
Refer to Important disclosures in the last page of this report
Year To 31 Dec (RpBn) 2016A 2017A 2018F 2019F 2020F
Cash & Equivalent 1,543 2,202 2,623 2,400 2,428
Receivable 4,364 5,744 5,808 6,205 6,981
Inventory 2,124 1,825 2,624 2,975 3,347
Other Current Assets 709 903 695 786 885
Total Current Assets 8,740 10,674 11,750 12,367 13,640
Fixed Assets - Net 3,859 3,989 4,240 4,466 4,669
Goodwill 0 0 0 0 0
Non Current Assets 323 253 400 400 400
Total Assets 12,922 14,916 16,390 17,233 18,710
ST Loans 1,284 1,634 2,684 2,534 1,860
Payable 1,330 1,717 0 1,515 1,704
Other Payables 553 528 310 343 384
Current Portion of LT Loans 718 594 1,004 240 240
Total Current Liab. 3,884 4,474 5,429 4,632 4,188
Long Term Loans 2,074 2,226 1,642 1,610 1,610
Other LT Liab. 699 862 862 862 862
Total Liabilities 6,657 7,562 7,933 7,104 6,660
Equity 446 442 448 448 448
Retained Earnings 5,675 6,744 7,821 9,468 11,368
Minority Interest 144 168 189 213 234
Total SHE + Minority Int. 6,265 7,354 8,457 10,129 12,050
Total Liabilities & Equity 12,922 14,916 16,390 17,233 18,710
5
Refer to Important disclosures in the last page of this report
Year to 31 Dec 2016A 2017A 2018F 2019F 2020F
Cash Flow
Net Income (Excl.Extraordinary&Min.Int) 1,355 1,594 1,536 2,090 2,501
Depr. & Amortization 506 500 399 424 447
Changes in Working Capital (1,333) (578) (1,518) (723) (1,015)
Others 365 337 25 722 297
Cash Flow From Operating 928 1,889 482 2,555 2,276
Capital Expenditure (801) (559) (797) (650) (650)
Others 15 36 50 40 40
Cash Flow From Investing (786) (522) (747) (610) (610)
Loans 267 378 875 (945) (674)
Equity 0 0 0 0 0
Dividends (275) (481) (478) (461) (627)
Others (165) (203) (383) (380) (315)
Cash Flow From Financing (173) (306) 14 (1,786) (1,616)
Changes in Cash (31) 1,062 (251) 160 49
Financial Ratios
Gross Margin (%) 26.7 23.9 26.1 25.9 25.9
Operating Margin (%) 12.6 11.8 9.3 11.2 11.6
Pre-Tax Margin (%) 10.1 10.5 8.9 10.6 11.3
Net Margin (%) 7.4 7.7 6.5 7.8 8.3
ROA (%) 11.2 11.5 9.8 12.4 13.9
ROE (%) 23.6 23.4 19.4 22.5 22.6
ROIC (%) 14.4 14.9 12.6 15.3 17.0
Acct. Receivables TO (days) 76.9 88.6 89.5 82.3 80.3
Acct. Receivables - Other TO (days) 0.0 0.0 0.0 0.0 0.0
Inventory TO (days) 6.9 8.0 7.8 7.1 7.0
Payable TO (days) 31.9 35.1 33.0 27.2 26.4
Acct. Payables - Other TO (days) 7.7 5.3 5.2 4.9 5.0
Debt to Equity (%) 65.1 60.6 63.0 43.3 30.8
Interest Coverage Ratio (x) 0.2 0.2 0.2 0.1 0.1
Net Gearing (%) 40.4 30.6 32.0 19.6 10.6
Head Office
PT INDO PREMIER SEKURITAS
Wisma GKBI 7/F Suite 718
Jl. Jend. Sudirman No.28
Jakarta 10210 - Indonesia
p +62.21.5793.1168
f +62.21.5793.1167
INVESTMENT RATINGS
BUY : Expected total return of 10% or more within a 12-month period HOLD : Expected total return between -10% and 10% within a 12-month period SELL : Expected total return of -10% or worse within a 12-month period ANALYSTS CERTIFICATION.
The views expressed in this research report accurately reflect the analysts personal views about any and all of the subject securities or issuers; and no part of the research analyst's compensation was, is, or will be, directly or indirectly, related to the specific recommendations or views expressed in the report.
DISCLAIMERS