www.elsevier.nlrlocaterjappgeo
Seismic reflection constraints on the glacial dynamics of Johnsons
Glacier, Antarctica
Beatriz Benjumea
a,), Teresa Teixido
´
b aInstituto Andaluz de Geofısica, Campus Uni´ Õersitario de Cartuja srn, 18071 Granada, Spain
b
Institut Cartografic de Catalunya, Parc de Montjuıc, 08038 Barcelona, Spain` ¨
Received 3 December 1999; accepted 9 October 2000
Abstract
Ž .
During two Antarctic summers 1996–1997 and 1997–1998 , five seismic refraction and two reflection profiles were
Ž .
acquired on the Johnsons Glacier Livingston Island, Antarctica in order to obtain information about the structure of the ice, characteristics of the ice-bed contact and basement topography. An innovative technique has been used for the acquisition of reflection data to optimise the field survey schedule. Different shallow seismic sources were used during each field season:
Ž . Ž .
Seismic Impulse Source System SISSY for the first field survey and low-energy explosives pyrotechnic noisemakers during the second one. A comparison between these two shallow seismic sources has been performed, showing that the use of the explosives is a better seismic source in this ice environment. This is one of the first studies where this type of source
Ž .
has been used. The analysis of seismic data corresponding to one of the reflection profiles L3 allows us to delineate sectors
Ž .
with different glacier structure accumulation and ablation zones without using glaciological data. Moreover, vertical discontinuities were detected by the presence of back-scattered energy and the abrupt change in frequency content of first arrivals shown in shot records. After the raw data analysis, standard processing led us to a clear seismic image of the underlying bed topography, which can be correlated with the ice flow velocity anomalies. The information obtained from seismic data on the internal structure of the glacier, location of fracture zones and the topography of the ice-bed interface constrains the glacial dynamics of Johnsons Glacier.q2001 Elsevier Science B.V. All rights reserved.
Keywords: Seismic interpretation; Seismic sources; Glacier environment; Near-surface seismic; Glacier structure
1. Introduction
The dynamics and evolution of glaciers strongly depend on the bed topography, the conditions of the ice–rock contact and the internal structure of the ice itself. Ice flow is dominated by gravity and the
)Corresponding author. Tel.: q34-958243557; fax: q 34-958160907.
Ž .
E-mail address: [email protected] B. Benjumea .
Ž .
friction at the bed and sides Whillans, 1987 . There are different models to explain the role played by
Ž
ice-bed contact in the ice motion Nolan and
.
Echelmeyer, 1999 : hard-bed models, formed by rock or impermeable non-deforming sediments, and soft-bed models, which are characterised by deformable
Ž .
subglacial sediment called till Patterson, 1994 . The problem of obtaining the glacier character-istics can be addressed using several geophysical methods. The most widely used are radar and
seis-0926-9851r01r$ - see front matterq2001 Elsevier Science B.V. All rights reserved.
Ž .
( ) B. Benjumea, T. Teixido´rJournal of Applied Geophysics 46 2001 31–44
32
mic methods. The first studies on the Antarctic continent were seismic reflection and refraction
sur-Ž .
veys performed in 1949–1952 Robin, 1958 . Other targets have been ice shelves surrounding the
conti-Ž
nent, such as the Ross Ice Shelf Beaudoin et al.,
. Ž
1992 or the Larsen Ice Shelf Jarvis and King,
.
1995 . These early studies did not address the ice itself but the effect of the ice layer on the wavefield. Other seismic surveys were designed to investigate
Ž
conditions at the ice-bed interface Nolan and
.
Echelmeyer, 1999 , the nature of sub-ice material
ŽBentley and Clough, 1972 , and whether or not bed.
Ž
deformation is occurring Blankenship et al., 1986; .
Smith, 1997 .
Radar surveys have also been successfully carried out to get better knowledge of the stratification and
Ž
thickness of ice in polar regions Dahl-Jensen et al., .
1997 , but in temperate glaciers the scattering effect of thin layers of water makes the radar technique less
Ž
useful Smith and Evans, 1972; Nicollin and Kof-.
man, 1994 . In such cases, the reflection seismic method provides an optimum way of obtaining the bed topography of the glaciers. Although these stud-ies are not very common, a good example can be found in the study of the Lobbia glacier in the Alps ŽLevato et al., 1999 ..
The present work is a contribution to seismic investigation on glacier ice. During the 1996–1997
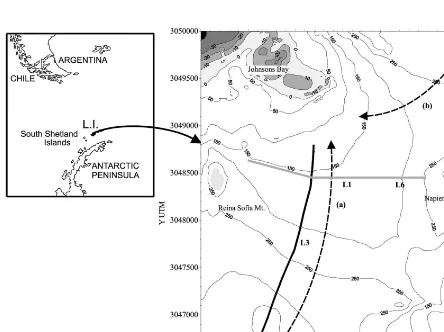
Ž .
Fig. 1. Location of Livingston Island South Shetland Islands, Antarctica and map of Johnsons Glacier showing the location of the seismic
Ž . Ž .
reflection L3 presented in this paper. The location of two refraction profiles L1, L6 from which two shot gathers were chosen for the
Ž . Ž . Ž .
and 1997–1998 field seasons, reflection and refrac-Ž
tion seismic surveys were undertaken Benjumea,
.
1999 . These data constrain the ice thickness and provide an image of the ice-bed contact in the
John-Ž .
sons Glacier Livingston Island, Antarctica . For the acquisition two different shallow seismic sources were used; this paper includes a comparison of the data recorded in order to establish which is the optimum source in ice environments. A seismic re-flection profile, which follows one of the main ice
Ž .
flows, is analysed developing i an analysis of the raw shot gathers and its contribution to the final
Ž .
interpretation, ii a discussion of the processing
steps in order to obtain a good quality final stack, Ž .
and iii a presentation of a structural interpretation combining the seismic reflection and glaciological data of the structure and flow parameters of John-sons Glacier.
2. Glacial setting
Johnsons Glacier is located in the south of
Liv-Ž . X
ingston Island, Antarctica Fig. 1 , at 62840 S,
Ž . Ž .
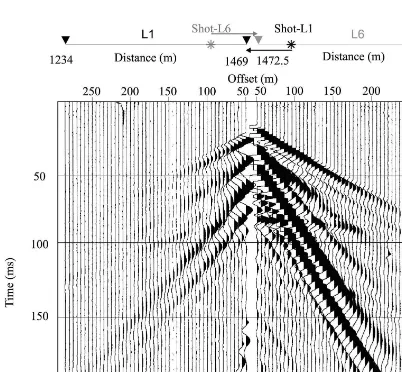
Fig. 2. Comparison of seismic data generated by SISSY for line L1 left and low-energy explosives right for line L6. Data sets were acquired in two adjacent profiles with a nearest offset of 50 m. The amplitude for each trace is divided by the mean absolute value of all
Ž .
( ) B. Benjumea, T. Teixido´rJournal of Applied Geophysics 46 2001 31–44
34
60830XW. The basement consists of sandstones
ŽJohnsons Bay side, WNW and contact metamor-.
Ž .
phic rocks Smellie et al., 1995 .
Johnsons Glacier results from the confluence of two glacial flow lines: the Dorotea and Johnsons
Ž .
lines Fig. 1 . The Dorotea line, which flows north-ward, is 2150 m long and has an average slope of
about 68. The Johnsons line is 980 m long. It flows
Ž .
south-westward and is steeper around 108. The
flow lines converge on a non-grounded, 50-m high ice cliff, and the maximum elevations are 330 and 270 m for Dorotea and Johnsons, respectively. An-nual horizontal velocities increase downstream with
minimum values of about 1 may1
near the ice
divides and maximum values of 40 may1 near the
Ž .
ice terminus Ximenis, personal communication .
Due to the two convergent flows, the ice is folded and highly fractured in a perpendicular direction to
Ž .
the flows Calvet and Santanach, 1992 .
Johnsons Glacier is a temperate ice mass. This type of glacier is characterised by a complex mate-rial consisting of ice, water, air, salts and carbon
Ž .
dioxide Paterson, 1994 . Temperate glaciers feature two distinct zones: the accumulation zone
charac-Ž
terised by the presence of snow, firn intermediate .
stage between snow and ice and ice, and the abla-tion zone where there is only ice covered by the seasonal snow layer.
The different orientations of the ice flows relative Ž
to the prevailing NE wind direction Villaplana and .
Pallas, 1993 result in a larger accumulation of snow
`
in the Johnsons flow line than in the Dorotea one.
Ž .
The equilibrium line altitude ELA , that separates accumulation and ablation zones, is situated at differ-ent levels: around 250 m for the Dorotea flow and
Ž
150 m for the Johnsons line Ximenis, personal
.
communication . The measured ice density is
ap-proximately 0.8 grcm3, less than that calculated for
Ž
Antarctic continental ice or for ice shelf Furdada et .
al., in press .
3. Data acquisition
Ž .
Five seismic refraction 2685 m total length and
Ž .
two reflection profiles 2980 m total length were Ž
carried out during two field seasons 1996–1997 and .
1997–1998 . We present in this paper the analysis of
one of the reflection profiles. For the acquisition of this profile, single vertical 40 Hz geophone stations were deployed and a 48-channel digital seismograph
ŽBISON 9048 was used. This seismograph uses a.
16-bit ArD converter with a digital instantaneous
Ž .
floating point DIFP amplifier, which increases the dynamic range to 126 dB. The acquisition parame-ters were as follows: a sample rate of 0.1 ms, a 32-Hz analogue two pole Butterworth low-cut filter, a 4000-Hz analogue six-pole Butterworth high-cut filter. The record length was 500 ms. The acquisition was performed with only 24 geophones at 5-m spac-ing due to logistics. The shot interval was 10 m giving 6-fold data. The shots were located in front of the seismic line with a nearest offset of 30 m. This offset was chosen by taking into account the time window between the first arrivals and ground-roll. The recording cable was attached to a climbing rope and dragged, without excessive tensile stress, from shotpoint to shotpoint. Before each shot, the geo-phones were planted in the snow. This scheme pro-vided a good acquisition rate allowing the field survey to be achieved in a short period of time.
4. Seismic sources
Two different seismic sources were used for data
Ž .
acquisition; Seismic Impulse Source System SISSY ,
Ž .
distributed by Dynamit Nobel Troisdorf, Germany ,
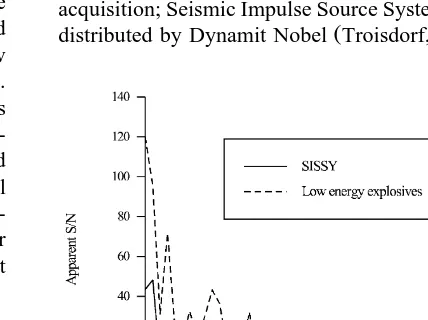
Fig. 4. Comparison of the logarithm of power spectrum of the two adjacent shot gathers shown in Fig. 2. Note the higher frequency content for low-energy explosives, especially between 150 and 300 Hz.
during the first field season, and low-energy
explo-Ž .
sives pyrotechnic noisemakers during the second
one. The refraction profile L1 was acquired using the SISSY source whereas the explosive was used as the seismic source for the rest of the profiles. The char-acteristics of SISSY are similar to the seismic gun
ŽPullan and MacAulay, 1987 , the main difference is.
that the former usesADynergitBcartridges, which are
detonated electronically. This type of source has been used successfully in sedimentary environments
ŽWiederhold et al., 1998 . To increase the source.
coupling, the SISSY was placed in the snow layer to a maximum depth of 0.6 m. The main component of the low-energy explosives used during the 1997– 1998 field season was perclorite. The explosives were buried in the snow, at the depth of the refreeze
Ž .
snow layer 0.5–2 m , where the source-media cou-pling is expected to be good. As far as we know, this is the first study to use this type of low-energy explosives as a seismic source.
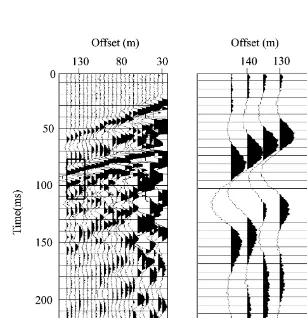
We used two shot records from adjacent geo-phone spreads to compare the two seismic sources
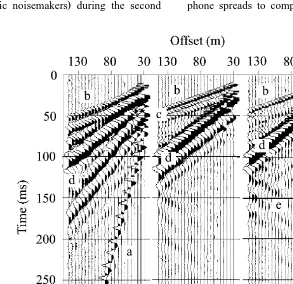
Ž . Ž . Ž . Ž . Ž .
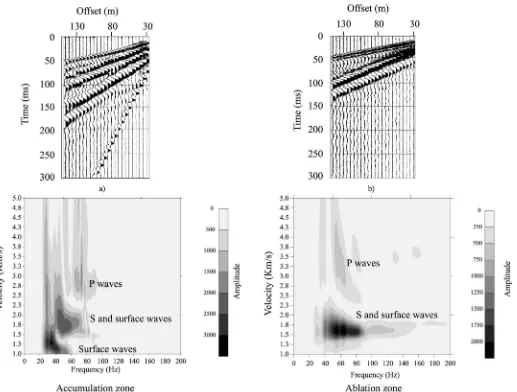
Fig. 5. Seismic data line L3 acquired on accumulation left and ablation zone central and right . The main arrivals are: a air wave, b
Ž . Ž . Ž . Ž .
critically refracted waves from ice, c reverberations of b , d shear and surface waves, e back-scattered energy of shear and surface Ž .
()
B.
Benjumea,
T.
Teixido
r
Journal
of
Applied
Geophysics
46
2001
31
–
44
´
36
Ž . Ž . Ž . Ž .
ŽFig. 2 , one corresponding to SISSY L1 and the. Ž .
Ž .
other one to explosives L6 . These two shot gathers represent the different characteristics observed in the
1996r1997 and 1997r1998 data sets. Data were
acquired in different field seasons but the homoge-neous character of this zone allows this comparison. In this zone, there is a lack of crevasses because it is not influenced by the flow convergence. The
thick-Ž .
ness of the surface snow layer between 0.5 and 1 m as well as the characteristics of snow density, wet-ness and temperature history are factors that can considerably affect the signal character. The differ-ences in these properties from one to other field season are not considerable. Therefore, it is reason-able to assume that the differences in energy and frequency content between these two shot gathers are mainly due to the character of seismic source and its coupling with the media.
Ž .
Following Staples et al. 1999 , we have made a quantitative analysis of the variation of signal-to-noise ratio with offset for these two seismic sources.
The apparent signal-to-noise ratio is given by the equation:
ARM St0q20 ms
t 0
QSrNs
Ž .
1t
rRM S0
t0y14 ms
where ARM S is the RMS amplitude measured in 20
ms beginning at the first break, rRM S is the RMS
noise measured in a 14-ms window preceding the
first break, and t is the first break time. A typical0
wavelet length constrained the size for the window including the first arrival, whereas the noise window is established to include all the samples before first arrivals in the trace corresponding to the nearest geophone.
The QSrN of SISSY is lower than that of the
low-energy explosive data for the entire offset range
ŽFig. 3 . For example, for offsets larger than 190 m,.
the signal-to-noise ratio for the first arrivals gener-ated by the SISSY is close to 1, and this makes the first break picking difficult. For the other source, the
Ž . Ž .
( ) B. Benjumea, T. Teixido´rJournal of Applied Geophysics 46 2001 31–44
38
signal-to-noise ratio is above 1 for offsets up to 300 m.
The frequency content of the recorded signal is another key factor that needs to be considered when comparing different types of sources. SISSY presents a strong amplitude decay above approximately 150 Hz, whereas, the low-energy explosives feature higher values especially between 150 and 300 Hz
ŽFig. 4 . The signal generated by the low-energy.
explosives has higher resolution than the signal gen-erated by the SISSY. Furthermore, the ejection of the source during the explosion made field operations awkward and dangerous. Explosives, instead, al-lowed a faster shooting rate. Although SISSY has been used successfully in other geologic settings, this comparison indicates that low-energy explosives are a better source in glacier environments. These facts
encouraged us to use only explosives for the second field survey.
5. Data analysis
The analysis of the raw data from a seismic reflection profile is carried out with the aim of locating anomalies within the ice and delimiting different areas of the glacier. The shot gathers along the reflection line L3 show a strong variability be-cause of the high degree of heterogeneity of John-sons Glacier. Nevertheless, the signal displays
simi-Ž .
lar patterns in all the shot gathers Fig. 5 . The main features are described below.
The shallow depth of shot positions produce a
Ž .
strong air wave in some shot gathers Fig. 5a . The
Ž . Ž . Ž .
first arrivals corresponding to critically refracted
Ž .
waves Fig. 5b from the ice surface show apparent
velocities of approximately 3000–3500 mrs, with
some anomalous zones of 3800 mrs. In some shot
gathers, these signals show a reverberation character
ŽFig. 5c which is likely due to the velocity gradient.
Ž .
in the snow layer Crary, 1963 .
High amplitude and spatially aliased surface waves are seen on all shot gathers preceded by an S-wave
Ž .
arrival Fig. 5d . These waves show different seismic signatures depending on the glacier area where the data were acquired. In the ablation zone, a wavetrain composed of S and surface waves is observed with
Ž
velocities corresponding to ice 1800 mrs for
S-.
wave . The surface waves are dispersive in the accu-mulation zone in marked contrast to their character in the ablation zone. The distinct signal character-istics result from the different internal structure and variability of the thickness of the layer covering ice.
In the accumulation zone, this shallow layer,
com-Ž .
posed of snow and firn, is thick enough )10m to
provide a propagation channel for surface waves. In the ablation zone, the thickness of the snow layer is much smaller than the characteristic wavelength of the surface waves and therefore the surface waves travel with a velocity characteristic of the ice. Two shot gathers from both zones were transformed into
Ž .
the phase velocity–frequency domain Fig. 6 . More complexity can be observed in the accumulation zone where two peaks corresponding to two wave-trains can be identified. The lower velocity arrival is the dispersion of the surface wave caused by a shear
Ž .
wave velocity variation with depth snow-firn layer . The wavetrain with higher velocity is the S wave and the surface waves, which travel along the ice with a high frequency content limited to 70 Hz. On the other hand, the S and surface waves acquired in the ablation area show a high energy content in the
( ) B. Benjumea, T. Teixido´rJournal of Applied Geophysics 46 2001 31–44
40
range 32–90 Hz, which indicates lower attenuation of seismic energy than in the accumulation zone. The non-dispersive character of the surface waves in the ablation zone is interpreted to indicate little variation with depth of the shear wave velocity in the near surface.
Vertical discontinuities in ice cause backscattered
Ž .
energy from shear and surface waves Fig. 5e and variations in the lateral continuity of events, for example, delay in arrivals of refracted waves and abrupt change in frequency content of these signals
ŽFig. 7 . These wavefield effects were used to iden-.
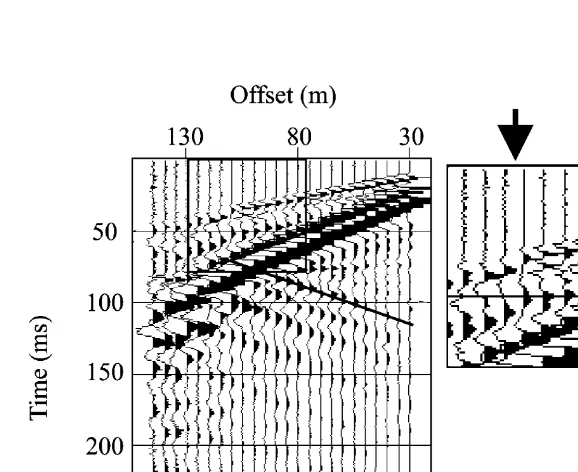
tify the surface location of these vertical fractures. In some places, between the first arrivals and the surface waves, a complex hyperbolic reflection can
Ž .
be observed Fig. 8 . The comparison of this event with the first arrival character, as an estimate of the effective source wavelet, shows that the reflection is not a simple one. The limited depth of the shots indicates that the second hyperbolic event that forms this arrival, is not a ghost of the first one. For example, for a shot depth of 2 m and a snow layer
Ž . Ž .
velocity of 1500 mrs, the ghost is expected at 2.6 ms, which is smaller than the travel time difference between both events. Thus, this complex event is likely to be the interference of reflections from a complex ice-bed.
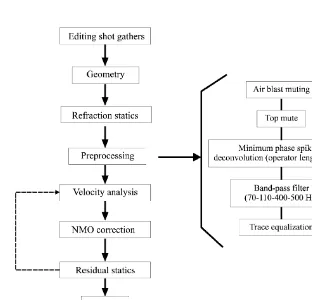
6. Data processing
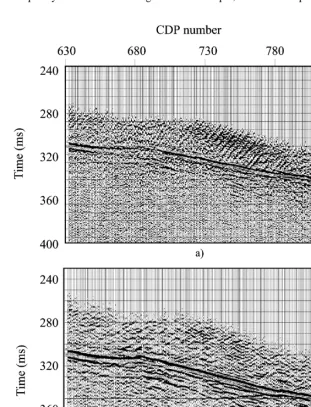
The seismic reflection data processing flow, sum-marised in Fig. 9, consists of standard steps designed to reveal the prominent reflection along the L3 pro-file. The main objective was to eliminate the high-amplitude surface waves, which interfere with the reflection. These surface waves are spatially aliased,
which makes 2-D pre-stack filtering useless. There-fore, a two step processing was carried out: first, a pre-stack band-pass filter was applied to attenuate the low frequency content and second, post-stack F–K filtering was used to eliminate the remaining noise due to the surface waves with a high frequency
Ž .
content around 90 Hz Fig. 10 .
7. Results and discussions
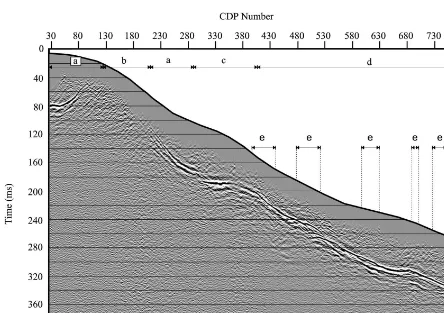
The final stacked section features a variable dou-ble event reflection, which could be identified in
Ž .
both the raw data Fig. 8 and the processed image
ŽFig. 11 . As discussed above, this double event is.
Ž .
Fig. 11. Stack section of L3 profile. The continuous line corresponds to surface topography. a Sectors where the shallow layer is thick
Ž . Ž .
enough to provide a low velocity channel for surface waves. b Sector where surface waves travel with a higher velocity. c Area with Ž .
surface waves of different character with a broad range of velocities. d Sector where surface and shear waves travel with velocity
Ž . Ž .
( ) B. Benjumea, T. Teixido´rJournal of Applied Geophysics 46 2001 31–44
42
considered to be the interference of two reflections from the top and the bottom of a thin layer located at the base of the glacier. A minimum thickness for this
layer can be calculated from the lr4 criterion
ŽSheriff and Geldart, 1995 . Considering a predomi-.
nant frequency of these events around 140 Hz, and a
range of velocities between 1400 and 2200 mrs
Ž .
corresponding to sub-ice material Smith, 1997 , we can estimate a range for the minimum thickness of this layer between 1 and 4 m. The 3-D bed topogra-phy effects cannot be ruled out as a cause for the complexity of the reflection wavelet. However, this explanation is not consistent with the results of a
Ž refraction profile perpendicular to the line L3
Be-.
njumea, 1999 showing slight lateral variation in the bed depth.
The lack of information in the first part of the
Ž .
seismic section Fig. 11 , between CDP 105 and 207, labelled b, is due to the lack of the near source–re-ceiver offsets required to resolve a shallow ice-bed reflector. The maximum ice thickness in this area can be interpolated from the basement morphology obtained for the rest of the profile. This area has the shallowest ice–rock contact along the studied
tran-sect. It is interesting to note that this zone of the bed is not directly below the highest part of the profile. This fact explains some of the glaciological data anomalies measured by means of markers in the ice
Ž .
since 1994 Ximenis, personal communication . The
Ž .
marker 1 Fig. 12 located at the beginning of the
Ž .
Dorotea flow highest part of the profile moves in a different direction than marker 3 due to this base-ment knoll. In addition, the high ice flow velocity
Ž .
measured at marker 3 Fig. 12 can be explained by the relatively thin ice thickness corresponding to this
Ž .
zone Ximenis, personal communication . The short
Ž .
arched events CDPs 430–580 in Fig. 11 that over-lap the strong ice–rock reflection indicate the exis-tence of heterogeneities at the base of the ice. Reflec-tions cannot be observed beneath the basement reflection due to the insufficient energy penetration and the high impedance at the ice–bedrock interface. Different sectors of crevasses, or vertical
disconti-Ž Ž . .
nuities panel e , Fig. 11 can be identified from the Ž back-scattered energy visible in the shot gathers Fig.
.
7 . Some of the discontinuities detected by the scat-tered energy from shear and surface waves cannot be observed from the surface due to the snow bridge
Ž .
Fig. 12. Sketch of the information provided by seismic section Fig. 11 . The zones of crevasses detected by reflected energy from surface
Ž .
over crevasses. Back-scattered energy could origi-nate from either open of closed-up crevasses, since both represent a horizontal change in the elastic parameters. On the other hand, there is a limitation in the detection of these crevasses by seismic prospecting depending on their size and orientation. Fig. 11 shows the zones characterised by differ-ences in the surface and shear wave character. Thus, the first part of the profile, CDP 29–126 and CDP
Ž .
210–291, a is characterised by surface waves trav-elling along a low velocity channel which is corre-lated to a snow-firn layer. The shallow bed inferred
Ž .
in the first sector of the profile b partially coincides
Ž .
with the thinning of this layer CDP 127–209 .
Ž .
Between CDP 291 and 405, sector c , the character of surface waves varies strongly. This area can be considered as the transition zone between the abla-tion and the accumulaabla-tion zones. In the second part
Ž .
of the line, CDP 405–829, sector d , surface waves feature a strong non-dispersive signal travelling at
1600 mrs. This zone is interpreted as the ablation
Ž .
zone with only a very thin snow layer 0.5 m–1 m corresponding to the seasonal layer in summer time. An analysis of the velocity of the S-wave travelling in this zone indicates a shear wave velocity in ice of
1800 mrs. The structure of the glacier and the
topography of the ice–bedrock constrained by the
Ž .
seismic data Fig. 12 provided the physical explana-tion for the anomalies of the flow lines derived from the glaciological data.
The seismic data analysed here imaged the key structures of this temperate glacier which, in combi-nation with the glaciological measurements, provide a model for the dynamics of Johnsons Glacier.
8. Conclusions
The experimental acquisition setup, simulating a marine streamer, provides a fast shooting rate and allows the acquisition of long profiles in a reason-able period of time, within the short Antarctic field season. In this ice environment, low-energy explo-sives yield a better signal-to-noise ratio, higher am-plitude signals and broader frequency content than the SISSY source. The raw data analysis of the reflection profile delineates zones with large vertical
discontinuities and sectors with different glacier
Ž .
structure ablation and accumulation zones . The
main problem during the processing of seismic re-flection data acquired on the glacier was to remove strong surface waves characterised by spatial alias-ing. A well-resolved seismic image of the ice–rock interface was obtained featuring a prominent but complex reflection event. This event was interpreted as an interference of reflections from the top and the base of the sediment and moraine layer between glacial ice and bed. Geophysical information ob-tained with this study provides the geometrical key and structural knowledge that coupled with the glaciological field observations constrain the models of ice movement of Johnsons Glacier.
Acknowledgements
This study is included in the Spanish Antarctic
Ž .
programme ANT96-0734 and ANT95-0994-C03-02 Ž
financially supported by CICYT Spanish Commis-.
sion for Science and Technology . Thanks to S. Anandakrishnan, J. Rector and especially to A.M. Smith for their review and constructive comments that led to a significant improvement of the manu-script. We would also like to thank R. Carbonell and S. Pullan for their suggestions and comments. We are grateful to the Applied and Environmental
Geo-Ž .
physics group ETH, Zurich , especially to Prof. A.
¨
Green and M. Roth, for the data processing facilities. Funding for this work was provided by a grant
awarded to B.B. by Ministerio de Educacion y Cien-
´
Ž .
cia Spain .
References
Beaudoin, B.C., ten Brink, U., Stern, T.A., 1992. Characteristics and processing of seismic data collected on thick floating ice: Results from the Ross Ice Shelf, Antarctica. Geophysics 57, 1359–1372.
Benjumea, B., 1999. Prospeccion sısmica de alta resolucion en´ ´ ´ estructuras geologicas superficiales y yacimientos arqueolo-´ ´ gicos. Tesis doctoral, Universidad de Granada.
Bentley, C.R., Clough, J.W., 1972. Antarctic subglacial structure from seismic refraction measurements. Antarct. Geol.
Geo-Ž .
( ) B. Benjumea, T. Teixido´rJournal of Applied Geophysics 46 2001 31–44
44
Blankenship, D.D., Bentley, C.R., Rooney, S.T., Alley, R.B., 1986. Seismic measurements reveal a saturated porous layer beneath an active Antarctic ice stream. Nature 322, 54–57. Calvet, J., Santanach, P., 1992. Grietas y pliegues en el glaciar de
la ensenada Johnsons, borde del casquete glaciar de la isla Livingston, Islas Shetland del Sur. In: Lopez Martınez, J.´ ´
ŽEd. , Geologıa de la Antartida Occidental. Simposios T, pp.. ´ ´ 153–161.
Crary, A.P., 1963. Results of United States traverses in East Antarctica, 1958–1961. IGY Glaciol. Rep. 7.
Dahl-Jensen, D., Gundestrup, N.S., Keller, K., Johnsen, S.J., Gogineni, S.P., Allen, C.T., Chuah, T.S., Miller, H., Kipfstuhl, S., Waddington, E.D., 1997. A search in north Greenland for a new ice-core drill site. J. Glaciol. 43, 300–306.
Furdada, G., Pourchet, M., Vilaplana, J.M., in press.
Characteriza-Ž .
tion of Johnsons Glacier Livingston Island, Antarctica by means of shallow ice cores and their tephra and 137Cs con-tent. Acta Geol. Hisp.
Jarvis, E.P., King, E.C., 1995. Seismic investigation of the Larsen Ice Shelf, Antarctica: in search of the Larsen Basin. Antarct. Sci. 7, 181–190.
Levato, L., Veronese, L., Lozej, A., Tabacco, E., 1999. Seismic image of the ice–bedrock contact at the Lobbia glacier, Adamello Massif, Italy. J. Appl. Geophys. 42, 55–63. Nicollin, F., Kofman, W., 1994. Ground penetrating radar
sound-ing of a temperate glacier; modellsound-ing of a multilayered medium. Geophys. Prospect. 42, 715–734.
Nolan, M., Echelmeyer, K., 1999. Seismic detection of transient changes beneath Black Rapids Glacier, Alaska, U.S.A.: I. Techniques and observations. J. Glaciol. 45, 119–131. Robin, G. de Q., 1958. Glaciology III Seismic shooting and
related investigations. Norwegian–British–Swedish Antarctic Expedition, 1949–52, 5, Norsk Polarinstitutt, Oslo, Norway. Paterson, W.S.B., 1994. The Physics of Glaciers, 3rd edn.
Else-vier, Oxford.
Pullan, S.E., MacAulay, H.A., 1987. An in-hole shotgun source for engineering seismic surveys. Geophysics 52, 985–996. Sheriff, R.E., Geldart, L.P., 1995. Exploration Seismology.
Cam-bridge Univ. Press, CamCam-bridge.
Smellie, J.L., Liesa, M., Munoz, J.A., Sabat, F., Pallas, R.,˜ ` ` Willan, R.C.R., 1995. Lithostratigraphy of volcanic and sedi-mentary sequences in central Livingston Island, South Shet-land IsShet-lands. Antarct. Sci. 7, 99–113.
Smith, A.M., 1997. Basal conditions on Rutford Ice Stream, West Antarctica, from seismic observations. J. Geophys. Res. 102, 543–552.
Smith, B.M.E., Evans, S., 1972. Radio echo sounding: absorption and scattering by water inclusion and ice lenses. J. Glaciol. 11, 133–146.
Staples, R.K., Hobbs, R.W., White, R.S., 1999. A comparison between airguns and explosives as wide-angle seismic sources. Geophys. Prospect. 47, 313–339.
Vilaplana, J.M., Pallas, R., 1993. Caracterısticas y evolucion del` ´ ´
Ž . manto nivoso en la Isla Livingston. In: Serrat, D. Ed. , V Simposio Espanol de Estudios Antarticos, Barcelona. Comision˜ ´ ´ Interministerial de Ciencia y Tecnologıa, Actas. Madrid, 279.´ Whillans, I.M., 1987. Force budget of ice sheets. In: van der
Ž .
Veen, C.J., Oerlemans, J. Eds. , Dynamic of the West Antarc-tic Ice Sheet. D. Reidel, Norwell, MA, pp. 17–36.