R eceived 5 M ay 1999; received in revised form 7 D ecember 1999; accepted 1 F ebruary 2000
Abstract
The ecological footprint (EF ) has received much attention as a potential indicator for sustainable development over the last years. In this article, the EF concept has been applied to Benin, Bhutan, Costa R ica and the N etherlands in 1980, 1987 and 1994. The results of the assessment are discussed and used to discuss the current potential and limitations of the EF as a sustainable development indicator. The originally defined methodology has been slightly adapted by the authors, who focus on individual components of the EF (land and carbon dioxide emissions) and use local yields instead of global averages. Although per capita and total land use differs among the four countries, available data suggest increasing land use in all four countries while per capita land use decreases. The EF for carbon dioxide emissions increases for all four countries in both per capita and absolute terms. D ifferences in productivity, aggregation (of different resources) and multi-functional land use have been shown to be important obstacles in EF application — depending on the assessment objective. H owever, despite the obstacles, the study concludes that the EF has been successful in providing an interesting basis for discussion on environmental effects of consumption patterns, including those outside the national borders, and on equity concerning resource use. © 2000 Elsevier Science B.V. All rights reserved.
Keywords: Indicators for sustainable development; Ecological footprint; Land use; Carbon dioxide emissions; International comparison
1. Introduction
Since the introduction of the concept of sustain-able development to the political agenda, there has been an ongoing search for methods to sup-port decision-making for this purpose (see for example H ammond et al., 1991; K uik and Ver-bruggen, 1991; Bakkes et al., 1994; World Bank,
* Corresponding author. Tel.:+31-30-274-2046; fax:+ 31-30-274-4435.
E -mail address: [email protected] (D .P. van Vu-uren)
1996; U N .CSD , 1996; M oldan and Billharz, 1997). In the last few years, the ecological foot-print (R ees, 1992; Wackernagel and R ees, 1996) has frequently been mentioned as one of the indicators that could be used in this context. Wackernagel and R ees (1996) defined the cal footprint (EF ) as the total amount of ecologi-cally productive land required to support the consumption of a given population in a sustain-able way. In the N etherlands, most of the atten-tion for the EF came originally from environmental and educational organisations. Currently, scientists, policy-makers and politicians are increasingly becoming interested.1 The central metaphor of the EF is probably the most impor-tant reason for its popularity: i.e. expression of the impacts of human consumption in terms of a visible footprint made on the natural carrying capacity; EF refers to the continuing dependency of human societies on nature in terms of the more obvious dependency of traditional societies on their available land.
Several organisations have already calculated EF s at different scale levels, ranging from individ-ual and urban to the global scale (see for example Wackernagel et al., 1997; Bicknell et al., 1998; M ilieudienst Amsterdam, 1998; Wackernagel and R ichardson, 1998). M ost of the EF work is still rather exploratory. As well as support, the EF has also received criticism from both scientists and policy-makers (in particular U N .CSD , 1996; van den Bergh and Verbruggen, 1999). At the mo-ment, explicit work still has to be done on the applicability and usefulness of the EF before it can be used in more regular state-of-the-environ-ment or sustainable-development reporting. M eaningful criteria to judge the applicability of EF as a sustainable development indicator are, for instance: (1) policy relevance and utility for users, (2) analytical soundness, (3) measurability (Bakkes et al., 1994) and (4) communication to a broader public.
In this article, we will discuss an application of the EF concept for the N etherlands and Benin, Bhutan and Costa R ica — three developing coun-tries with whom the N etherlands has a close relationship through development cooperation (see also van Vuuren and de K ruijf, 1998). By assessing the EF of these totally different (but small) countries, we will also indicate current possibilities and limitations of the footprint as indicator for a specific country and for interna-tional comparison. D ata availability allows the focus on the N etherlands to be more detailed than on the other three countries. In comparison to many of the earlier footprint applications, the calculations presented here are more detailed (by combining national and international data). M oreover, we examined the way the EF for the four countries changes through time — while the EF has so far almost always been applied as a static indicator.
The article starts with a short overview of some of the appealing aspects and limitations of the EF indicator used so far. On the basis of this, we decided to use a slightly adapted methodology — as will be discussed in the next section. N ext, the results of the four country applications will be discussed and compared with earlier results of Wackernagel et al. (1997). F inally, we return to the advantages of the EF and its (current) limita-tions — as we believe that a balanced and com-prehensive discussion on this topic is still missing. Can the EF be used for policy-making or to stimulate debate or are its results always debat-able? The conclusions also discuss the conse-quences of the adapted definition of the EF used.
2. The ecological footprint concept
2.1. W hat is the ecological footprint?
The EF is intended to provide an overview of the use of resources that can be attributed to final consumption.2 The discussions in Wackernagel
1In 1998 questions on the EF were raised in the D utch
parliament. The M inister of Environment referred to the eco-logical footprint in several speeches and has asked a consulting agency to look deeper into the issue.
2Obviously, it is related to earlier concepts in this area such
resources, this is relatively straightforward.3 F ish consumption is translated into surface area by estimating the area of productive sea required for producing the fish. Carbon dioxide emissions are accounted for by assessing the area of carbon-sink forest required to sequester the carbon dioxide emissions associated with burning fossil fuels.4 This is based on the assumption that increasing the carbon dioxide concentration in the atmo-sphere cannot be regarded as sustainable.
2.2. T he EF:appealing aspects and weaknesses
Earlier, we have made an overview of both the appealing aspects of the EF and its weaknesses based on the discussions in literature (van Vuuren et al., 1999a,b). An attractive aspect of the EF is that it highlights several interrelated topics di-rectly relevant for sustainable development. These include: (a) its focus on the consequences of in-creasing consumption patterns, (b) its focus on several key resources for sustainable development,
In the aggregated EF , an indirect weighting system is used to translate different pressures into an amount of land.5This requires several (subjec-tive) assumptions, including that for sustainable development no increase of greenhouse gas con-centrations can be allowed. Van den Bergh and Verbruggen (1999) argue that by using land as an aggregated indicator, the EF creates a false con-creteness. H ere, we will avoid the issue of aggre-gation as far as possible by not focusing on the aggregated EF — but on its components in their own typical units.
2.2.2. T he lack of common methodologies and
definitions
We found the results of earlier studies looking at the issue of land use for the N etherlands to differ substantially, varying from about 10 million hectares to about 23 million hectares (R ietveld, 1985; H arjono et al., 1996; van den H oek et al., 1996; Wackernagel et al., 1997). Analysis of these studies shows that differences are mainly caused by: (1) definitions used and (2) assumptions with respect to productivity, imports and exports. In this article, we use the definitions as mentioned in Appendix A.
3Although not all land is equally productive; this aspect will
be given more attention later on in the paper.
4Wackernagel and R ees (1996) also propose alternative
measures: (1) calculating the amount of land required to produce a sustainable substitute (biofuels) and (2) calculating the land area required to rebuild a substitutable form of natural capital at the same rate of fossil fuel being depleted. According to Wackernagel and R ees, these alternatives give comparable results. It should be noted that the proposed methodology is no more than an accounting method. The fact that there are also other methods to reduce carbon dioxide emissions (such as energy efficiency) is not ruled out.
5As will be shown further in this article, the EF weighting
2.2.3. Producti6ity
In international comparison of land use, differ-ences in productivity (=land per unit of produc-tion) play a major role. Productivity is influenced by human management factors, including types of product, technology and knowledge, but also nat-ural circumstances, such as soils and climate. Com-paring land use among countries and global regions is complicated by the fact that in some countries natural circumstances are less favourable for high agricultural productivity (we will return to this in the discussion of our results). In current EF work, the issue is altogether avoided by relating consump-tion to the global average yield.6 F or national governments, however, land use based on local yields might be much more relevant since these can
be influenced, for instance, by increasing productiv-ity (which might result in unsustainable land use practices). M oreover, using local yields means that the calculated area is equal to the real, touchable, area used for the consumption of a specific country. Based on the considerations above, we concentrate here on land use based on local yields. In addition, land use based on global average yields is shown as a reference in international comparison and to show the differences in results.
2.2.4. Ecological deficits and surpluses
M any EF studies also define an ecological capac-ity and subtract the EF from this capaccapac-ity to determine so-called ecological deficits or surpluses (for instance, Wackernagel and R ees, 1996; Wack-ernagel et al., 1997). This deficit/surplus indicates whether a country, in principle, is able to supply itself with domestic resources or whether it has to rely on ‘net imports of land’ — thus indicating (net) self-sufficiency in terms of land.7On a global scale, the notion of self-sufficiency and sustainability coincide. F or other scale levels, self-sufficiency (and the deficit/surplus) is a function of, among others, population density.8 The use of information on national ecological deficits is in our view limited, as we doubt whether a large, scarcely populated, self-sufficient country with a large per capita EF should be regarded as more sustainable than a small, densely populated country with a lower per capita EF . F or sustainable development, compari-son of the per capita EF is more meaningful. The consequence of unequal footprints in an increas-ingly populated world is that for every country exceeding the global average capacity, there should be countries with a lower EF (either on the basis of less consumption or more efficient production).
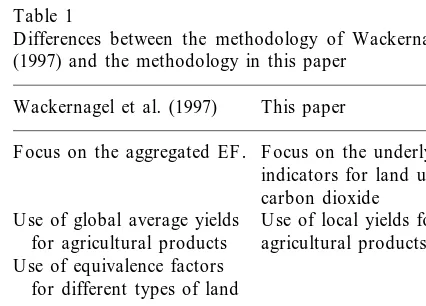
Table 1
D ifferences between the methodology of Wackernagel et al. (1997) and the methodology in this paper
Wackernagel et al. (1997) This paper
F ocus on the underlying F ocus on the aggregated EF .
indicators for land use and carbon dioxide
U se of local yields for U se of global average yields
agricultural products for agricultural products
U se of equivalence factors for different types of land usea
23 product categories for 35 product categories for land use
land use
D oes not include the use of Includes the use of fish
fish resourcesb
resources
aWackernagel et al. (1997) realize that not all land is
equally productive and that the impacts of current land use can be different with regard to future potential of this land. Therefore they multiply their categories of land use by so-called equivalance factors (for pasture land, forest land, crop-land and built-up areas: 0.54, 1.14, 2.82 and 2.82, respectively). These factors are chosen so that on the global scale total land use still equals total available land. The equivalance factors do not deal with large differences in productivity within the land use types. We have decided not to include equivalance factors, since we intended to assess the real amount of land used by each country.
bThe reason not to include fish is that we did not like to
mix up the sea and land — this, again, requires weighting factors. This means that for countries where fish is an impor-tant source of the food consumption, the EF will be typically lower.
6This could be taken to imply that the total global highly
productive and marginal lands are equally distributed to all global citizens.
7‘N et’ self-sufficiency here indicates that more land is used
for consumption of the population of a country than is available within its national borders.
8Among the industrialised countries, for instance, large
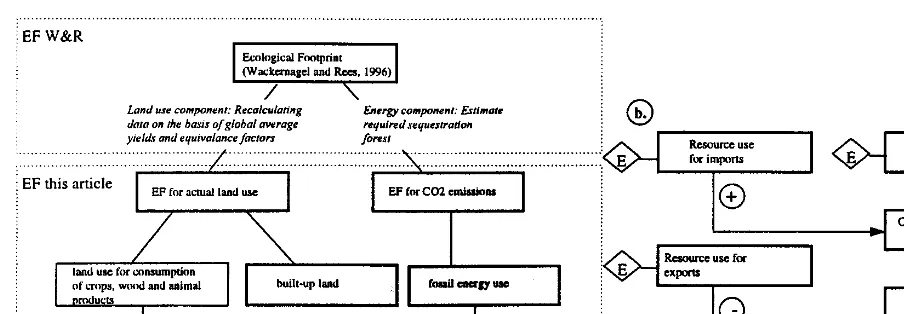
F ig. 1. The components of the EF (differences in focus between Wackernagel and R ees and this paper are indicated close pattern).
3. Methodology
In the previous section, we discussed the EF concept and decided to introduce a few changes in the calculation procedures. The resulting method-ology is nevertheless based on Wackernagel and R ees (1996), Wackernagel et al. (1997); the most fundamental differences are indicated in Table 1. In our calculations two main categories of re-source use are: (1) the EF for land — subdivided into arable land/pastures, forest and built-up area — and (2) the ecological footprint for carbon dioxide emissions (see F ig. 1). We have estimated these EF s for Benin, Bhutan, Costa R ica and the N etherlands for 1980, 1987 and 1994.
3.1. L and use
The data used in this study have been mainly taken from the statistics of the U nited N ations’ F ood and Agricultural Organisation (F AO, 1995 – 1998), assuming that this would make the results more comparable between countries. We have compared these data, if available, with data from national sources (mainly from statistical offices of the countries involved, Chhewang R inzin, 1997; Orozco and Acun˜a, 1997). In most cases the different sources did match well; if not, we have used those considered to be most reliable on the basis of available information (as described in detail in van Vuuren et al., 1999a). F or animal and wood products in the N etherlands more data
was needed than available from F AO and na-tional data have been used (in particular CBS, 1994 – 1996).
A simplified equation for our calculations is indicated (see Eq. (1)). F or some product cate-gories calculation schemes were more complex, as these products are further processed (for instance, wheat into bread). In that case, also imports and exports of manufactured products have to be taken into account.
land –use=%
c
proddom, c
yielddom, c
+ importc
yieldimp, c
− exportc
yieldexp, c
(1)
In Eq. (1) land –use is the net EF for land use in hectares. Suffix c indicates the different produc-tion categories. The variables prod, import and export are domestic production and imports and exports, respectively, in tons per year. The vari-ables yielddom, yieldexp and yieldimp are equal to the domestic yield or the yields that can be at-tributed to imports and exports, all in tons per ha per year. In our calculations, yields for exports have been set equal to domestic yields (except for re-exports) and the yields for imports to the yields of the region from which products are imported; if unknown, global average yields were used for these imports.
estimates made by Stolp and Eppenga (1998) on productivity of natural forests in different parts of the world. The data used for built-up land refer only to domestic land use; time trends were only available for the N etherlands. F or the other three countries, domestic land use has been assumed to grow along with the size of the population. The exact calculations, assumptions and data sources are described in van Vuuren et al. (1999a).
3.2. EF for carbon diox ide emissions
F or the 1985 – 1994 period for the N etherlands, earlier calculations by R IVM and Statistics N etherlands (R IVM , 1998; CBS, 1998) could be used in which the EF for carbon dioxide emis-sions was assessed on the basis of: (1) consump-tion statistics, (2) energy intensities per product and (3) types of energy consumed. F or 1980, we have estimated net carbon dioxide emissions on the basis of normal carbon dioxide emissions statistics and trends in the 1985 – 1997 period. D omestic carbon dioxide emissions in Benin, Bhutan and Costa R ica have been calculated us-ing energy consumption statistics as collected by van Vuuren and de K ruijf (1998). F or carbon dioxide emissions related to net imports of manu-factured goods in Costa R ica, we have used the results of Wackernagel et al. (1997). F or Bhutan and Benin, we concluded on the basis of available trade statistics that the carbon dioxide emissions attributed to the net import of products will be relatively small. H owever, we considered available statistics and energy intensities (which have been determined for industrialised countries only) to be insufficiently reliable to calculate the size of these emissions — and thus only used domestic emissions.
4. Results
4.1. EF for real land use
On a global scale, available land per person is decreasing rapidly due to population growth, changes in production and consumption patterns, expansion of settlements and land degradation
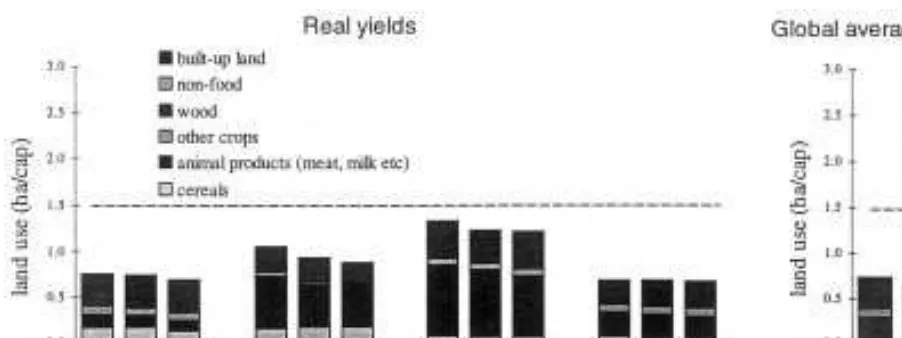
(U N EP, 1997). Earlier assessments of land-use in the N etherlands (H arjono et al., 1996; van den H oek et al., 1996; Wackernagel et al., 1997) show that the most important type of landuse is land required for food production and wood products. H arjono et al. (1996) indicate that landuse for minerals and direct landuse for tourism for the N etherlands can be ignored. F ig. 2 shows the total amount of land used for consumption of food, animal and wood products and built-up land in Benin, Bhutan, Costa R ica and the N etherlands for 1980, 1987 and 1994 on the basis of the data as described in Section 3.
F ig. 2 shows that the net EF for land use increases for all countries. In all of them, the largest shares of land use (for those included in the study) can be attributed to the consumption of wood (25 – 50% of land use) and animal prod-ucts (20 – 55% of land use). It should be noted that products can be used in a totally different way. In Benin and Bhutan, for example, land for wood consumption is almost completely caused by con-sumption of fuel wood — while in the N ether-lands almost all wood is used as industrial round wood (in particular for paper production). In Bhutan and Costa R ica, use of pasture land for low-intensity husbandry explains the large amount of land attributed to these categories. Cereals and other crops account for about 10 – 30% of land use. The land attributed to built-up land is very low (1 – 3%).
F ig. 2. N et land use for agricultural products and wood. H orizontal line indicates total surface area of each country.
surface (Booy and R os, 1997). By subtracting the land use for the N etherlands’ exports to other countries, the net EF for land use is found to be about two to three times the total land surface of the N etherlands. The largest share of land outside the N etherlands used for D utch consumption is land for timber from Scandinavia and other parts of Western Europe. F ood production also claims an important share, in particular, in N orth and South America, and Africa. F inally, land is used for the production of animal feed in Western Europe, N orth America, South America and Southeast Asia (Thailand).
The surplus of domestically available land and land used for human consumption in Benin, Bhutan and Costa R ica is mainly brought about by relatively large areas that are still undomesti-cated. Also for Costa R ica, a sizeable amount of land is allocated to exports of fruit and coffee. At first glance, the surplus of land in all three coun-tries might indicate that they still have the ability to increase the amount of land used within their own territory (although at the expense of biodi-versity). H owever, in Bhutan, in particular, the potential for agricultural expansion is severely limited due the lack of arable land.
4.2. Producti6ity per hectare
F ig. 3. N et land use per capita based on actual global average yield (1994). H orizontal line indicates global average land use per capita.
average yields figures (left and right parts of F ig. 3) indicates how important differences in yield are: for the N etherlands, for instance, land use increases from 0.7 to almost 3.0 ha per capita.
Possibly surprisingly, F ig. 3 shows that land use per capita is lowest for the N etherlands as a result of the high agricultural productivity of this coun-try. F or Costa R ica, the land use per capita is highest, mainly due to extensively used pasture lands (which are often marginal lands cleared from forest over the last decades). F ig. 3 also shows that in all four countries, the amount of land used per capita declines.
In terms of net land use based on global aver-age yields, obviously land use of the N etherlands is largest — indicating the high level of tion in this country. In particular, the consump-tion of meat and diary products represents a large share of the land use of the N etherlands if ac-counted for on the basis of global yields. Both the N etherlands and Costa R ica use a larger amount of ‘global average yield land’ than is actually available. On this measure, land use of Benin and Bhutan are lowest, being directly related to the low consumption level in these countries.
4.3. Uncertainty in the estimated land use
We calculated the highest and lowest estimate for land use in each country, which might give
some idea of the uncertainty involved. F or the N etherlands, these respective estimates are about 20% lower and 50% higher than the central esti-mate — mainly as a result of uncertainty in the estimates on the productivity of forests and the allocation of land to exports of dairy products and meat. F or Benin and Costa R ica, the high and low estimates differ by about 30 – 50% from the central estimate — for Bhutan this is about 40 – 60%. Again, the productivity attributed to forests dominates the differences found.
4.4. T rends in the 1980–1994period (agricultural products)
F our trends could be responsible for changes in the total real net land use for agricultural prod-ucts: changes in the total population of each of the countries, changes in yields, changes in the type of products consumed and changes in the total amount of products consumed.
the other two factors constant at 1987 levels and thus analysing the influence of each factor separately.
17%. Increasing yield per product has been the most important factor behind the decrease in per capita land use in Benin, Costa R ica and the N etherlands — while in Bhutan, available data suggest a (further) shift away from land-intensive dairy products, also contributing to a lower land use per capita.
4.5. Ecological footprint of carbon diox ide
emissions
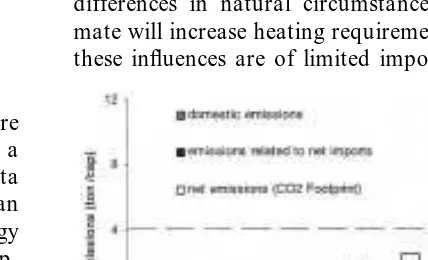
N ot surprisingly, F ig. 4 shows that far more carbon dioxide is emitted for consumption by a person in the N etherlands than a person in Costa R ica (60% less) and Benin and Bhutan (more than 90% less). This is not only a result of lower energy consumption, but also because energy consump-tion is based less on fossil fuels. M ost of the commercial energy consumed in these countries is based on hydropower (thus zero emissions).9 In addition, a lot of fuelwood is consumed in households.10
The carbon dioxide emissions attributed to con-sumption in the N etherlands are considerably less than the emissions within this country. This is
caused by the N etherlands’ relatively large heavy industry, which produces goods for many Eu-ropean countries. F or Costa R ica net carbon dioxide emissions are slightly higher than domes-tic emissions as a result of import of manufac-tured products. As for land use, the level of carbon dioxide emissions is also influenced by differences in natural circumstances (a cold cli-mate will increase heating requirements), although these influences are of limited importance.
F ig. 4. EF for carbon dioxide emissions in 1994. H orizontal line indicates global average per capita emissions.
10Carbon dioxide emissions from fuelwood are often not
included in carbon dioxide emission inventories. In Benin and Bhutan, energy consumption of fuelwood is about 10 G J per person per year in comparison with the 180 G J per person of commercial fuels consumed in the N etherlands. Land use needed for fuelwood consumption has been included in the forest areas in F igures 3 and 4.
9The use of land for hydropower has not been included in
Table 3
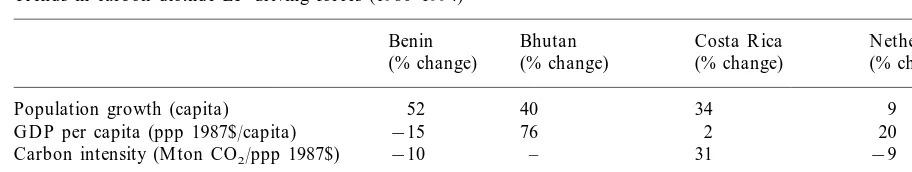
Trends in carbon dioxide EF driving forces (1980–1994)a
Benin Bhutan Costa R ica N etherlands (% change) (% change)
(% change) (% change)
52
Population growth (capita) 40 34 9
G D P per capita (ppp 1987$/capita) −15 76 2 20
– 31
−10 −9
Carbon intensity (M ton CO2/ppp 1987$)
Carbon dioxide emissions (M ton) 15 – 80 18
aSources: carbon dioxide emissions are calculated as described under methodology; population growth and G D P in
purchasing-power parity dollars per capita are taken from World Bank (1998) (data for Bhutan from van Vuuren and de K ruijf, 1998).
4.6. Focusing on the N etherlands
The data for the N etherlands were also available for the 1985 – 1997 period (domestic emissions and net emissions for consumption of the population). Earlier, Suri and Chapman (1998) reported that one factor behind the decreasing elasticity of energy to G D P in industrialised countries, as a group, is an increased import of manufactured goods from developing countries. This would imply — in terms of the EF — that net emissions grow faster than domestic emissions (since the former would also include the increased emissions in developing coun-tries). The available data for the N etherlands, however, does not provide evidence for such a shift for this particular country. The N etherlands, how-ever, has a large positive balance of trade; increas-ing exports in the same period may have offset increasing imports from developing countries.
4.7. T rends in the 1980–1994 period
Trends in carbon dioxide emissions can be dis-cussed vis-a`-vis changes in population size (popula-tion), per capita income (G D P/population) and carbon intensity (CO2 emissions/G D P) (Eq. (2), using the so-called K aya identity; K aya, 1989).
CO2 emissions=population×
G D P population
×CO2 emissions
G D P (2)
Although this identity does not provide an explana-tory model, it offers a simple and transparent
accounting framework, which can assess the contri-bution of different factors to the overall change in carbon dioxide emissions.
Table 3 shows the changes of the three different factors. In all four countries, population growth alone (all other factors considered to be constant) can be identified as an important upward pressure on carbon dioxide emissions. At the same time, the other factors change also as a result of which, for instance, Benin, the county with the highest popu-lation growth, has only a relatively small increase in carbon dioxide emissions. One of them is the change in activities — measured in terms of G D P. In the N etherlands and Bhutan G D P per capita has increased strongly over the 1980 – 1994 period (less so in Benin and Costa R ica as a result of strong economic recessions during the period of study). The remaining factor, carbon intensity (carbon dioxide emissions per unit of G D P), is a function of energy efficiency, structural changes in the economy and the type of fuel used. World-wide, carbon intensities decrease over time for industri-alised countries while for developing countries trends are country-specific. Carbon intensity has decreased in the N etherlands and Benin, but in-creased in Costa R ica as result of an inin-creased share of commercial fuels. The latter can be explained by the transition in Costa R ica towards an industri-alised economy.
4.8. A ggregation into W ackernagel and R ees’ eco-logical footprint
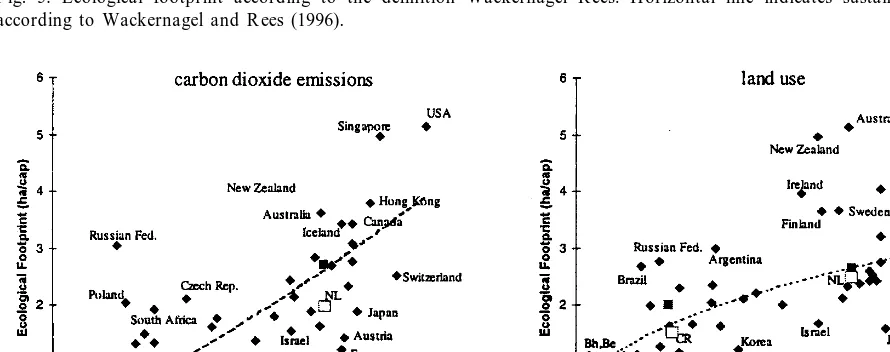
F ig. 5. Ecological footprint according to the definition Wackernagel R ees. H orizontal line indicates sustainable global level according to Wackernagel and R ees (1996).
F ig. 6. Wackernagel and R ees’ EF on the basis of this study and earlier results.
nagel and R ees, thus including (hypothetical) land for carbon sequestration (‘energy land’). ‘Energy land’ now becomes an important part of the EF of the N etherlands — and to some degree as well the EF of Costa R ica. The calculated figures can be compared with the 1.31 ha per capita considered sustainable at global level by Wackernagel et al.
(1997).11The N etherlands and also Costa R ica are considerably above this level on a global average yield basis.
The land use based on global average yields as calculated in this study has been compared to the earlier calculations of Wackernagel et al. (1997).12 The aggregated EF s of this study for the
11Wackernagel et al. (1997) mention that on global scale,
2.1 ha. per capita was available in 1993 — including 0.56 ha sea. After subtracting the sea area, setting aside 12% of the land area for biodiversity, and recalculating available land on the basis of 1994 population data, 1.31 ha per capita remains.
12F or comparison, we included the equivalence factors of
N etherlands and Costa R ica are somewhat lower than the earlier results (4.6 ha per capita versus 5.2 ha per capita, and 2.1 ha per capita versus 2.4 ha per capita, respectively). The main under-lying differences are a smaller area attributed to forest use and carbon dioxide emissions for both countries and a larger area attributed to pasture land for Costa R ica. F ig. 6 shows the results of this study in comparison with the 52 countries included in the study of Wackernagel et al. (1997). In general, countries with a higher G D P per capita score higher, both with respect to the carbon dioxide emissions and the land use com-ponent of the EF . At the same time, however, the spread of individual countries is large. The discussion in this article gives some idea of the causes of the spread, including consumption pat-terns and the overall level of consumption, local agricultural and climatic agricultural practices, influence of environmental policies and uncer-tainty in data and calculation methods. In case of land use, the available data seem to suggest a slow saturation at higher income levels. Within the N etherlands, a study looking at land use of different income groups made a similar observa-tion for land use for food producobserva-tion; land use for wood products and paper was simply corre-lated with income (R IVM , 1998). The countries above the ‘average curve’ are all large, scarcely populated countries — perhaps caused by the fact that land efficiency in these countries is less of a need. The carbon dioxide component shows that in addition to countries with high domestic emissions, such as the U SA and the R ussian F ederation, also affluent, importing countries can, in EF terms, be identified as having a large per capita contribution to global emissions. This includes, for instance, countries like H ong-K ong, Iceland and Singapore.
5. Discussion and conclusions
This study shows the results of using a foot-print type assessment at the national level in four different countries.
5.1. A dapted EF 6ersus original method
We adapted the EF calculation method of Wackernagel and R ees (1996) on several points. We have disaggregated the EF into separate footprints for individual resources, thus avoiding the controversial topic of aggregation. In addi-tion, we calculated land use on the basis of local yields to show the real land use of countries (a parameter that is more policy relevant at the national level). It was shown that for interna-tional comparison, however, use of local yields only can lead to results that are difficult to com-pare directly (obviously, depending on the objec-tive of the comparison) — making a case for simultaneous use of local and global average yields calculations. We conclude that the disag-gregated presentation used in this article in-creases the applicability of the indicator in policy-oriented assessment.
5.2. M ain considerations on our calculations
tor for sustainable development is very limited: the EF only covers some of the environmental topics and does not contain any information on economic and social development. Consequently, it should be part of a larger set of indicators. M oreover, EF (like many other indicators) is simply what it says: an indication of the current situation; its results should form a basis for fur-ther discussion. Policies can only be formulated after further analysis and taking into account more considerations.
The strongest point of the EF (and thus its relevance) is its metaphor and the way it focuses on several issues directly related to sustainable development in an integrated way: impacts of consumption patterns, reallocation of pressures, distribution of available resources and the impacts of trade. Van den Bergh and Verbruggen (1999) argue that the EF implicitly promotes autarchy or is against trade. H owever, the calculation method of the EF does not give any reason for this. If international trade is truly based on ecologically comparative advantages (including the effects of transport), it will result in a lower overall EF .
The results of this assessment indicate that the EF concept could be an additional assessment framework to production or domestic pollution-oriented approaches. Specific questions that EF indicators — in principle — could address are:
1. What is the current use of/environmental pres-sure on key resources for sustainable develop-ment? H ow does use change in time?
2. H ow does resource use — in per capita terms — of a population relate to the average global use or to a more ‘sustainable’ level?
for international comparison (e.g. as result of differences in land use potential). Policy measures aimed at reducing EF s will in most cases go in the same direction as current environmental policies such as: (1) improving agricultural production, if necessary to prevent degradation of natural areas; (2) changing material consumption patterns and levels (in affluent societies) to a more sustainable level; and (3) reducing fossil fuel emissions by energy efficiency and use of renewable energy. In addition, however, the EF might encourage poli-cies that take into account the consequences in other countries, in particular, for carbon dioxide emissions. Obviously, distribution of environmen-tal resource use is related to the distribution of financial resources — and policy initiatives should therefore be integrated into this much broader issue.
5.3.2. M easurability
This study (and that of Wackernagel et al., 1997) shows that EF -type indicators can be calcu-lated on the basis of available data such as F AO data and data from national statistical sources. Estimates should, obviously, be used while ac-knowledging the many uncertainties in these data. F or international comparison, definition of EF indicators should be further defined, as this still seems to create confusion about the comparability of earlier studies.
5.3.3. A nalytical soundness
for sustainable development. F irst of all, the topic of aggregation deserves further discussion; al-though the aggregated EF might be useful in communication to a broader public, we are of the opinion that analytical soundness improves if the EF is elaborated as a set of resource indicators. Secondly, the issue of agricultural productivity is found to be an important limitation. We have used local yields, but this method suffers from the fact that productivity is not only a function of management but also of natural circumstances. F or international comparison, it should be good to distinguish the influence of these two factors. The solution of Wackernagel and R ees (1996) to calculate land use on the basis of global average yields rules out the possibility of countries reduc-ing their EF by improved agricultural manage-ment. An alternative solution would be the introduction of equivalence factors; however, this requires more insight into the different underlying factors. Thirdly, a problem exists with regard to multifunctional land use. In the EF , only one function is given to a certain amount of land. H owever, in reality, land can have, to a certain degree, more than one function; for instance forests can simultaneously produce timber and fuelwood, support biodiversity, support recre-ational use and sequester carbon dioxide. A fourth, and the most important obstacle at the moment is handling unsustainable resource use in the context of the EF . F or example, no distinction is made in sustainable and unsustainable land use — which might lead to the paradoxical situation that unsustainable agricultural production meth-ods (contributing to soil degradation) decrease EF due to higher productivities. Improvements here hinge on the development of indicators for sus-tainable land use — which is still an area under development (see World Bank, 1996). A fifth area where the EF could be improved is a more direct link to ‘biodiversity’ — another key resource for sustainable development. This might be possible by including the ecological value of the land converted into agricultural land into consider-ation. F inally, the EF is a macro-indicator that cannot indicate the situation for more specific issues or (still) other important aspects of environ-mental sustainability not included in the
indica-tor, such as the use chemicals or water consumption.
5.3.4. Communication to a broader public
Based on its popularity, the EF is among the most effective tools for providing an indication of the human impact on nature and for conveying this analysis to a broader public — an area where not many other indicators exist.
In particular, the metaphor used and the ac-counting system have already proven to be useful in communicating the concept of sustainable de-velopment and related issues to scientists, policy-makers and school youth. The per capita EF seems to be more useful for this than the absolute numbers. Although far from perfect, the EF can be concluded to provide a basis for discussion, for example, in the cause for differences among coun-tries, the equity issue and available means to reduce the present ecological footprint of man on earth — both at the individual and global levels.
Acknowledgements
The authors would like to thank the F ounda-tion Ecooperaounda-tion for making the research for this article possible through its financial support. We would also like to thank Jan Bakkes, H ans de K ruijf, H enk van Schaik, Jan Juffermans and the two referees of this journal for their valuable comments and suggestions. F inally, we would like R uth de Wijs for her assistance in the English language editing.
Appendix A. Definition of the EFs featured here
Ecological footprint: the amount of the world’s environmental resources required to support the consumption of a defined population regardless of where this capacity is used.
References
Bakkes, J.A., van den Born, G .J., H elder, J.C., Swart, R .J., H ope, C.W., Parker, J.D .E., 1994. An Overview of Envi-ronmental Indicators: State of the Art and Perspectives. U N EP, N airobi, K enya.
Bicknell, K .B., Ball, R .J., Cullen, R ., Bigsby, H .R ., 1998. N ew methodology for the ecological footprint with an applica-tion to the N ew Zealand economy. Ecol. Econ. 27, 149 – 160.
Booy, H ., R os, J., 1997. Achtergronden M ilieubalans 1997. N ational Institute for Public H ealth and the Environment, The N etherlands, pp. 228 – 231 In D utch.
CBS, 1994 – 1996. Various statistical yearbooks, Centraal Bu-reau voor de Statistiek (In D utch), SD U U itgeverij, The H ague, The N etherlands.
CBS, 1998. D e N ederlandse economie in 1997. Centraal Bu-reau voor de Statistiek. Voorburg/H eerlen, The N ether-lands In D utch.
Chhewang R inzin, 1997. The M iddle Path of D evelopment. R oyal Institute of M anagement, Thimpu, Bhutan. F AO, 1995 – 1998. F AO Stat, Computerized Information
Se-ries, F ood and Agricultural Organisation, R ome. H ammond, A., Adriaanse, A., R odenburg, E., Bryant, D .,
Woodward, R ., 1991. Environmental Indicators: A Sys-tematic Approach to M easuring and R eporting on Envi-ronmental Policy Performance in the Context of Sustainable D evelopment. World R esources Institute, Washington, D C.
H arjono, M ., H oefnagels, F ., de Lange, V., van Bennekom, S., Besselink, C., Ellenbroek, A., 1996. N ederlands ruimtebeslag in het buitenland. Publicatiereeks M ilieustrategie 1996/9. M inistry of H ousing, Spatial Plan-ning and the Environment, together with CR EM (Consul-tant and R esearch for Environmental M anagement) and N ederlands Comite´ voor IU CN , The H ague In D utch. van den H oek, P.W.M ., van der Poel, P., R os, J.P.M ., 1996.
Indicatoren voor het thema Verspilling; rekenmethodiek. N ational Institute of Public H ealth and the Environment, Bilthoven, The N etherlands R IVM -report, 772 416 004, In D utch.
ridia, Costa R ica.
Proops, J.L.T., Atkinson, G ., F rhr von Schlotheim, B., Simon, S., 1999. International trade and the sustainability foot-print: a practical criterion for its assessment. Ecol. Econ. 28, 75 – 97.
R eddy, A.K .N ., Williams, R .H ., Johansson, T.B., 1997. En-ergy after R io. Prospects and Challenges. U nited N ations D evelopment Programme, N ew York.
R ees, W.E., 1992. Ecological footprint and appropriated car-rying capacity: what urban economics leave out. Environ. U rban. 4 (2), 120 – 130.
R ietveld, H .S.J., 1985. Landgebruik door N ederland. Science-Shop, F ree U niversity of Amsterdam, Amsterdam In D utch.
R IVM , 1998. M ilieubalans 1998. N ational Institute for Public H ealth and the Environment, Bilthoven, The N etherlands In D utch.
Stolp, J.A.N ., Eppenga, R ., 1998. R uimteclaim door het N ed-erlandse gebruik van hout-en papiersoorten. Stichting Bos en H out, Wageningen, The N etherlands In D utch. Suri, V., Chapman, D ., 1998. Economic growth, trade and
energy: implications for the environmental K uznets curve. Ecol. Econ. 25, 195 – 208.
U N .CSD , 1996. Indicators of Sustainable D evelopment. U nited N ations, N ew York.
U N EP, 1997. G lobal Environment Outlook. Oxford U niver-sity Press, N ew York.
van den Bergh, J.C.J.M ., Verbruggen, H ., 1999. Spatial sus-tainability, trade and indicators: an evaluation of the eco-logical footprint. Ecol. Econ. 29, 61 – 87.
van Vuuren, D .P., de K ruijf, H .A.M ., 1998. Compendium of data and indicators for sustainable development in Benin, Bhutan, Costa R ica and the N etherlands. N ational Insti-tute of Public H ealth and the Environment, Bilthoven, the N etherlands R IVM report N o. 807 005 001.
van Vuuren, D .P., Smeets, E.M .W., D e K ruijf, H .A.M ., 1999a. The Ecological F ootprint of Benin, Bhutan, Costa R ica and the N etherlands. N ational Institute for Public H ealth and the Environment, Bilthoven, The N etherlands R IVM report N o. 807 005 004.
development — results of case studies. In: Conference on Ecosystem H ealth, Sacramento, August 1999.
Wackernagel, M ., R ees, W.E., 1996. Our Ecological F oot-print: R educing H uman Impact on the Earth. N ew Society, G abrioala Island, BC, Canada.
Wackernagel, M ., R ichardson, D ., 1998. H ow to calculate a household’s ecological footprint, in preparation. Ana´huac U niversity of Xalapa and U niversity of Texas.
Wackernagel, M ., Onisto, L., Callejas Linares, A., Lo´pez F alfa´n, I.S., M e´ndez G arı´a, J., Sua´rez G uerrero, A.I., Sua´rez G uerrero, M .G ., 1997. Ecological F ootprints of N ations: H ow M uch N ature D o They U se? H ow M uch N ature D o They H ave? International Council for Local
Environmental Initiatives, Toronto, Ont., Canada Text references to this report — calculations refer to calcula-tions sheets directly received from M . Wackernagel that have been slightly updated.
Weterings, R .A.P.M ., Opschoor, J.N ., 1994. Toward environ-mental performance indicators based on the notion of environmental space. Advisory Council for R esearch on N ature and Environment, R ijswijk, The N etherlands Puli-cation N o. 96.
World Bank, 1996. M onitoring Environmental Progress: Ex-panding the M easure of Wealth. World Bank, Washington D C.
World Bank, 1998. World D evelopment Indicators. World Bank, Washington D C.