Improving GlobalLand30 Artificial type extraction accuracy in low-density residents
Lili Houa, Ling Zhua,*,Shu Pengc, Zhenlei Xiea, Xu Chena a
School of Geometrics and Urban Information, Beijing University of Civil Engineering and Architecture,100044 Beijing [email protected]
b National Geometrics Center of China,100036 Beijing [email protected]
KEY WORDS: GlobalLand 30, TM, Low-density residents, nighttime light remote sensing image, TM6, TR-NDBI
ABSTRACT:
GlobalLand 30 is the first 30m resolution land cover product in the world. It covers the area within 80°N and 80°S. There are ten classes including artificial cover, water bodies, woodland, lawn, bare land, cultivated land, wetland, sea area, shrub and snow,. The TM imagery from Landsat is the main data source of GlobalLand 30. In the artificial surface type, one of the omission error happened on low-density residents’ part. In TM images, hash distribution is one of the typical characteristics of the low-density residents, and another one is there are a lot of cultivated lands surrounded the low-density residents. Thus made the low-density residents part being blurred with cultivated land. In order to solve this problem, nighttime light remote sensing image is used as a referenced data, and on the basis of NDBI, we add TM6 to calculate the amount of surface thermal radiation index TR-NDBI (Thermal Radiation Normalized Difference Building Index) to achieve the purpose of extracting low-density residents. The result shows that using TR-NDBI and the nighttime light remote sensing image are a feasible and effective method for extracting low-density residents’ areas.
*
Ling Zhu, E-mail:[email protected] 1. INTRODUCTION
GlobalLand 30 is the first 30m resolution land cover product in the world. Compared with Europeans and American countries’ 1000m and 300mr resolution land cover products, GlobalLand30 has higher spatial resolution and accuracy, and it also provide the detection and analysis with the change of surface coverage based on the surface coverage data products in 2000 and 2010.
GlobalLand30 extracts feature type mainly form Landsat TM/ETM as the main data source. Artificial cover is formed by human activities with asphalt, concrete, sandstone, tiles, glass and other building materials. In this way the artificial cover can be divided into residential area, transportation, communications, and lamp facilities of industrial and mining. According to the density of residents, residential area can be divided into urban residents , rural residents and low-density residents, etc. From the above, there are many mature methods of extracting artificial cover based on TM in our country. For example, Cunjian Yang extracted the information of residents semi-automatically from the TM images by the way of Spectral Structure Threshold(Yang and Zhuo, 2000) . Yong Zha used The normalized construction index to extract the urban area in Wuxi(Yong, 2003). Hongan Wu used the way of Construction of residential ratio index (RRI = B1 / B4) in Xian and Xian yang (Hongan, 2006). Similarly, Yan Yang built a new index
(UI = B6 × B5 / B4) to acquire the Urban Land’s information
along Nanjing to Yangzhou (Yan, 2006).
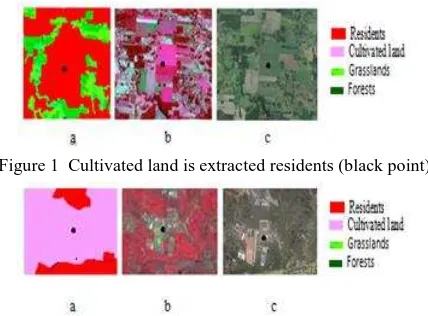
Due to the resolution of TM image is only 30 meter and the low-density residents are covered smaller area on the image, and the low-density residents are always along the road, surrounded by cultivated land. As a result, the pixel in crisscross of town and village is often mixed. The methods above are always more suitable to a certain residential density, but to the hash type and low-density residents the information cannot be extracted correctly, especially in the crisscross of town and village. We can get a directly impression from Figure 1, Figure 2:
Figure 1 Cultivated land is extracted residents (black point)
Figure 2 Residents are extracted cultivated land (black point) The “a” in two figures are results. The “b” in two figures are images of TM432 in the same areas, as well as “c” in two figures are Google images.
2. STUDY AREA AND DATA
2.1 Study area
This paper selects TM images of Esther in Paraguay for study. Paraguay, which is located in the north of La Plata plain, is a landlocked country in central South America. Its north is Bolivia, east with Brazil, the west and south border is Argentina. Esther is the world’s third largest free business district followed by Miami and Hong Kong. Its economic growth is the fastest in South America, which reached to 14.5% of Paraguay's GDP growth. The TM images have already been geometric correction and radiation calibration.
The International Archives of the Photogrammetry, Remote Sensing and Spatial Information Sciences, Volume XLI-B8, 2016 XXIII ISPRS Congress, 12–19 July 2016, Prague, Czech Republic
This contribution has been peer-reviewed.
Figure 3 Esther TM image (TM432)
DMSP (the Defense Meteorological Satellite Program) is a military weather satellite launched in 1976 by the United States. OLS, the sensor of DMSP, can detect the city lights at night including the low intensity light from the small-scale residents or the traffic stream. OLS consists of two channels: one is
visible light (0.4~1.1μm), another one is thermal infrared (
10.0-13.4μm), whose total width of the image is 3000km(Herao,
2012). In 1992, the department of defense (DOD) and the national oceanic and atmospheric administration (NOAA) started to use the digital documents. Since then, there were an increasing number of scholars begun to study nighttime light remote sensing data for urban studies, research areas include the urban population(Sutton, 1997) ,economy(Elvidge et al, 1997) ,energy(Amaral et al, 2005) and environment(Gallo et al, 1995) . The nighttime light remote sensing study in ours contrary is later than the United States and Europe countries, Jin Chen and other researchers used the nighttime light remote sensing data to analysis the change characteristics of China's urbanization (Jin, 2003); With the use of the nighttime light remote sensing data, Mengjie Xu and others studied on the Yangtze river delta urbanization process (Mengjie, 2011). Research shows that urban spatial information can basically reflect the actual situation of the development of urbanization in out country based on the nighttime light remote sensing data (Li, 2003).
The nighttime light remote sensing data we used in this paper is downloaded from the United States national geophysical data
center web site
(http://ngdc.noaa.gov/eog/dmsp/downloadV4composites.html). Since the coordinate system of original data is geographic coordinates, coordinate transformation is necessary to match it with the Landsat TM images. After that, we cut out the nighttime light remote sensing data and Landset-5 image to get the study area.
Figure 4 The nighttime image of Esther (left) and comparison chart of the nighttime image and TM image
3. EXTRACTION OF RESIDENTS
The flowchart of this paper:
Landsat images DMSP/OLS
Geometric Correction
Coordinate transformation Resampling
Image Crop
Image preprocessing
Urban contour extraction Landsat TM Mask
Analysis of spectral structural
TR-NDBI
Set the threshold (0.12-0.4)
Residential extraction
SVM
Figure 5 Flowchart of this paper 3.1 Research methods
3.1.1 Analysis of Esther residents and background feature characteristics: The nighttime light remote sensing data reflects the level of intensity of human activity, the higher value of the night lights is, the greater intensity of human activity is, and the area is more likely to be a developed city. In contrast, the region is more likely to be a village. According to this characteristic of nighttime light remote sensing data, this paper use the SVM to extract the contour of the study area. And then mask TM image to obtain the study area. Since the resolution of the nighttime light remote sensing data is very coarse and also exists the phenomenon of lighting overflow, the clipping area includes not only residents, but also water bodies, cultivated land, forest and other land types.
Figure 6 Cropping image (TM432)
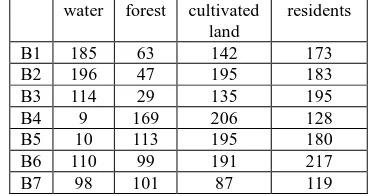
In order to analyse the differences of characteristics of residents, water bodies, forest , cultivated land in Esther, we do statistical analysis separately to 7 TM bands by divided the TM images into four kinds of residents ,water bodies ,woodland and cultivated land,as shown in Table 7:
water forest cultivated land
residents
B1 185 63 142 173
B2 196 47 195 183
B3 114 29 135 195
B4 9 169 206 128
B5 10 113 195 180
B6 110 99 191 217
B7 98 101 87 119
Table 7 Residents and other land type mean of different bands
The International Archives of the Photogrammetry, Remote Sensing and Spatial Information Sciences, Volume XLI-B8, 2016 XXIII ISPRS Congress, 12–19 July 2016, Prague, Czech Republic
This contribution has been peer-reviewed.
We may safely draw a conclusion that, from the Table7, the residents’ B6 band value is obviously higher than background features due to heat island effect of B6 band. But it is hard to extract residents correctly because of the difference of residents, cultivated land, water bodies in B1, B2, B3 bands is very small. And then the NDBI index is composed of B4 and B5 band, the residents and background feature’ NDBI are shown in the
Figure 9 Graph of NDBI
Considering part of NDBI value of cultivated land , water bodies and residents lie in the same range, the extraction results of resident will include some cultivated land and water bodies under the condition of single threshold that NDBI is applied, which will not makes the accuracy meets requirement.
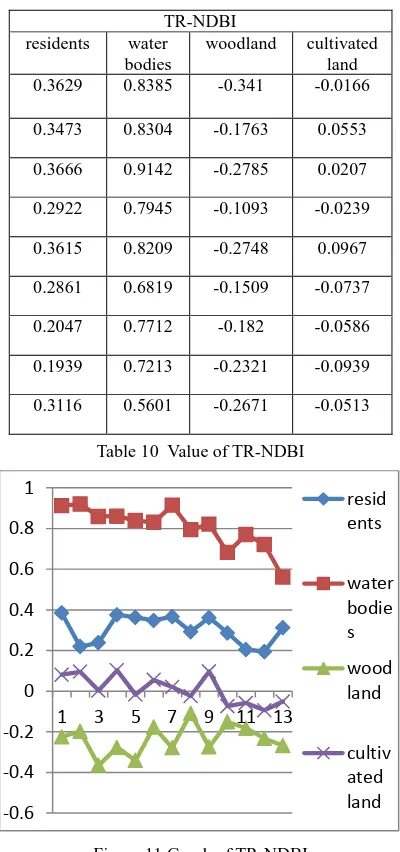
3.1.2 TR-NDBI index: Because of heat island effect of B6
band, the residents’ B6 band value is obviously higher than
background features. And NDBI cannot correctly extract residents. Based on NDBI index, we add TM6 band to build artificial covering index TR-NDBI ((B6+B5)/2-B4)/ ((B6+B5)/2+B4) to extract residents.
The TR-NDBI values of residents and other land types is shown as Table 10:
Figure 11 Graph of TR-NDBI
We can see that although the value of water bodies in B6 and B5 band is littler than the residents in B5 and B6 band, its value in B4 band is the least one, so the TR-NDBI values of water bodies are highest among these land cover types, and all of the values are above 0.4. The value of forest in B4 band is the highest than it in any other bands, so the TR-NDBI values of forest are all negative. Due to the different crops, some values in B5 band are higher than values in B4 band, and others are on the contrary, but the TR-NDBI values of cultivated land is
The International Archives of the Photogrammetry, Remote Sensing and Spatial Information Sciences, Volume XLI-B8, 2016 XXIII ISPRS Congress, 12–19 July 2016, Prague, Czech Republic
This contribution has been peer-reviewed.
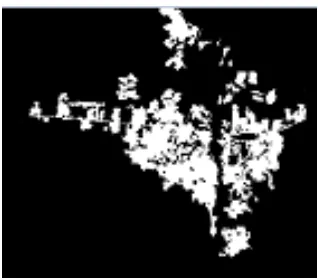
Figure 12 Extraction result
3.2 Accuracy analysis
In order to verify the accuracy of TR-NDBI, we selected 430 sample points form the result image to get the confusion matrix.
residents Non-residents
total accuracy
residents 194 36 230 84.3%
Non-residents
17 183 200 91.5%
total 211 219 430 87.7%
Table 13 Confusion matrix
Table13 shows that the accuracy of TR-NDBI reaches 87.5%. So we could safely draw a conclusion that TR-NDBI method is a feasible and effective method for the extraction of residents.
4. CONCLUSION
(1)In summary, TR-NDBI method is a feasible and effective method for the extraction of residents. Because it removes the negative effect of cultivated by setting a threshold, especially suitable for the crisscross area between farmland and town. (2)The paper makes full use of heat island effect of B6 band by changing NDBI index to TR-NDBI index on the basis of reference the nighttime light remote sensing image.
(3)Due to the accuracy of TR-NDBI reached 87.7%, TR-NDBI index is an effective way to update the artificial cover in GlobeLand30 products.
(4)Since the study area we choose has little grassland and bare land, it is uncertain that the TR-NDBI method is suitable to other regions where has many grassland and bare land or not.
REFERENCES
Amaral, S., Câmara, G., Monteiro, A.M.V., Quintanilha, J.A. and Elvidge, C.D., 2005. Estimating population and energy consumption in Brazilian Amazonia using DMSP night-time satellite data. Computers Environment & Urban Systems, 29(2), pp.179-195.
Elvidge, C.D. et al., 1997. Relation between satellite observed visible-near infrared emissions, population, economic activity and electric power consumption. International Journal of Remote Sensing, 18(6), pp.1373-1379.
Gallo, K.P., Tarpley, J.D., Mcnab, A.L. and Karl, T.R., 1995. Assessment of urban heat islands: a satellite perspective. Atmospheric Research, 37(1), pp.37-43.
Herao, W., 2012. Review of DMSP/OLS data applications. Progress in Geography, 01, pp. 11-19.
Hongan, W., 2006. The application of RRI index in urban information extraction. Journal of Nanjing Normal University (Engineering and Technology Edition), 03, pp. 118-121. Jin, C., 2003. Chinese urbanization process based on DMSP/OLS data-- Construction reflecting regional urbanization level of lighting Index. Journal of Remote Sensing, 03, pp. 168-175+241.
Li, Z., 2003. Temporal and spatial urban China in the 1990s – discussion of a method based on light CNLI index. Acta Geographica Sinica, 06, pp. 893-902.
Mengjie, X., 2011. Yangtze River Delta urbanization pattern and process based on DMSP/OLS nighttime light. Remote Sensing For Land &Resources, 03, pp. 106-112.
Sutton, P., 1997. Modeling population density with night-time satellite imagery and GIS. Computers Environment & Urban Systems, 21(3-4), pp. 227-244.
Yang, C.J. and Zhuo, C.H., 2000. Extracting Residential Areas on the TM Imagery. Journal of Remote Sensing, 02, pp. 146-150+166.
Yan, Y., 2006. The methods of extract urban land based on towns index. Remote Sensing Information, 04, pp. 27-29. Yong, Z., 2003. Effective method using TM image automatically extract urban land information. Journal of Remote Sensing, 01, pp. 37-40+82.
Revised April 2016.
The International Archives of the Photogrammetry, Remote Sensing and Spatial Information Sciences, Volume XLI-B8, 2016 XXIII ISPRS Congress, 12–19 July 2016, Prague, Czech Republic
This contribution has been peer-reviewed.