INVISTIGATION ON CANOPY HEIGHT AND DENSITY DIFFERENTIATIONS IN THE
MANAGED AND UNMANAGED FOREST STANDS USING LIDAR DATA (CASE
STUDY: SHASTKALATEH FOREST, GORGAN)
Sh. Shataee a*, J. Mohammadib
a Associate Professor, Forestry Department, Forest Sciences Faculty, Gorgan University of Agricultural Sciences and Natural Resources, 386, Gorgan, Iran - [email protected]
Assistance Professor, Forestry Department, Forest Sciences Faculty, Gorgan University of Agricultural Sciences and Natural Resources, 386, Gorgan, Iran - [email protected]
KEY WORDS: Canopy height, Canopy density, Lidar, Managed forest, Unmanaged forest, Dr. Bahramnia forest plan of Gorgan
ABSTRACT:
Forest management plans are interesting to keep the forest stand natural composite and structure after silvicultural and management treatments. In order to investigate on stand differences made by management treatments, comparing of these stands with unmanaged stands as natural forests is necessary. Aerial laser scanners are providing suitable 3D information to map the horizontal and vertical characteristics of forest structures. In this study, different of canopy height and canopy cover variances between managed and unmanaged forest stands as well as in two dominant forest types were investigated using Lidar data in Dr. Bahramnia forest, Northern Iran. The in-situ information was gathered from 308 circular plots by a random systematic sampling designs. The low lidar cloud point data were used to generate accurate DEM and DSM models and plot-based height statistics metrics and canopy cover characteristics. The significant analyses were done by independent T-test between two stands in same dominant forest types. Results showed that there are no significant differences between canopy cover mean in two stands as well as forest types. Result of statistically analysis on height characteristics showed that there are a decreasing the forest height and its variance in the managed forest compared to unmanaged stands. In addition, there is a significant difference between maximum, range, and mean heights of two stands in 99 percent confidence level. However, there is no significant difference between standard deviation and canopy height variance of managed and unmanged stands. These results showd that accomplished management treatments and cuttings could lead to reducing of height variances and converting multi-layers stands to two or single layers. Results are also showed that the canopy cover densities in the managed forest stands are changing from high dense cover to dense cover.
* Corresponding author
1. Introduction
The Hyrcanian original and natural forests in the northern Iran are almost high dense canopy cover and multi-layers vertical structure with high variance. Forest management plans are certificated approaches for applying forest managing and silviculture treatments programs to optimal forest management and keeping the forest stand natural composite and structure. The forest managers are interesting to aware of forest composite and structure situation before and after silvicultural and management treatments. In order to investigate on stand differences made by management plan, comparing of these stands with unmanaged stands as a nature of forests is necessary.
Traditional way to measure forest stucture and composits variables is field surveying by different methods and tools. These measurements are generally expensive, time-consuming and labour intensive, as well as difficult to perform, especially in mountainous and dense forests. Use of remote sensing tools and sources with different cappabilites and abilities is an alternative way particularly in large areas. Improving satellite data sources and classification methods offer new opportunities for obtaining more accurate forest biophysical maps. Rapid improvements in remote sensing technology have led to various types of sensors, such as multispectral, hyper spectral, ultraviolet, thermal sensors, light detection and ranging (Lidar), radio detection and ranging (radar), and other sensors. Each type of sensor has been designed for specialized purposes, tasks, and different applications. These new potential sources have been shown to be appropriate tools to assess and monitor forest attributes with reasonable accuracy levels.
The optical sensors in visible and infrared wavelengths are producing information based on registering reflectances of objects in diferent radiometric, spectral, and spatial resolutions. The optical aerial/satellite imagery usually presents two-dimensional spectral information and reflectance responses of a canopy cover’s surface. Launching of many satellites providing data of submetric ground resolution can be usefull for accurate detection forest variables. However, LiDAR data from an airborne laser scanner (ALS) provides semi three-dimensional data set relating to canopy cover and canopy height. Nasset (1998 and 2002) demonstrated that lidar data for plot-based estimation error of maximum and mean canopy height with full canopy closure is less than 0.5 meters. Capacity of LiDAR data to estimate vertical and horizontal canopy structure of stands was studied in the some research such as Coops et al (2007). In this study, different of canopy cover density and crown height variances between managed and unmanaged forest stands were investigated in Dr. Bahramnia forest management plan in managed forest stands and unmanged forest stands as well as in two dominant forest types using Lidar data.
2. Material and Methods: 2.1. Study area
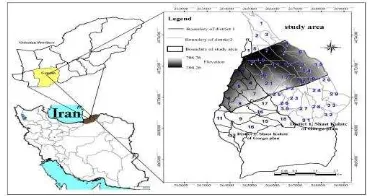
The study area comprises 1100 hectares in the Southeast part of the Golestan province, Eastnorth of Iran, with elevation ranging from 270 to 740 m above mean sea level (Figure 1). The research was done on managed (parcls of 4 to 24 seri1) and unmanged (parcls of 2 to 7 of seri 2 Dr. Bahramnia forestry plan) stands. The previous forest silviculture treatment method in managed stands was shelterwood cutting (1972-1992), however, they are currently treating by single tree selection and cutting (close to nature) method.
Fig.1: Location of study area in the Golestan province of Iran
2.2. Field data
We applied a systematic random sampling method to collect field data with 150×200 meter network (3.33% sampling intensity) and plots were circular with 0.1 ha. Totally, the 308 plots (219 plots in managed and 87 plots in unmanged stands) were measured in study area. In each plot, hieht of all trees with a diameter greater than 12.5 cm at breast height was measured by Vertex VL 402 device. The geographic center of each plot was recorded using a differential GPS (Trimble R3) device.
2.3. Lidar data:
Rayan Naqshe Company acquired the laser scanner data for this study under leaf on canopy condition on the 12th of October 2011using Riegl LMS Q5600 laser scanning system. The laser wavelength and mean point density are 1064 nm and about 4 m2, respectively. In addition, the flight elevation was approximately 1000 m above the ground. For more information please look at the table 1.
Table 1: LMS Q560 Riegl charestrictistics
2.4. Proces sing Lidar data:
Rayan Naqshe Company using RayAnalyze software analyzed the full-wave form data. The delivery consist of point data coordinate together with additional parameters width, amplitude, number of target within laser beam and total number of target within laser beam. In addition, the points cloud Lidar data using RiProcess software classified in first, last and other pulses. Rayan Naqshe Company accomplished initial processing of laser data. After processing, it observed that there are many noises in the last, first and other pulses. Therefore, all outliers with exceeder than 50 meters in last, first and other pulses were removed using Terrascan software.
The last pulses data were used to create to the bare earth surface using Kraus and Pfeiffer and fusion software. A triangulated irregular network (TIN) was used to create a digital terrain model (DTM) using X, Y and Z (height) values of the individual terrain ground points acquired from Kraus and Pfeiffer algorithm (1998) with spatial resolution of 1m. The
Minimum Range 30
Accuracy 20
Precision 10
Laser Wavelength NIR (1069)
Scan Angle Range ±22.5 ,±30
Laser Beam Divergence
0.5 mrad
Laser puls speed (KRZ) 240
average measurement density 4
Vertical accuracy <50
Accuracy horizontal <30
IMU IMU-lle
IMU sampling rate 400
DTM accuracy was assessed using 90 ground elevation points recorded by DGPS. The results showed that mean elevation differences between DTM and DGPS points were less than 40cm. In addition, a one-meter resolution digital surface model (DSM) was created using first and last pulses data by TIN algorithm in Fusion software. Then, canopy height model (CHM) was created using DTM and DSM models and applying 2 meters height break in Fusion software. The accuracy of CHM was assessed by height of 90 trees measured by Vertex VL 402 device. The results showed that the mean height difference between CHM and height of ground trees was less than 90cm. Then, according to previous study (Naesset, 2002, 2004) and Hureich and Thoma (2008), height metrics and canopy cover metrics were extracted using Fusion software with considering pixel size of 31.623×31.623 m corresponding to plot size (1000 m2). Canopy height structure metrics in plot level were extracted by Fusion software (Table 2).
Table 2: Plot based canopy height structure metrics Height metrics
Height Percentiles
hp0, … … hp90
Hmax Maximum Height of points in plots
Hmin Minimum Height of points in plots
Hmean Mean Height of points in plots
Hmedian Median Height of points in plots
Hcv Coeficient variance of height points in plots
hSD Standard deviation of height points in plots
Hskeewness skewnes of height points in plots
Hkurtosis kurtosis of height points in plots
Hvariance variance of height points in plots
Statistical significant analysis:
In order to comparing the hieght change and percent canopy cover status in the managed and unmanaged stands, General statistical measures and significant analyses were done by independent T test between two stands as well as between two same dominant forest types (i.e. Carpinus-Parrotia and Parrotia-Carpinus).
Results:
Table 3 shows the statistics measures of canopy cover metrics extracted on Lidar data in managed stand (seri 1) and unmanged stands (seri2). The statistics measures of canopy cover metric of forest types extracted from Lidar data in unmanaged and managed stands are showed in tables 4 and 5.
Table 3: Statistics measures of canopy cover metric extracted from Lidar data in managed and unmanged stands
Table 4: Statistics measures of canopy cover metric of Carpinus-parrotia forest type extracted from Lidar data in
managed and unmanged stands
Table 5: Statistics measures of canopy cover metric of Parrotia- carpinus forest type extracted from Lidar data in managed and
unmanged stands
Results of significant different of percent canopy cover (extracted by Lidar data) between managed and unmanged stands using independent T-test showed that there is not significant different between two stands in 95 percent confidence level (table 6) as well as in same forest type (table 7 and 8).
Table 6: Results of significant analysis of percent canopy cover in managed and unmanged stands
Significant level
ns insignificant in 95 percent confidence level
Table 7: Results of significant analysis of percent canopy cover of Parrotia- carpinus forest type in managed and unmanged
stands
ns insignificant in 95 percent confidence level
Table 8: Results of significant analysis of percent canopy cover of Carpinus-parrotia forest type in managed and unmanged
stands
ns insignificant in 95 percent confidence level
Results of significant different of canopy structure metrics extracted by Lidar data between managed and unmanaged stands using independent T-test (table 9) and forest type of both stands (tables 10 and 11) showed that in some canopy hight attributes there is significant different, however in some cases there is not insignificant different.
Table 9: Results of significant analysis of canopy height in managed and unmanged stands
**si gnificant in 99 percent confidence level., ns insignificant in 95
percent confidence level
Table 10: Results of significant analysis of canopy height of Carpinus-parrotia forest type in managed and unmanged stands
**si gnificant in 99 percent confidence level., ns insignificant in 95
percent confidence level
Table 11: Results of significant analysis of canopy height of Parrotia-carpinus forest type in managed and unmanged stands SD (%)
Minimum canopy height
-6.53
Minimum canopy height
-4.459
**significant in 99 percent confidence level., ns insignificant in 95 percent confidence level
Conclusion:
. In this study, different of canopy cover density and crown height variances between managed and unmanaged forest stands were investigated using Lidar data and statistical significant analysis. The significant analyses were done by independent T-test between two stands in same dominant forest types. Results showed that there are no significant differences between canopy cover mean in two stands as well as forest types. Result of statistically analysis on height characteristics showed that there are a decreasing the forest height and its variance in the managed forest compared to unmanaged stands. In addition, there is a significant difference between maximum, range, and mean heights of two stands in 99 percent confidence level. However, there is no significant difference between standard deviation and canopy height variance of managed and unmanged stands. These results showd that accomplished management treatments and cuttings could lead to reducing of height variances and converting multi-layers stands to two or single layers. Results are also showed that the canopy cover densities in the managed forest stands are changing from high dense cover to dense cover.
References:
Anderson, E. S., Thompson, J.A., Austin, R.E. 2005. Lidar density and linear interpolator effects on elevation estimates. International Journal of Remote Sensing, 26 (18): 3889–3900. -Axelsson, P. 1999. Processing of laser scanner data— algorithms and applications. ISPRS Journal of Photogrammetry and Remote Sensing. 54 (2–3): 138–147. - Ackermann, F. 1999. Airborne laser scanning—present status
and future expectations. ISPRS Journal of Photogrammetry and Remote Sensing, 54: 64–67.
- Baltsavias, E.P. 1999. A comparison between photogrammetry and laser scanning. ISPRS Journal of Photogrammetry and Remote Sensing, 54: 83–94
- Cartus, O., Kellndorfer, J., Rombach, M., and Walker, W. 2012. Mapping Canopy Height and Growing Stock Volume Using Airborne Lidar, ALOS PALSAR and Landsat ETM+. Remote Sensing, 4: 3320-3345
-Cuesta, J., Chazette, P., Allouis, T., Flamant, P. H., Durrieu, S., Sanak, J., Genau, P., Guyon, D., Loustau, D. and Flamant, C. 2010. Observing the Forest Canopy with a New Ultra-Violet Compact Airborne Lidar. Sensors, 2010, 10: 7386-7403 -Erdody, T. L., and Moskal, L. M. 2009. Fusion of lidar and
Imagery for Estimating Canopy Fuel Metrics in Eastern Washington Forests, American Society for Photogrammetry & Remote Sensing 2009 Annual Conference, Baltimore, MD, March 2009.
- Gaveau, D. L. A., and Hill, R. A. 2003. Quantifying canopy height under estimation by laser pulse penetration in small-footprint airborne laser scanning data. Canadian Jornal of Remote Sensing, 29: 650-657.
- Haala, N., and Brenner, C. 1999. Extraction of buildings and trees in urban environments. ISPRS Journal of
Photogrammetry and Remote Sensing, 54:130–137.
- Hawbaker, T.J., Gobakken, T., Lesak, A., Trømborg, E., Contrucci, K., and Radeloff, V. 2010. Light detection and ranging-based measures of mixed hardwood forest structure. Forest Science, 56(3): 313-326, 14.
- Hoffman-Wellenhof, B., Lichtenegger, H., Collins, J. 2001. Springer–Wien, New York. 371p.
- Heritage, G.L., and Large, A.R.G. 2009. Laser scanning for the environmental sciences. Wiley-Blackwell press. 278p. - Heurich, M., and Thoma, F. 2008. Estimation of forestry
stand parameters using laser scanning data in temperate, structurally rich natural European beech (Fagus sylvatica) and Norway spruce (Picea abies) forests. Forestry, 81(5): 645-661.
- Holmgren, J. 2004. Prediction of tree height, basal area and stem volume in forest stands using airborne laser scanning. Scandinavian Journal of Forest Research, 19(6): 543 – 553. - Hyyppä, J., Hyyppä, H., Litkey, P., Yu, X., Haggrén, H.,
Rönnholm, P., Pyysalo, U.,. Pitkänen, J., and Maltamo, M. 2004. Algorithms and methods of airborne laser scanning for forest measurements. International Archives of Photogrammetry, Remote Sensing and Spatial Information Sciences XXXVI (8/W2), 82–89.
- IGI mbh. 2013. AERO office, GPS/IMU processing, Direct Georefrecing and intergrated sensor orientation, www.igi-systems.com, Germany, 1p.
- Kane, V.R., McGaughey, R. J., Bakker, J.D., Gersonde, R.F., Lutz, J.A., and Franklin, J.F. 2010. Comparisons between field- and LiDAR-based measures of stand structural complexity. Can. J. For. Res. 40(4): 761-773. doi:l0.1139/X10-024.
- Kraus, K., and Pfeifer, N. 1998. Determination of terrain models in wooded areas with airborne laser scanner data, ISPRS J. Photogrammetry remote sensing. 53, 193-203. - Lemmens, M. 2011. Airborne lidar. In: Gatrell, J.D., Jensen,
R.R. (Eds.), Geoinformation, Geotechnologies and the Environment, vol. 5. Springer, Netherlands, pp. 153–170. - Lloyd, C.D., Atkinson, P.M. 2002. Deriving DSMs from
LiDAR data with kriging. International Journal of Remote Sensing. 23, 2519–2524.
- Liu, X. 2008. Airborne LiDAR for DEM generation: some critical issues. Progress in Physical Geography. 32, 1, 31–49. - Magnusson, M. 2006. Evalution of remote sensing techniques
for estimation of forest variables at stand level. PhD, Thesis, Swedish University of agricultural sciences, Umea, 38p. - Maguya, A.S., Junttila, V., and Kauranne, T. 2013. Adaptive
algorithm for large scale dtm interpolation from lidar data for forestry applications in steep forested terrain. ISPRS Journal of Photogrammetry and Remote Sensing. 85, 74–83.
- Marks, K., Bates, P. 2000. Integration of high resolution topographic data with floodplain flow models. Hydrological processes. 14, 2109-2122.
- Meng, X., Currit, N., Zhao, K. 2010. Ground filtering algorithms for airborne LiDAR data: a review of critical issues. Remote Sensing. 2, 833–860.
- Mongus, D., Z˘ alik, B. 2012. Parameter-free ground filtering of LiDAR data for automatic DTM generation. ISPRS Journal of Photogrammetry and Remote Sensing. 67, 1–12.
- Moskal, L. M., Erdody, T., Kato, A., Richardson, J., Zheng, G. and Briggs, D. 2009. Lidar applications in precision forestry. Silvilaser2009, Washington, USA,
http://depts.washington.edu/rsgal/pubs/Moskaletal_Silvilaser2 009.pdf.
- Næsset, E., and Bjerknes, K.O. 2001. Estimating tree heights and number of stems in young forest stands using airborne laser scanner data. Remote Sensing of Environment, 78: 328-340.
Minimum canopy height
-1.432
- Næsset, E. 2002. Predicting forest stand characteristics with airborne scanning laser using a practical two-stage procedure and field data. Remote Sensing of Environment. 80, 88-99. - Næsset, E. 2004. Accuracy of forest inventory using airborne
laser scaning: evaluating the first Nordic full-scale operational project. Scandinavian Journal of Forest Research. 19, 6, 554-557.
- Naesset, E. 2007. Airborne laser scanning as a method in operational forest inventory: Status of accuracy assessments accomplished in Scandinavia. Scandinavian Journal of Forest Research, 22 (5): 433 – 442.
-Næsset, E. 2011. Estimating above-ground biomass in young forests with airborne laser scanning. International Journal of Remote Sensing, 32, 473–501.
- Nelson, R., Krabill, W., and Tonelli, J. 1988. Estimating forest biomass and volume using airborne laser data. Remote Sensing of Environment, 24: 247–267.
- Price, W.F., and Uren, J. 1989. Laser surveying, London Van Nostrand reinhold international.
- Rutledge, A. M. and Popescu, S. C. 2006. Using Lidar in determining forest canopy parameters. ASPRS Annual Conference, Reno, Nevada, May 1-5.
- Shataee, Sh. 2013. Forest attributes estimation using aerial laser scanner and TM data, Forest systems journal, 22(3): 484-496.
- Smart, L.S., Swenson, J.J., Christensen, N.L., and Sexton, J. O. 2012. Three-dimensional characterization of pine forest type and red-cockaded woodpecker habitat by small-footprint, discrete-return lidar. Forest Ecology and Management, 281: 100-110.
- Smith, S. L., Holland, D. A., and Longley, P. A. 2005. Quantifying interpolation errors in urban airborne laser scanning models. Geographical Analysis, 37: 200–224. - Smith-voysey, S. 2006. Laser scaning (Lidar): A tool for
future data collection, Ordance survey research labs annual review 2005-06, Southampton: Ordnance survey.
- Tonolli, S., Dalponte, M., Neteler, M., Rodeghiero, M., Vescovo, L., and Gianelle, D., 2011b. Fusion of airborne LiDAR and satellite multispectral data for the estimation of timber volume in the Southern Alps. Remote Sensing of Environment, 115: 2486–2498.
- Wehr, A., Lohr, U. 1999. Airborne laser scanning an introduction an overview. Journal of Photogrammetry and Remote Sensing, 54: 68-82.
- Vosselman, G. 2000. Slope based filtering of laser altimetry data. International Archives of Photogrammetry, Remote Sensing and Spatial Information Sciences XXXIII (B3/2؛ Part 3), 935–942.
- Zhao, K., Popescu, S., Meng, X., Pang, Y., and Agca, M. 2011. Characterizing forest canopy structure with lidar composite metrics and machine learning. Remote Sensing of Environment, 115:1978–1996