Enhancing DInSAR capabilities for landslide monitoring by applying GIS-based multicriteria
filtering analysis.
Fasil Beyene, Steffen Knospe, Wolfgang Busch
Clausthal University of Technology, Institute of Geotechnical Engineering and Mine Surveying, Erzstrasse 18, D-38678 Clausthal-Zellerfeld, Germany,
Email: [email protected]
KEY WORDS: Landslide monitoring, DInSAR, GIS multicriteria analysis
ABSTRACT:
Landslide detection and monitoring remain difficult with conventional differential radar interferometry (DInSAR) because most pixels of radar interferograms around landslides are affected by different error sources. These are mainly related to the nature of high radar viewing angles and related spatial distortions (such as overlays and shadows), temporal decorrelations owing to vegetation cover, and speed and direction of target sliding masses. On the other hand, GIS can be used to integrate spatial datasets obtained from many sources (including radar and non-radar sources). In this paper, a GRID data model is proposed to integrate deformation data derived from DInSAR processing with other radar origin data (coherence, layover and shadow, slope and aspect, local incidence angle) and external datasets collected from field study of landslide sites and other sources (geology, geomorphology, hydrology). After coordinate transformation and merging of data, candidate landslide representing pixels of high quality radar signals were filtered out by applying a GIS based multicriteria filtering analysis (GIS-MCFA), which excludes grid points in areas of shadow and overlay, low coherence, non-detectable and non-landslide deformations, and other possible sources of errors from the DInSAR data processing. At the end, the results obtained from GIS-MCFA have been verified by using the external datasets (existing landslide sites collected from fieldworks, geological and geomorphologic maps, rainfall data etc.).
1. INTRODUCTION
SAR data acquired by recent high resolution radar satellites are
increasingly being used in slope stability assessment and
monitoring of landslide (Singhroy 2005, Ferretti et al. 2005).
The different Line-of-Sight (LOS) imaging capability of
TSX/TDX and combining data from different tracks have also
increased its suitability for slope instability assessment and
monitoring of landslides, especially in mountainous terrains.
However, owing to the nature of high radar viewing angles and
related spatial distortions (such as overlays and shadows),
temporal decorrelations due to vegetation cover, and speed and
direction of target sliding masses, monitoring of landslides
using conventional DInSAR methods remains difficult.
2. SAR DATA ACQUISITION
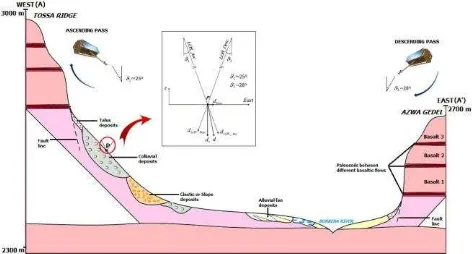
The area selected for this study, the central part of Dessie town
and its environs, Ethiopia, is bounded by steep mountain ranges
that run from North-South direction. To match the SAR data
acquisition with the topography of the area, the appropriate look
angles were considered in both ascending (~25°) and
descending (~28°) SAR acquisition geometries. In such a way
that as satellite sensors acquire data over the ascending tracks
looking towards the east direction, the slope instability or
deformation phenomena mainly along the hillsides of Tossa
fault scarp will be effectively monitored. On the other hand, the
slope failures along the Azwa valley slope facets will be
detected by satellite in the descending orbits, as it looks towards
the west.
Figure 1. The selected image acquisition geometries in relation to the local topography and target landslide body
3. METHODOLOGY
The proposed work procedure (Figure 2.) in this research work
monitoring by systematically extracting landslide representative
candidate deformation points (DPs) or excluding DPs which are
affected by noise sources or non-relevant deformations with
respect to landslide phenomena. To achieve this, first regularly
spaced grid points are created in map coordinate system
encompassing the whole area of the raster datasets. The
displacement maps, representing the LOS displacement phase
component, in radar coordinate systems are projected to the
map coordinate system so that extraction of raster point and
data integration with the other GIS datasets (non-radar or
external data sources (GPS measurements, geological,
structural, hydrological data, soil moisture etc.) can be
plausible. To achieve this, a GIS based multicriteria filtering
analysis (GIS-MCFA) is used to filter out candidate landslide
pixels or deformation points (CL-Ps/CL-DPs). Appropriate
criteria have been applied to exclude the possible error sources
of DInSAR and unwanted deformations recorded by the radar
sensors (such as uplifting or upward motions). Finally, the
result of the GIS-MCFA have been further analysed by using
time-series curves and interpreted by overlaying with external
datasets.
The original SAR data required for this analysis was processed
in radar coordinate system by using conventional 2-pass
DInSAR method. Hence, for the purpose of GIS-MCFA, all the
radar origin datasets have been transformed from radar
range-Doppler coordinates to geographic coordinate system. The
general work procedures followed to process the GIS-MCFA
datasets are indicated in the workflow (Figure2.).
A GRlD-DP model is used to represent the pixel location and
values of DInSAR LOS displacement maps as a grid of
deformation points (DPs). In addition to displacement maps,
other radar derived maps (such as coherence, slope/aspect,
overlay/shadow etc.) and external source datasets (landslide
site, GPS, geology and geomorphology, hydrological, land use
and land cover etc.) are converted into a grid of points. These
radar and non-radar origin point datasets have the same spatial
extent, so that they can be merged into a single vector file with
many attributes.
GIS-MCFA data analysis easier. In this sense, GRID-DP model
can be consider as an extraction tool to extract the valuable
numerical information from radar, and external vector and raster
data sources.
Figure 2. The workflow of data analysis.
The compaction of all the necessary raster datasets into a single
point dataset has the following main advantages.
Comparison between deformation values extracted from many raster maps and spotting phase
unwrapping error/s incurring pixel/s in spreadsheet formats is
easier.
Relatively less data storage requirement is fulfilled. As many raster data layers are compacted into a single
vector file format, the size of the resulting data will largely be
reduced, and the data analysis, which would have been
cumbersome to do it in raster format, can be practical.
Furthermore, it allows us to work flexibly and comfortable in
other common spatial data processing software.
3.1 GIS-based multicriteria filtering analysis
The main goal of GIS based multi-criteria analysis
(GIS-MCFA) is to filter out candidate landslide pixels or deformation
points (CL-Ps/CL-DPs) from the line-of-sight displacement
values of radar images extracted in grid format by converting
each radar displacement image pixel into DPs and setting
relevant filtering criteria. In order to achieve that the extracted
LOS displacement values were merged with other helpful
parameters like coherence and geometric parameters
(slope/aspect, layover and shadow, and local incidence angle)
classified into overlay/shadow and/or normal (slant range
resolution), coherent and/or low-coherent, stable and/or
non-stable, uplifting and/or subsiding pixels so as to filter out the
landslide areas (Error! Reference source not found.1.).
Considering the phase difference between two radar images
acquired over the same area, the LOS displacement values
calculated from these images represent the components of the
phase related to geometric displacements of objects and other
error sources due to (residual topography, atmosphere
disturbances, orb it and phase decorrelation noise). In other
words, the displacement values in the radar images consists of
areas covered by overlay/shadow, phase noise, coherent and/or
low-coherent, stable and/or non-stable, uplifting and/or
subsiding pixels. Accordingly, the GRID-DPs data are broadly
classified by using parameters that control the deformation
nature (based on the speed and direction of motion) and the
error sources of the data.
3.1.1 Error control parameters:
These parameters are set to exclude the data gaps related to the
geometric distortion in the high slope or mountainous areas
(such as overlay/shadow and foreshortening) and phase errors
as a result of low coherence.
3.1.2 Deformation control parameters
SAR sensors have limitations in monitoring landslide motion
above a certain speed and direction of motion due the
wavelength range they operate and side-looking nature of radar
sensors. Thus, these controlling parameters are re-classified as:
(1) Speed of Motion: extremely fast and extremely slow motions
(2) Direction of Motion: non-LOS (non-line-of-sight) motion, upwards and downwards motions
3.1.3 DP filtering criteria
In order to filter out the optimal CL-Ps/CL-DPs of high quality
radar signals that best represent the landslide sites from a grid
model, the following six filtering criteria were considered. The
ASC and DSC orbit data were treated separately during the
multicriteria filtering analysis.
3.1.3.1
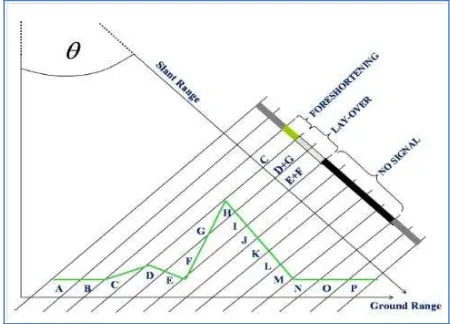
Shadow and OverlayDue to side-looking nature of SAR sensors, spatial distortions
(such as shadow and overlay) occur in the radar images. These
distortions appear to be worse in areas of high topographic
relief where slope instabilities often occur. As illustrated in
(Figure 2.) below, areas between points J and N cannot be
illuminated by the radar beam. As a result, SAR resolution cells
from J to N do not record any radar signal from the ground and
they appear dark on the image. Hence, DPs falling in the
shadow regions should be eliminated from grid.
On the other side, DPs that are located at increasing ground
range positions can be imaged in reverse order by the SAR
system (as depicted by letters F, G, H, and I). In addition, they
are recorded in the same SAR resolution cells as DPs located on
D and E, which belong to a different area on the ground. These
DPs are directly or indirectly affected by layover and effect of
overlay. Similarly, DPs that fall in overlay zone should be
eliminated from grid.
Figure 2. The different geometric distortions in(such as overlay and shadow) explained as the 3D image is projected onto a 2D plane (Ferretti et al. 2007).
The overlay/shadow map used to exclude DPs was generated by
using a gc_map algorithm in gamma software. However, it is
also possible to calculate the part of a given area affected by
overlay/shadow from digital elevation information, more
specifically if we know the slope and look angle or depression
angle of the radar antenna. For this project, look angles are
approximately 25° and 28° for radar images acquired from
ascending and descending orbits respectively. Hence, areas will
be affected by overlays or its effects if the slope angle (u) is
greater than look angle . Similarly, shadows are a result of
than depression angle, , irrespective of the satellite orbit
direction in both cases (Colesanti and Wasowski 2006). The
depression angle is complementary to the look angle.
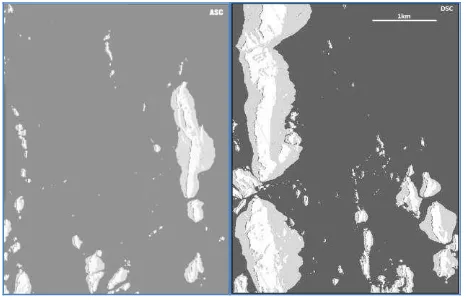
Figure 1. The overlay/shadow maps of the project area showing the areas affected by different distortion effects in ascending (left) and descending (right).
3.1.3.1
CoherenceThe presence of several scatterers within each SAR resolution
cell generates speckle effects to SAR images. Pixels around
these areas are affected by different kinds of error sources, and
often cause also difficulties in phase unwrapping process.
Hence, DPs falling in these areas should be removed from the
GRID-DP. The coherent map used to identify low-coherent DPs
from the grid and DPs with a coherent value less than 0.35 were
removed.
3.1.3.1
Geology and geomorphologyThe main moving masses in the area of interest are usually
consists of secondary deposits or sediments which are formed
due to the recent mass wasting processes (Tenalem and
Barbieri, 2005, Fubelli et al. 2008). However, there are some
known locations which are identified as non-susceptible to the
occurrence of landslides due to a unique geological
geomorphological formation.
Though the exposed basalts within the study area have
undergone variable degrees of chemical and physical
weathering, and are exposed to rock falls and topples
(especially around the fault escarpments of Tossa and Azwa
Gedel) (Tenalem and Barbieri 2005, Fubelli et al. 2008), but
they are not expected to experience slow moving type of motion
which can be monitored by DInSAR methods. Hence, for this
particular project, it is logical to exclude these areas from the
DInSAR based monitoring.
3.1.3.2
Extremely fast motionSAR images acquired by radar satellites can only record
motions at scale of spatial and temporal resolution of the
imaging sensor (Massonnet and Feigl 1998). Assuming that
topographic fringes are properly removed from interferograms
using external source digital elevation model, each fringe
corresponds to change in range of half of the radar wavelength
( /2) where = 31mm and t = 11 days for TSX/TDX. The
phase measurements are modulo-2 which corresponds to /2
and the time span covered by interferogram exceeds /4 when
such kind of fast motions occurred. Consequently, the
interferograms remain incoherent because the detectable motion
range is exceeded. As result, DInSAR experience problem in
detection of such kind of fast ground deformations due to loss
of coherence in the interferogram.
The mountain flanks having very steep slope angle greater than
45° usually experience very to extremely fast moving landslides
such as rock fall or avalanche, topple. Nevertheless, these kind
of fast movements are difficult to detect by currently available
DInSAR technology (Colesanti and Wasowski 2006).
3.1.3.1
Extremely slow motion“Extremely slow motion” are defined for this particular GIS-MCFA purpose as stable areas or extremely slow moving
landslides that are not our interest of highest importance. This
is, first, partly because of a little threat on human-life as they
give us time to react against them or the relative minimal risk
they pose on infrastructure.
This is, in fact, a very controversial parameter as there is a
possibly of reactivation of landslide motion after a certain
dormant period following anomalous rainfalls or sudden shakes.
However, this selection criterion remains very important
because it helps to differentiate the stable and non-stable DPs at
least for a single and/or if we are lucky for many more
successive acquisitions. Thus, it is logical to use this parameter
to control the nature of deformation for these specific
identified and separated from stable places by setting a
controlling threshold value for DPs in each scene. As per the
critical observation of the processed data, the assumed
controlling threshold value for this criterion was 1mm per each
11 days acquisition period, the shortest revisit for the datasets
available. In this context, if the recorded DPs values are found
to be below 1mm, then they will be assigned to extremely slow
moving or stable DPs and extracted from the GRID Model.
3.1.3.1
Non-los motionSAR satellites are only able to measure movements in the
line-of-sight (LOS) direction. The registered displacement along
LOS could only be the same as that of the real displacement
(i.e. 100 % preserved) when the displacement is parallel to the
LOS. In the contrary, the detectable motion could reduce to 0 %
if the displacement direction is parallel to the azimuth direction
(flight direction of the satellite) (Metternicht et al. 2005). This
implies that SAR systems have limitations in measuring
movements along azimuth or close to N– S direction (Error!
Reference source not found.).
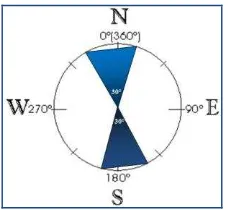
As illustrated in (Figure 4.), the percentage of detectable
movement by SAR sensor decreases as the orientation of the
slope dip direction closes to the direction of flight. For the sake
of simplicity and use in MCFA, it is logical to assume that the
amount of motion to be measured from slopes facing azimuth
directions (some 30° N-S from azimuth direction) are too small
to be measurable or negligible by the SAR sensor. For example,
for the TSX/TDX ascending data, the N-S facing slopes are
identified as 0°<v<7°, 337°<v<360° (north oriented slopes) and
157°<v< 187° (south facing slopes), where v is the aspect angle
of the slope. Consequently, DPs falling along these zones
should be eliminated from the GRID-DP.
Figure 4. The assumed minimum view range of movement detection, i.e. 30° in pro et contra flight direction for ascending pass as an example.
The slope aspect map of the study area has been used to identify
slopes close to the satellite flight directions, and classify the
entire area with respect to the satellite look direction.
3.1.3.2
Upwards motionSome active surface deformation processes related to
endogenous processes (such as tectonic and volcanic activity)
may result in the upward surface motions. However, such types
of motions are not the interest of this project. Thus, these types
of motions can be identified by carefully analyzing the SAR
acquisition geometry and the landslide motion direction.
Thus, for slope facing east, non-landslide or upwards moving
pixels or DPs are filtered out from the GRID-DP as follows
(refer section Error! Reference source not found. for
visualization of variables or symbols used in this section and
further details on the topic):
Ascending orbit, DPs >0.0 mm represent upward motion. In fact, if the local slope angle (u) is greater
than the depression angle ( ) of SAR sensor, i.e.
>62°, then DPs are in shadow region.
Descending orbit, DPs are affected by layover and/or foreshortening, and their effects. That is, if the local
slope angle is greater than the look angle, u>28°, then
DPs are affected by layover or its effect, and
conversely, if u<28°, then DPs fall in foreshortening
zones.
For slope facing west,
Ascending orbit, DPs are affected by layover and/or foreshortening, and their effects.
Descending orbit, DPs > 0.0 mm represent upward motion. For the same reason, if >62°, then DPs are
affected by shadow effect.
3.1.3.3
Downwards motionLandslide candidate DPs are finally filtered out using this
upwards motion, it is easy to filter out the landslide or
downslope motion representing DPs from the GRID-DP.
For slope facing east,
Ascending orbit, DPs < 0.0 mm represent downwards or landslide motion. The depression angle ( ) for
ascending orbit was 65°. That is, if >65°, then DPs
are in shadow region.
Descending orbit, DPs are affected by layover and/or foreshortening. By the same fashion, if the local slope
angle is greater than the look angle, u>25°, then DPs
are affected by layover or its effect, and conversely, if
u<25°, then DPs fall in foreshortening zones.
For slope facing west,
Ascending orbit, DPs are affected by layover and/or foreshortening.
Descending orbit, DPs < 0.0 mm represent downwards or landslide motion.
3.1.3.4
Error DPIt is common to experience data gaps in DInSAR analysis that
are often associated with the use of external DEM data for
topographic phase removal, and masking of low coherence
pixels during phase unwrapping process. Though they are
excluded from affecting the results of DInSAR analysis, the
error pixels persist throughout the process. The masked areas
are represented in the resulting displacement map with the value
of 0.0.
3.1.4 GIS-MCFA analysis summary
Each of the multiple criteria considered in the GIS-MCFA
analysis had a distinctive interest in identifying the potential
landslide representative DPs. Some of the filtering criteria have
been used to remove the different noise sources attributed to
SAR data. For instance, the geometrically distorted pixels or
DPs as a result of high topography in the study area were
filtered out through filtering criteria like “layover/shadow” and
“extremely fast motion”. Others control the deformation phenomena in terms of the direction of motion and speed of
motion. As illustrated in the summary statistics Error!
Reference source not found., and comparison bar diagram, Figure 3-2, each individual filtering criterion played its own
significant role in filtering or excluding these error sources, and
DPs affected by unwanted deformation signals from the grid.
All of the filtering criteria were equally applied for both
ascending and descending radar data. However, the number of
DPs affected in each of the acquisition geometries was variable.
For example, if we consider the first criterion considered, i.e. “shadow and layover”, the number of DPs affected by this criterion in both acquisition geometries were relatively high,
and the number in descending excel more than twice than in
ascending. Only a few number of DPs (less than 30,000 DPs in
both ascending and descending data) were removed by applying some criteria like “extremely fast motion”. On the contrary, much of the DPs were excluded from GRID using filtering criteria like “extremely slow motion”, “geology and geomorphology”, and “excluded slopes”. Because some slopes
are facing east in descending and west in ascending flight
directions, they are suffered from geometric distortions.
Noisy/error and unwanted deformation DPs were removed from
a GRID sequentially one after the other (Table 1.). After
removing all the possible noisy and unwanted DPs, the total
remaining potential landslide representative DPs were 21972
and 12811 in ascending and descending SAR acquisition
Table 1. Summary of the GIS-MCFA analysis
The use of both ASC and DSC data enhanced the coverage of
landslide detection, as ascending is suitable for slope facing
towards to east (eastern slopes) and descending for western
slopes (Notti et al. 2010, Colesanti et al. 2006). Using the two
applied acquisition geometries in Dessie, it was possible to
detect around 32% of landslide in ascending and 12.5% of
landslide in descending orbits. The application of ASC and
DSC data enabled the investigation of the entire area of interest.
The nature of landslide motion (speed and direction) has also
controlled motion of a given landslide body to be along LOS
and the rate of displacement not to exceed the detectable rage of
the SAR sensor. The exposed steep slope areas and built-up
sections of the city have revealed high coherent DPs. However,
filtering criteria that control speed of motion (“extremely fast motion” and “extremely slow motion”) have constrained these DPs as the target landslide bodies are set to be slow moving
landslides in unstable sites. Consequently, areas of extremely
fast slope movements (slopes greater than 45°) around steep
slopes and stable areas in the city center were excluded from
analysis.
Figure 3-2: Compares the DPs filtering criteria in ascending and descending orbits.
Figure
from filtering out landslide representative DPs and mapping of
landslide sites, the GIS-MCFA analysis helped to conduct a
pixel based classification of the entire study area. This enables
the study of specific target landslide bodies at their own original
resolution and accurate geographic location, and without the
need of generalization for the sake of simplicity. Based on the
selected filtering criteria, the entire study area was globally
classified as layover/shadow affected or not affected, low
coherence or high coherence, extremely fast or slow moving
landslide, stable or non-stable areas etc.
3.2 Results of GIS-MCFA
In the study area, the use of the GIS-MCFA and associated
time-series curves indicated an increase in displacement during
rainy months. April, July, and September were especially
identified with high potential of slope failures. The LOS
displacements recorded for a period of 11 months were in the range of −30 mm to +10 mm.
Finally, the GRID-DP model might be of a choice for
monitoring of slow moving landslides in mountainous terrains if
there is no enough number of scenes available for PS-InSAR
analysis, and want to integrate the radar data with external data
sources and variables for specific purpose analysis.
3.3 Reference
Colesanti, C. & Wasowski, J. (2006). Investigating landslides with space-borne Synthetic Aperture Radar (SAR) interferometry. Engineering geology, 88(3), 173-199. Ferretti, A., Monti-Guarnieri, A., Prati, C., Rocca, F., Massonet,
D. (2007).InSAR Principles-Guidelines for SAR Interferometry Processing and Interpretation (Vol. 19). ESA Publications.
Ferretti, A., Perissin, D., Prati, C., & Rocca, F. (2005, April). On the physical nature of SAR Permanent Scatterers. In: Proceedings of URSI Commission Symposium Microwave Remote Sensing of the Earth, Oceans, Ice, and Atmosphere, Ispra, Italy.
Fubelli G., Abebe Bekele, Dramis F., Vinci S. (2008). Geomorphological evolution and present-day processes in the Dessie Graben (Wollo, Ethiopia). Catena, 75, 28-37. Massonnet, D. & Feigl, K. L. (1998). Radar interferometry and
its application to changes in the Earth's surface. Reviews of geophysics, 36(4), 441-500.
Metternicht, G., Hurni, L. & Gogu, R. (2005). Remote sensing of landslides: An analysis of the potential contribution to geo-spatial systems for hazard assessment in mountainous environments. Remote Sensing of Environment, 98, 284-303.
Notti, D., Davalillo, J. C., Herrera, G., & Mora, O. (2010). Assessment of the performance of X-band satellite radar data for landslide mapping and monitoring: Upper Tena Valley case study. Natural Hazards and Earth System Sciences, 10, 1865-1875.
Singhroy V. (2005). Remote Sensing for Landslide Assessment: Chapter 16. In: Landslides Hazard and Risk, book edited by Glade Anderson and Crozier. Wiley Press. pp. 469–492.