APPLICATION OF SURFACE DEFORMATION MONITORING IN MINING AREA BY
THE FUSION OF INSAR AND LASER SCAN DATA
J.L. Huang a, K.Z. Deng a, , H.D. Fan a, J.K. Yang a a
School of Environment Science and Spatial Informatics, China University of Mining and Technology, Xuzhou 221116, China [email protected]
Commission VII, WG VII/6
KEY WORDS: D-InSAR, laser scan data, SRTM, GDEM, deformation, data fusion
ABSTRACT:
Differential Synthetic Aperture Radar Interferometry (D-InSAR) as a new earth observation technique has become an important tool for monitoring ground movements caused by underground coal mining. However, the low resolution and accuracy of Digital Elevation Model (DEM) cause more error value of InSAR line-of-sight(LOS) surface deformation measurement. In this paper, a couple of Radarsat-2 and a pair of TerraSAR with SRTM, GDEM and LiDAR DEM are processed respectively to reveal the subsidence basin and the results have been compared each other. It illustrate that the accuracy of D-InSAR results been better improved by the high accuracy and resolution DEM.
Corresponding author
1. INTRODUCTION
Ground surface movements commonly cause disturbance and damage for buildings and environment around the subsidence areas. The knowledge and prediction of the evolution of the temporal and spatial distribution of the movements are essential to delineate the most affected areas, to understand the mechanisms involved, and to establish counter measures to prevent damages. Underground mining activities always cause subsidence of the ground surface due to the advance of the excavation fronts and the progressive closure or collapse of the mineral extraction galleries. The magnitude of the displacements depends on different parameters, such as the depth of the mining galleries and the time elapsed since the onset and/or the abandonment of the excavation (Al-Rawahy, 1995; Bahuguna, 1995). The evolution of the subsidence of a point has been described by many authors through total station, levels and global positioning system etc.
In recent years, a new earth observation technique named Differential Synthetic Aperture Radar Interferometry (D-InSAR) has become an important tool for monitoring temporal and spatial ground movements. This method has clear advantages over classical monitoring methods, the first one is its high spatial coverage. Classical techniques measure ground displacements at a few discrete points while D-InSAR provides a more complete pattern of the displacements' field with measurements over awide area. Another advantage of the technique is the existence of a historical database of SAR images, which was started more than several decades ago, that enables the study of past situations(Yerro, A. 2013).Differential Interferometric Synthetic Aperture Radar (D-InSAR) is a technique for utilizing the phase difference between two SAR images acquired before and after the event with different look angles and a topographic signal from a DEM as correction to reveal the surface subsidence between acquisition times of two images. These techniques have been successfully applied to detect and measure ground subsidence in areas subjected to underground mining exploitation (Miao et al., 2008;Gueguen et al., 2009).In traditional, a resolution of 90m SRTM (Shuttle
Radar Topography Mission) as correction to reveal the surface subsidence between acquisition times of two images in D-InSAR. However the accuracy of SRTM DEM is approximately about 15-20m and the 90m resolution of SRTM DEM is rough for high resolution SAR images. In this experiment, the DEM derived from laser scan data has a vertical accuracy of 0.2m and a horizontal accuracy of 0.5m has been used in D-InSAR processing.
2. THEORY AND METHOD
2.1 Differential Interferometric Synthetic Aperture Radar (D-InSAR)
SAR image records both amplitude and phase of the backscattered signal from the objects on the ground. The interferogram is generated by complex conjugate multiplication of the interferometric image pair. D-InSAR technique is a method that the phase information of radar carrier is used to obtain the ground deformation (Fan, H., 2011;Chen, B., 2013). In the repeat mode, if the ground deformation is happened during the two images being captured, the interferometric fringes generated by these two images mainly include some pixel in the satellite line-of-sight direction
flat
= the phase caused by reference planeatmo
= the phase equivalent of the difference inatmospheric retardation between passes
The International Archives of the Photogrammetry, Remote Sensing and Spatial Information Sciences, Volume XL-7/W4, 2015 2015 International Workshop on Image and Data Fusion, 21 – 23 July 2015, Kona, Hawaii, USA
This contribution has been peer-reviewed.
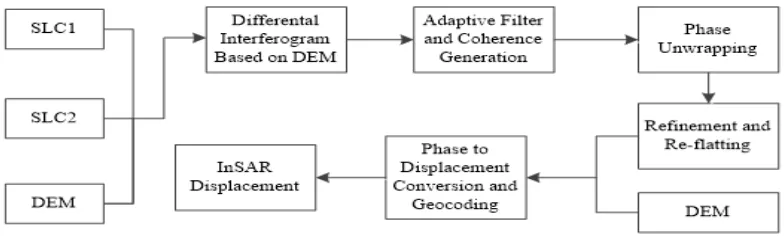
Figure 1: Processing of D-InSAR in Sarscape module
noise
= the noise term due to variability in scattering from the pixel, thermal noise and coregistration errorsHow to get disp
is the problem to be resolved by D-InSAR technique, and
topo is the main factor to be removed.2.2 SRTM data elevation data for large portions of the tropics and other areas of the developing world. The SRTM data is available as 3 arc second (approx. 90m resolution) DEMs. A 1 arc second data product was also produced, but is not available for all countries. The vertical error of the DEM's is reported to be less than 16m.As shown in Figure 3(a), the SRTM is been resized to 3 meters in one pixel.
2.3 GDEM data
On June 29, 2009, NASA and theMinistry of Economy, Trade, and Industry (METI) of Japan released a Global DigitalElevation Model (GDEM) to users worldwide at no charge as a contribution to theGlobal Earth Observing System of Systems(Aster, 2009). This GDEM was found to have an overall accuracy of around 20-m at the 95percent (%) confidence level.NASA and METI released a second version of the ASTER GDEM (GDEM 2) in mid-October, 2011.GDEM 2 is a 1 arcsecond elevation grid divided and distributed as 1° x 1° tiles, has an overall accuracy of around 17-m at the95% confidence level, and a horizontal resolution on the order of 75-m. The GDEM over the study area which has been resized to 3 meters in one pixel is shown in Figure 3(b).
2.4 LiDAR data
Light Detection and Ranging(LiDAR) Digital Elevation Model(DEM) data over the caving face is mosaicked by 13 filtered imagines of point cloud monitored by Lecia Scanstation C10.The vertical accuracy is about 0.2m and the horizontal accuracy is 0.5m. According to the resolution of TerraSAR and Radarsat-2, the LiDAR DEM is about 3 meters by 3 meters each pixel. The LiDAR DEM is shown in Figure 3(c).
2.5 SAR data
Two imagines of TerraSAR of X-Band acquired On April 18, 2015 and April 29, 2015 with 11days interval and two imagines of Radarsat-2 of C-Band acquired On April 4, 2015 and April 28, 2015 with 24 days interval are used in this study. The baseline of a couple of TerraSAR imagine which the resolution is 3.3 meters in azimuth and 2.6 meters in range is about 53 meters and Radarsat-2 which the resolution is 2.9 meters in azimuth and 2.6 meters in range is 98 meters.
3. RESULTS AND DISSCUTION
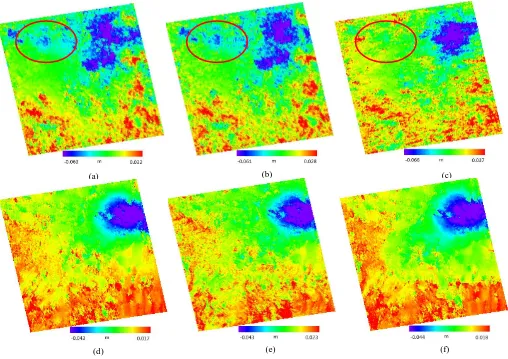
The couple of Radarsat-2 imagines in24daystime interval imaged on April 4, 2015 and April 28, 2015 and the couple of TerraSAR imagines in 11days time interval imaged on April 18, 2015 and April 29, 2015 are processed with different DEM (such as SRTM, GDEM and LiDAR DEM) by Sarscape module of Environment for Visualizing Images (ENVI)software. The processing is shown in figure 1 and the results shown in Figure 2. subsidence basin caused by coal mining is clearly shown in the top right corner of Figure 2, either generated by Radarsat-2 or TerraSAR.
Compared with Figure 2(a),(b)and(c), the error value of InSAR line-of-sight(LOS) surface deformation measurement is less in Figure 2(c).This is because the LiDAR DEM is more accuracy than SRTM and GDEM. In Figure 3, it is clearly that the maximum elevation of GDEM is higher than SRTM and LiDAR DEM. Maybe the quality of GDEM in this study area is the worst compared with SRTM and LiDAR DEM. From the results generated by Radarsat-2 and TerraSAR, it found that the area where uplift are larger in TerraSAR than in Radarsat-2. It is because that the noisy caused by surface vegetation is more sensitive in X-Band than in C-Band.
The International Archives of the Photogrammetry, Remote Sensing and Spatial Information Sciences, Volume XL-7/W4, 2015 2015 International Workshop on Image and Data Fusion, 21 – 23 July 2015, Kona, Hawaii, USA
This contribution has been peer-reviewed.
As mentioned in He(He, X., 2012), the accuracy of InSAR line-of-sight(LOS) surface deformation measurement depend on the accuracy of geography. The
r
is defined byH
B
r
sin
(2)
where
r
= the accuracy of InSAR line-of-sight(LOS) surface deformation measurement
B
= the perpendicular baseline
= the range from antenna in the satellite to target on the earth surface
= the incidence angle(a) (b) (c)
(d) (e) (f)
Figure 2. Displacement figures of Radarsat-2 and TerraSAR with different DEM
(a) Displacement figure of Radarsat-2 with SRTM; (b) Displacement figure of Radarsat-2 with GDEM; (c) Displacement figure of Radarsat-2 with LiDAR DEM; (d) Displacement figure of TerraSAR with SRTM; (e) Displacement figure of TerraSAR with GDEM; (f) Displacement figure of TerraSAR with LiDAR DEM
(a) (b) (c)
Figure 3. Different DEM figures with resolution of 3 meters (a) SRTM (b) GDEM (c) LiDAR DEM
The International Archives of the Photogrammetry, Remote Sensing and Spatial Information Sciences, Volume XL-7/W4, 2015 2015 International Workshop on Image and Data Fusion, 21 – 23 July 2015, Kona, Hawaii, USA
This contribution has been peer-reviewed.
H
= the error value of geographyIn this study, the relation between
H
and
r
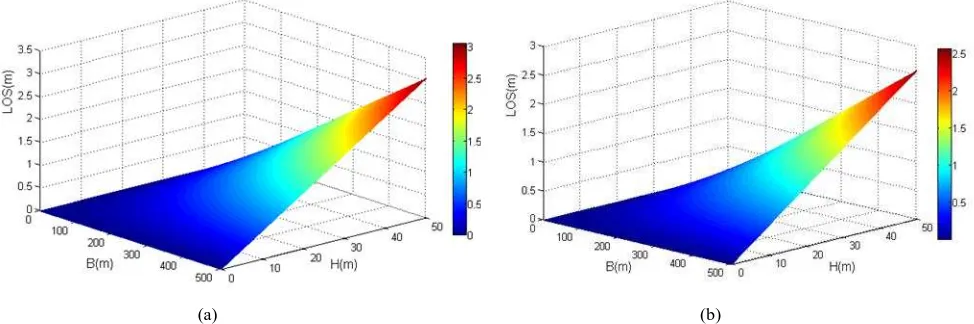
of TerraSAR with baseline about 98 meters and Radarsat-2 with baseline about 53 meters are shown in Figure 4(a), Figure 4(b) respectively.The error value of InSAR line-of-sight(LOS) surface deformation measurement increase as well as the error value of geography. Take Radarsat-2 for example, when the error value of geography is about 10 meters, the error value of LOS is about 1.5 millimeters with the baseline about 98 meters in this study. In Figure 2, the error value of LOS caused by the error value of geography is more serious for Radarsat-2 than for TerraSAR, the reason is that the baseline of Radarsat-2 is 98 meters and the TerraSAR is only 53 meters and the error value of LOS is more sensitive to long baseline than short baseline.
4. CONCLUTION
In this paper a couple of Radarsat-2 and a couple of TerraSAR with DEM in different resolution are used to reveal the subsidence basin caused by coal mining .compared the results, it obtained that high resolution and accuracy DEM is essential for high resolution SAR imagines. The error value of LOS are decreased obviously by high accuracy and resolution DEM. In this study, through the resolution of GDEM is higher than SRTM, but the result produced by SRTM is more proper than GDEM. It is due to the accuracy of SRTM is better than GDEM in the study area. The way by fusion of InSAR and laser scan data is accurate and suit for monitoring the subsidence due to underground coal mining, but the processing time of LiDAR DEM which generated by laser scan data and computational capacity of computer are the major limiting factors.
ACKNOWLEDGEMENTS
The authors would like to acknowledge Mr J.H. Li, the third surveying and mapping institute, Hebei Bureau of Geoinformation, for providing the laser scan data. This work was supported by“Geographical Conditions of Service Oriented the Surface Subsidence Monitoring caused by Resources Exploitation Program(No. 201412016)”from National Administration of Surveying, Mapping and Geoinformation, China.
REFERENCES
Al-Rawahy, 1995..Effects of Mining Subsidence Observed by Time-lapse Seismic Reflection Profiling. University of Durham.. Aster, 2009.G. D. E. M. Validation Team. ASTER Global DEM.
Bahuguna, P., 1995. Subsidence studies in Indian coalfields by a semi-empirical approach. Proceedings of the Fifth International Symposium on Land Subsidence, The Hage, pp. 127–133.
Chen, B., 2013.Large-scale deformation monitoring in mining area by D-InSAR and 3D laser scanning technology integration.
International Journal of Mining Science and Technology, 23(4), 555-561.
Fan, H., 2011. Land subsidence monitoring by D-InSAR technique, Mining Science and Technology (China), 21(6), 869-872.
Gueguen, Y., 2009. Monitoring residual mining subsidence of Nord/Pas-de-Calaiscoal basin from differential and Persistent Scatterer Interferometry (Northern France).J. Appl. Geophys. 69 (1), 24–34.
He, X., 2012. Earth observation data processing method by InSAR and the comprehensive measurement. Science Press, China.
Jarvis, A., 2008.Hole-filled SRTM for the globe Version 4.available from the CGIAR-CSI SRTM 90m Database (http://srtm. csi. cgiar. org).
Miao, F., 2008.Application of DINSAR and GIS for underground mine subsidence monitoring. Int. Arch Photogramm Remote Sens. Spat. Inf. Sci. 37, 251–256. Yerro, A., 2014.Analysis of the evolution of ground movements in a low densely urban area by means of D-InSAR technique. Engineering Geology, 170, 52-65.
(a) (b)
Figure 4.The relation betweenthe accuracy of InSAR line-of-sight(LOS) surface deformation measurement andthe error value of geography for (a) TerraSAR and (b) Radarsat-2.
The International Archives of the Photogrammetry, Remote Sensing and Spatial Information Sciences, Volume XL-7/W4, 2015 2015 International Workshop on Image and Data Fusion, 21 – 23 July 2015, Kona, Hawaii, USA
This contribution has been peer-reviewed.