INVESTIGATING THE POTENTIAL OF ACTIVITY TRACKING APP DATA TO
ESTIMATE CYCLE FLOWS IN URBAN AREAS
J. Haworth a, *
a
SpaceTimeLab, University College London, Gower Street, London, WC1E 6BT UK –[email protected]
Commission II, WG II/8
KEY WORDS: Transport, Cycling, Mobility, Regression, Green Travel, GPS
ABSTRACT:
Traffic congestion and its associated environmental effects pose a significant problem for large cities. Consequently, promoting and investing in green travel modes such as cycling is high on the agenda for many transport authorities. In order to target investment in cycling infrastructure and improve the experience of cyclists on the road, it is important to know where they are. Unfortunately, investment in intelligent transportation systems over the years has mainly focussed on monitoring vehicular traffic, and comparatively little is known about where cyclists are on a day to day basis. In London, for example, there are a limited number of automatic cycle counters installed on the network, which provide only part of the picture. These are supplemented by surveys that are carried out infrequently. Activity tracking apps on smart phones and GPS devices such as Strava have become very popular over recent years. Their intended use is to track physical activity and monitor training. However, many people routinely use such apps to record their daily commutes by bicycle. At the aggregate level, these data provide a potentially rich source of information about the movement and behaviour of cyclists. Before such data can be relied upon, however, it is necessary to examine their representativeness and understand their potential biases. In this study, the flows obtained from Strava Metro (SM) are compared with those obtained during the 2013 London Cycle Census (LCC). A set of linear regression models are constructed to predict LCC flows using SM flows along with a number of dummy variables including road type, hour of day, day of week and presence/absence of cycle lane. Cross-validation is used to test the fitted models on unseen LCC sites. SM flows are found to be a statistically significant (p<0.0001) predictor of total flows as measured by the LCC and the models yield R squared statistics of ~0.7 before considering spatio-temporal variation. The initial results indicate that data collected using fitness tracking apps such as Strava are a promising data source for traffic managers. Future work will incorporate the spatio-temporal structure in the data to better account for the spatial and temporal variation in the ratio of SM flows to LCC flows.
* Corresponding author
1. INTRODUCTION
1.1 Cycling in cities
Traffic congestion and its associated environmental effects pose a significant problem for large cities. Consequently, promoting and investing in green travel modes such as cycling is high on the agenda of many transport authorities. In order to target investment in cycling infrastructure and improve the experience of cyclists on the road, it is important to know where they are. Unfortunately, investment in intelligent transportation systems over the years has mainly focussed on monitoring vehicular traffic, and comparatively little is known about where cyclists are on a day to day basis. In London, for example, there are a limited number of automatic cycle counters installed on the network, which do not have sufficient spatial coverage to provide an accurate picture. These are supplemented by surveys that have better spatial coverage, but are carried out too infrequently to be useful for day to day operations.
1.2 The opportunity of Big Data
In recent decades, advances in computing power, the internet (and internet of things), mobile technologies, and data storage have heralded the era of ‘Big Data’. From the transport engineering perspective, the emergence of the citizen as a sensor (Goodchild, 2007) has provided a rich source of human
mobility data that can supplement the traditional data sources used in intelligent transportation systems. For example, it has been demonstrated empirically that GPS data collected from smart phones can provide accurate estimates of vehicular traffic velocities with a relatively modest penetration rate (Herrera et al., 2010). The most well-known operational example is Google traffic, which leverages mobility data from Android users and Waze subscribers to generate live traffic maps, which feed into its routing algorithms.
In many cases, Big Data can be used in innovative ways to generate insights beyond their intended use. For example, internet search data can be used in recommender systems for targeted advertising (Lü et al., 2012), and to ‘nowcast’ economic trends (Varian, 2014); and social media data can be used to detect emergencies (Cheng and Wicks, 2014). It is through such work that the opportunities of Big Data can be fully realised.
The potential of mobility tracking technology to reveal insights into cyclists’ behaviour has long been recognised in the academic community. Amongst others, (Broach et al., 2012) used GPS to track 164 cyclists in Portland, Oregon, USA, generating a route choice model, and (Hood et al., 2011) carried out a similar study in San Francisco. (El-Geneidy et al., 2007) used GPS to estimate bicycle travel speeds of different user groups in Minneapolis, Minnesota, USA. Such studies are The International Archives of the Photogrammetry, Remote Sensing and Spatial Information Sciences, Volume XLI-B2, 2016
tremendously important in terms of understanding cyclists’ behaviour, but the data are not sufficient for use in day to day traffic operations.
While authoritative sources of cycling data remain few, many cycle commuters now routinely record their activities using GPS enabled smart phones, bike computers, watches or other of linear regression models are constructed to predict CC flows using Strava flows along with a number of additional variables. The paper proceeds as follows; in section 2, the data are described. The methodology is outlined in section 3. The results are presented and discussed in section 4 before some conclusions are offered in section 5.
2. DATA DESCRIPTION
2.1 Strava Metro
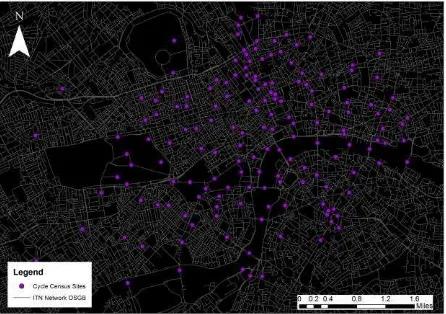
Strava is a popular mobile and web based application that stores GPS based personal tracking data and provides value added services. The selling point of Strava is the so called ‘segment’: when users upload GPS tracks they are automatically matched to user defined street segments and the time taken to traverse each segment is calculated. Segments have leader boards, and cyclists compete to become ‘king’ or ‘queen of the mountain’ on a particular segment. Although it is this competitive aspect that has made Strava popular, many cyclists now routinely upload their commuting activities to the app, and there is a ‘commuter’ tag to indicate this. The dataset used here is an output of Strava’s Metro initiative (http://metro.strava.com/). It consists of flows and travel times/speeds generated from Strava activities matched on a minute by minute basis to individual road segments (termed links here) on Ordnance Survey’s MasterMap Integrated Transport Network (ITN), shown in Figure 1. Data are provided for the entirety of 2013.
Figure 1. Map of the CC locations and ITN
2.2 The London Cycle Census
The London Cycle Census (CC) is a single day survey of cycle flows in Central London, taken over a four week period in April and May 2013. The survey was managed by the Traffic Analysis Centre at Transport for London (TfL). In total there are 164 survey sites, with traffic flows counted in both directions where necessary. Survey locations were chosen to reflect a range of cycling conditions and geographic spread. The manual classified link counts cover 14 hours (06:00-20:00), and were reported in 15 minute time periods. Each site was surveyed on a single day only. A mix of manual counts and video surveys using temporary cameras were used. The location of the CC sites is shown in Figure 1.
2.3 Matching CC counts to SM links
In order or carry out the comparative analysis between Strava counts and the CC counts, the CC locations are matched to the ITN. The CC survey sites are geolocated using geographic coordinates, street name, direction and bearing. This is sufficient to automatically match the majority of the sites to ITN road links using the following steps:
1. Assign each point to its nearest ITN link.
2. Match the road name of the CC site with the road name of the matched ITN link, accounting for spelling differences.
a. If not matched, manually check and reassign incorrectly matched CC sites to correct ITN link.
3. Calculate bearing of ITN link based on location of its start and end node and assign Strava count to the correct direction
4. Match the CC counts to the Strava counts based on site and direction.
Some of the CC sites are cycle only and not located on the ITN, so they are not included in the analysis. In total, 298 sites are successfully matched (two directional sites are double counted). The CC counts and Strava counts are aggregated into 1 hour periods between 6 am and 8pm, leaving a total of 289*14=4172 observations. model, with CC flow as the dependent variable, and Strava flow as an independent variable along with a range of covariates that are shown in Table 1. We use OLS as it is one of the simplest and most widely understood statistical modelling techniques and provides a base level of performance.
Dummy variables are binary, with n-1 coefficients being estimated for each variable, where n is the number of levels. The variables are added to the model sequentially to examine the effect on model performance. In total, 6 models are constructed, which are shown in Table 2. All models are trained using R statistical package. Cross-validation is carried out using the DAAG package (MAINDONALD AND BRAUN, 2010). The International Archives of the Photogrammetry, Remote Sensing and Spatial Information Sciences, Volume XLI-B2, 2016
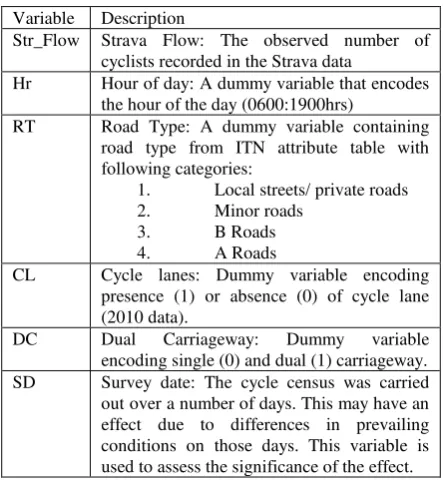
Table 1. Variable description
Variable Description
Str_Flow Strava Flow: The observed number of cyclists recorded in the Strava data
Hr Hour of day: A dummy variable that encodes the hour of the day (0600:1900hrs)
DC Dual Carriageway: Dummy variable encoding single (0) and dual (1) carriageway. SD Survey date: The cycle census was carried out over a number of days. This may have an effect due to differences in prevailing conditions on those days. This variable is used to assess the significance of the effect.
Table 2. Model descriptions validation error of each of the trained models. Cross validation error is measured in terms of root mean squared error. It can be seen that the Strava flow alone results in a model with an adjusted r squared of 0.616. Adding the Hr and RT variables raises this to 0.654 and 0.675 respectively. The addition of the CL and DC variables does not improve the model fit. It is worth noting that the CL data was produced in 2010, and does not contain improvements in cycling infrastructure made since then. Therefore, some ITN links may include cycle lanes that are not accounted for in the CL variable. An updated cycle lanes layer may increase the contribution of the CL variable. The SD variable does not increase model fit, but the CV RMSE reduces slightly. This indicates that the survey date has a small effect on the relationship between the CC flows and the independent preferred, we show model 6 here to illustrate the contribution of each of the parameters. Str_Flow is strongly significant, confirming that Strava flows correspond well to the CC flows. All of the Hr dummy variables are significant. The coefficients are positive in the peak hours of 8-9 AM and 5-6 PM, and negative in the intervening period. This indicates that cycle commuters have similar temporal patterns to vehicular commuters. The RT variables are all significant at the 99% confidence level. A-roads have the highest coefficient, indicating that cyclists tend to cycle more on busier roads. This may be partially attributed to the placement of London’s cycle superhighways on main arterial routes. It may also reflect the demographic of Strava users, the majority of whom were males aged 25-44 at the time the dataset was generated. It can be surmised that this demographic is more likely to prioritise speed over safety when planning a route. indicating that the day on which the survey was carried at each site is important. This suggests that there is a need to study the seasonal and weekend/weekday patterns in more detail, but this is not possible using the CC data alone.
4.3 Residual analysis
Figure 2 shows a histogram of the residuals of model 6. The residuals have zero mean, and they appear to be approximately normally distributed. However, there are a large number of extreme outliers, both positive and negative. This indicates that the simple OLS model is not capable of fitting the links with extremely low flow and extremely high flow simultaneously. In particular, low flow links tend to be systematically over-predicted.
Figure 2. Histogram of residuals of model 6
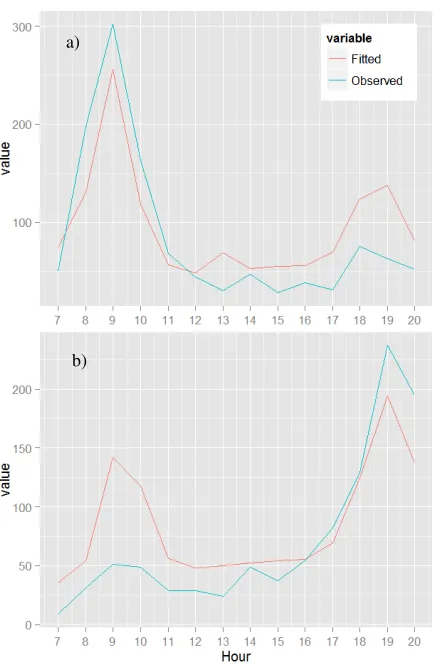
Furthermore, the simple model here cannot account for variations in the relationship between CC flow and hour of day caused by the inbound or outbound direction of a link. An example of this is shown in figure 3, which shows the same link in two directions. The inbound link has a higher flow in the AM peak, while the outbound link has a higher flow in the PM peak. In both cases, the non-peak flow is over-estimated while the peak flow is slightly under estimated. This could be accounted for by the incorporation of additional variables, or the use of nonlinear models.
5. CONCLUSIONS
This study presents an initial attempt at validating large scale activity tracking app data for the purpose of estimating cycle flows in a major city. A set of simple OLS models were constructed to estimate CC flow using Strava flow, along with a number of covariates. It was found that Strava flow is a good predictor of CC flow, even with a simple model specification. However, more work is required before such data can be used in the context of transport operations. First, the spatial and temporal variation in the model fit needs to be explored in order to uncover and account for potential biases in the data. Second, different model structures need to be explored that can cope with the large variations in flows between links of different types. Alternatively, different models may be used for different link types. In future work, we will extend our validation efforts to TfL’s network of automatic cycle counters (ACCs).
Figure 3. Example of model performance on a single link; a) inbound, and b) outbound
ACKNOWLEDGEMENTS
Strava Metro data are licensed from Strava. The author would like to thank Strava and Transport for London for providing the data. Any errors are the sole responsibility of the author.
REFERENCES
Broach, J., Dill, J., Gliebe, J., 2012. Where do cyclists ride? A route choice model developed with revealed preference GPS data. Transp. Res. Part Policy Pract. 46, 1730–1740. doi:10.1016/j.tra.2012.07.005
Cheng, T., Wicks, T., 2014. Event Detection using Twitter: A Spatio-Temporal Approach. PLoS ONE 9, e97807. doi:10.1371/journal.pone.0097807
El-Geneidy, A.M., Krizek, K.J., Iacono, M., 2007. Predicting bicycle travel speeds along different facilities using GPS data: a proof of concept model, in: Proceedings of the 86th Annual Meeting of the Transportation Research Board, Compendium of Papers.
Goodchild, M.F., 2007. Citizens as sensors: the world of volunteered geography. GeoJournal 69, 211–221. doi:10.1007/s10708-007-9111-y
Herrera, J.C., Work, D.B., Herring, R., Ban, X. (Jeff), Jacobson, Q., Bayen, A.M., 2010. Evaluation of traffic data obtained via GPS-enabled mobile phones: The Mobile Century field experiment. Transp. Res. Part C Emerg. Technol. 18, 568–583. doi:10.1016/j.trc.2009.10.006
a)
b)
Hood, J., Sall, E., Charlton, B., 2011. A GPS-based bicycle route choice model for San Francisco, California. Transp. Lett. Int. J. Transp. Res. 3, 63–75. doi:10.3328/TL.2011.03.01.63-75 Lü, L., Medo, M., Yeung, C.H., Zhang, Y.-C., Zhang, Z.-K., Zhou, T., 2012. Recommender systems. Phys. Rep.,
Recommender Systems 519, 1–49.
doi:10.1016/j.physrep.2012.02.006
Maindonald, J., Braun, W.J., 2010. Data Analysis and Graphics Using R – an Example-Based Approach, 3rd ed. Cambridge University Press, Cambridge.
Varian, H.R., 2014. Big Data: New Tricks for Econometrics. J. Econ. Perspect. 28, 3–28. doi:10.1257/jep.28.2.3