DETERMINING PULL - OUT DEFORMATIONS OF BONDED METAL ANCHORS
EMBEDDED IN CONCRETE BY MEANS OF PHOTOGRAMMETRY
E. O. Avsar a, *, M. O. Altan a, U. A. Dogan b, D. Akca c a
ITU, Civil Engineering Faculty, Department of Geomatic Engineering 34469 Maslak Istanbul, Turkey – (avsarem, oaltan)@itu.edu.tr
b
ITU, Civil Engineering Faculty, Department of Civil Engineering 34469 Maslak Istanbul, Turkey – [email protected]
c
Isik University, Faculty of Engineering, Department of Civil Engineering, 34980 Sile Istanbul, Turkey – [email protected]
Commission V, WG V/1
KEY WORDS: Acquisition, Monitoring, Engineering, Measurement, Camera, Photogrammetry
ABSTRACT:
Chemical anchorages are applied in many engineering implementations, particularly strengthening of reinforced concrete structures. During strengthening procedure; chemical anchorages should be tested, since they supply to transfer the load between existing construction elements and newly added elements. Therefore; the study of the quality of chemical anchorages is an important issue in construction materials science. In this context; the most important experiment is to determine the pull-out loads of embedded anchorage reinforcement by applying axial loads. In this study; it is aimed to determine the displacements of steel reinforcements, embedded into concrete by using chemical anchorages, while applying axial pulling loads. In order to determine the displacements and load - deformation graphs; starting conditions and every 10 bar pressure applied conditions of the steel reinforcements were captured by the cameras. The obtained images were evaluated by using photogrammetric software. Based on the photogrammetric post-processing results, the load - deformation graphs were plotted and the loads at loss of adhesion were determined.
* Corresponding author
1. INTRODUCTION
In strengthening applications such as, column jacketing, and the addition of new shear walls to the existing system on frame axes by replacing brick walls, anchorages are widely used for connecting these new vertical members to the existing structure in order to transfer the loads to the foundations and, to secure the combined resistance of existing and strengthening members. Chemically bonded anchors, which can be described as a rod attached to a pre-drilled hole with construction chemicals, are frequently used in rehabilitation and strengthening applications due to the ease of their applications procedures (Kaya, 2007).
Chemical anchors are the simplest methods for achieving the adherence between existing and new constructed reinforced concrete members. However, strength of these anchors can show great differences with respect to the type of chemical, cleanliness of anchor hole and compressive strength of concrete (Yilmaz et al., 2010).
Deformation measurement during laboratory testing on construction materials aims at determining the intrinsic characteristics of the considered object. The examination of the deformation and the knowledge of the applied load (e.g., a mechanical or thermal load) allow the analysis of the mathematical model that describes the behaviour of a construction element. (Barazzetti and Scaioni, 2010)
According to standard “Products and systems for the protection and repair of concrete”; coded EN 1881, deformations corresponding to the axial tensile loads should be measured. In addition to this; in the standard “Products and systems for the protection and repair of concrete structures, Definitions, requirements, quality control and evaluation of conformity, Anchoring of reinforcing steel bar”, coded EN 1504-6, 0.6 mm is given as the maximum value of deformation for a steel reinforcements which has 16 mm diameter, under 75 kN load which is applied during the test method defined in EN 1881. Also; load at loss of adhesion can be calculated from load - deformation graphs according to guideline published by European Technology Assessment Group.
In this study; it is aimed to determine the displacements of steel reinforcements, embedded into concrete by using chemical anchorages, while applying axial pulling loads by means of monitoring and photogrammetric evaluation.
2. CHEMICAL ANCHORAGES AND DEFORMATION
2.1 Deformation of Anchorages
Knowledge of structural behaviour of anchorage under the applied axial tension is essential for safe design. In the retrofitting applications; compatibility of the additional elements to the supporting system of the existing structure and providing a safe load transfer depends on the performance of
International Archives of the Photogrammetry, Remote Sensing and Spatial Information Sciences, Volume XXXIX-B5, 2012 XXII ISPRS Congress, 25 August – 01 September 2012, Melbourne, Australia
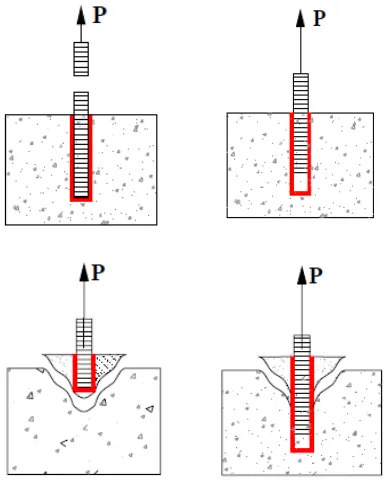
the implemented anchors. Anchorages transfer the tensile loads throughout the cohesive depth of the anchorage. Adherence can be called as the shear stresses that provide bonding between reinforcements and epoxy or concrete and epoxy. Components of adherence in chemical anchorages can be considered as; friction force, chemical bond strength and mechanical gear force occurred as the results of ribs on the anchorage. During the pull-out tests; various failure modes may be observed depending on the concrete class, type of chemical anchorage, geometry of the anchorage, durability and depth of the anchorage (Figure 1).
Behaviour of anchors; under the influence of the axial tensile load, can be classified in five categories:
1. Flowing/Rupturing of Anchorage reinforcement: This situation is the preferred one for the designer.
2. Pull out of Anchorage reinforcement: Chemical anchors begin to pull out along the anchoring depth, with the ending of the adhesion strength.
3. Conic Rupturing of the concrete: Provided tensile stress exceeds the tensile strength of concrete; conical failure of the anchored concrete may take place.
4. Simultaneous Pull-out and Conic Rupturing
5. Splitting of the concrete: Where the depth of the base element is shallow or planting the anchorage near the edge may cause splitting of the concrete.
Figure 1. Mode of failures of Anchorages (ACI 355, 1991)
2.2 Deformation Measurement Techniques
Several instruments can be used to measure the deformations of structural elements during loading tests. However, the most widely adopted tools are linear-variable-differential-transformers (LVDTs) and strain gauges, which provide the magnitude of the displacement with the investigation of the changes of electrical resistance due to a load. These tools are considered proven techniques, with an accuracy of ±1 m or even less, and they give real-time data. On the other hand, they only provide 1D measurements limited to the area in which the sensor is fixed. In addition, a connection with a control unit is
necessary and after destructive tests these kinds of sensors can be damaged. Thus, LVDTs or strain gauges are not a convenient choice in the case of extensive analysis on the whole body, in which a great number of 3D points with a good spatial distribution must be measured (Barazzetti and Scaioni, 2010).
In these cases, techniques of digital photogrammetry depict a valuable option for the design of powerful and flexible measurement tools. The use of photogrammetry in material testing experiments will generally allow for the simultaneous measurement of deformation or displacements at an almost arbitrary number of locations over the camera’s field of view. Data processing can be highly automated and fast, allowing for real-time monitoring at the camera imaging rate (Maas and Niederöst, 1997; Albert et al., 2002; Maas and Hempel, 2006)
3. EXPERIMENTS AND DISCUSSION
The test field was established in the Construction Materials Laboratory of Istanbul Technical University. Two steel reinforcements with 16 mm diameter and two with 20 mm diameter were observed during the experiment. All of the reinforcements were all embedded in the concrete with a depth of ten times of their diameters within a C30 grade concrete (Figure 2).
Figure 2. Test Field
The monitoring system consists of two Basler A402K Area Scan Cameras, Matrox Intellicam Image Acquisition Software, BAAP and/or Pictran Photogrammetric Software and the operating system is Windows XP. The size of CCD is 16.46 mm × 12.08 mm, the pixel size is 7 m × 7 m, the resolution is 2352 × 1726 pixels, and the optical lens is CARL ZEISS prime lens of 18 mm (Figure 3). The cameras were calibrated by using the test field in ITU Photogrammetry Laboratory.
Figure 3. Camera and Lens
International Archives of the Photogrammetry, Remote Sensing and Spatial Information Sciences, Volume XXXIX-B5, 2012 XXII ISPRS Congress, 25 August – 01 September 2012, Melbourne, Australia
Parameters Camera 1 Camera 2
c mm 18.600 0.0004 18.583 0.0004
x0 mm 0.143 0.0008 0.100 0.0008
y0 mm 0.198 0.0006 -0.141 0.0006
K1 10-5 -26.6052 0.1521 -26.7235 0.1491
K2 10-5 0.1115 0.0056 0.1163 0.0055
K3 10-5 -0.0004 0.0001 -0.0004 0.0001
P1 10-5 0.2185 0.0865 -0.9382 0.0840
P2 10-5 -0.0290 0.0068 -1.4629 0.0653
B1 10-5 -7.5182 0.4147 8.3907 0.3991
B2 10-5 -2.6722 0.2063 3.7969 0.1976
Table 1. Calibration Results for the Cameras
3.1 Measurement experiment of embedded steel reinforcements
The process of measurement can be defined as following: 1. A few randomly distributed ground controls points were measured with an accurate TPS.
2. 3 artificial points were established on the reinforcement.
3. Images were recorded from camera stations under empty load. The 3D coordinates of targets on the steel reinforcement are computed. The result is defined as the basic stage.
4. Increase the pressure continuously by 10 bars on the steel reinforcements and wait till the deformation is stable. 5. Images were grabbed.
6. Steps 4-5 are repeated until the reinforcements get free of the concrete.
During the experiments, displacements were occurred under 130, 128, 184 and 189 kN loads for reinforcements with 16 and 20 mm diameter, respectively. Therefore 31 images pairs for the reinforcements 16 mm diameter and 45 images pairs for the 20 mm pairs were grabbed.
3.2 Photogrammetric Evaluation
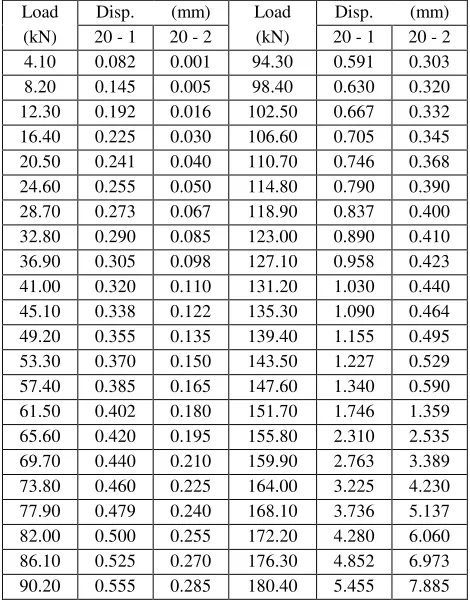
Post-processing evaluation of image pairs for reinforcements carried-out by using photogrammetric evaluation software. The acquired displacements are given in Table 2 and 3 and displacement-load curves are given in Figure 4. Since the coefficient of the pressure-load equation of the hydraulic cylinder is k=41.794, loads were calculated with:
1000 * * ) ( )
(kN P bar k g
F = (1)
Load Disp (mm) Load Disp (mm)
(kN) 16 - 1 16 - 2 (kN) 16 - 1 16 - 2 4.10 0.005 0.002 65.60 0.165 0.165 8.20 0.010 0.004 69.70 0.180 0.178 12.30 0.014 0.006 73.80 0.195 0.190 16.40 0.020 0.010 77.90 0.210 0.202 20.50 0.031 0.021 82.00 0.230 0.215 24.60 0.045 0.035 86.10 0.263 0.230 28.70 0.058 0.048 90.20 0.325 0.250 32.80 0.070 0.060 94.30 0.554 0.277 36.90 0.080 0.073 98.40 0.925 0.330 41.00 0.090 0.085 102.50 1.356 0.988 45.10 0.100 0.097 106.60 1.870 1.975 49.20 0.110 0.110 110.70 2.452 2.618 53.30 0.119 0.125 114.80 3.095 3.295 57.40 0.130 0.140 118.90 3.776 4.217 61.50 0.147 0.153 123.00 4.505 5.340
Table 2. Observed Displacements for the 16 mm diameter reinforcements
Load Disp. (mm) Load Disp. (mm)
(kN) 20 - 1 20 - 2 (kN) 20 - 1 20 - 2 4.10 0.082 0.001 94.30 0.591 0.303 8.20 0.145 0.005 98.40 0.630 0.320 12.30 0.192 0.016 102.50 0.667 0.332 16.40 0.225 0.030 106.60 0.705 0.345 20.50 0.241 0.040 110.70 0.746 0.368 24.60 0.255 0.050 114.80 0.790 0.390 28.70 0.273 0.067 118.90 0.837 0.400 32.80 0.290 0.085 123.00 0.890 0.410 36.90 0.305 0.098 127.10 0.958 0.423 41.00 0.320 0.110 131.20 1.030 0.440 45.10 0.338 0.122 135.30 1.090 0.464 49.20 0.355 0.135 139.40 1.155 0.495 53.30 0.370 0.150 143.50 1.227 0.529 57.40 0.385 0.165 147.60 1.340 0.590 61.50 0.402 0.180 151.70 1.746 1.359 65.60 0.420 0.195 155.80 2.310 2.535 69.70 0.440 0.210 159.90 2.763 3.389 73.80 0.460 0.225 164.00 3.225 4.230 77.90 0.479 0.240 168.10 3.736 5.137 82.00 0.500 0.255 172.20 4.280 6.060 86.10 0.525 0.270 176.30 4.852 6.973 90.20 0.555 0.285 180.40 5.455 7.885
Table 3. Observed Displacements for the 20 mm diameter reinforcements
International Archives of the Photogrammetry, Remote Sensing and Spatial Information Sciences, Volume XXXIX-B5, 2012 XXII ISPRS Congress, 25 August – 01 September 2012, Melbourne, Australia
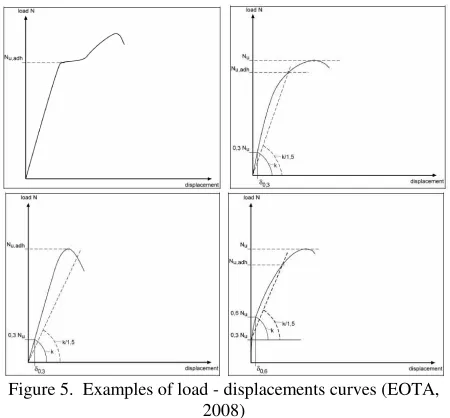
0 1 2 3 4 5 6 Anchors”; with bonded anchorages uncontrolled slip occurs when the mortar with the embedded part is pulled out of the drilled hole (because then the load displacement behaviour depends significantly on irregularities of the drilled hole). The corresponding load when uncontrolled slip starts is called load at loss of adhesion Nu_adh. Nu_adh shall be evaluated for every test from the measured load displacement curve (EOTA, 2008).
Figure 5. Examples of load - displacements curves (EOTA, 2008)
By investigating the obtained load - displacement graphs of the reinforcements; it was observed that the acquired curves were seen to be similar with the first example given in ETAG Guideline, which means load at loss of adhesion by a significant change of stiffness. Although the reinforcements carries more load until pulling-out; the critical Nu_adh values and corresponding displacements were calculated and given in the below table.
Reinforcement Nu_adh (kN) Displacement (mm)
16 - 1 86.96 0.273
16 - 2 95.78 0.29
20 - 1 145.1 1.262
20 - 1 146.9 0.573
Table 4. Nu_adh values and displacements
4. CONCLUSION
This paper has investigated the monitoring of the load - displacement curves of chemically bonded metal anchors installed in concrete by means of photogrammetry. According to the evaluation of the captured photos by using photogrammetric software, typical load - displacement curves are obtained. Duplicated curves of each anchor diameter are coherent with each other. Deformations are less than 0.6mm at 75 kN axial load, and these results comply with the standard EN 1504-6.
Loads at loss of adhesion increased by increasing diameter, in turn, increasing anchor depth. Besides, it should be noted that, each anchor is pulled out at a load of 20% more than adhesion loss load.
5. REFERENCES
ACI Committee 355, 1991. State-of-The–Art-Report on Anchorage to Concrete, ACI 355.1R-91, American Concrete Institute, Detroit.
Albert, J., Maas, H.-G., Schade, A., Schwarz, W., 2002. Pilot studies on photogrammetric bridge deformation measurement, Proceedings of the 2nd IAG Commission IV Symposium on Geodesy for Geotechnical and Structural Engineering, 21–24 May, Berlin, Germany.
Barazzetti, L., Scaioni, M., 2010. Development and Implementation of Image-based Algorithms for Measurement of Deformations in Material Testing, Sensors 2010, 10, 7469-7495; doi:10.3390/s100807469.
European Organisation for Technical Approvals, 2008. ETAG 001, Edition March 2002, Guideline For European Technical Approval Of Metal Anchors For Use In Concrete, Amended November 2006, Second Amendment February 2008, Part Five: Bonded Anchors.
Kaya, Y., 2007. Pull-out behaviour of partially bonded anchors to be used in retrofitting existing structures under anchorage interface conditions, MsC Thesis, ITU Institute for Science and Technology, 2007, Istanbul, Turkey.
Maas, H.-G., 2006. Photogrammetric Techniques in Civil Engineering Material Testing and Structure Monitoring, Photogrammetric Engineering & Remote Sensing Vol. 72, No. 1, January 2006, pp. 39–45.
Maas, H.-G., and M. Niederöst, 1997. The accuracy potential of large format still video cameras, Videometrics V (S. El Hakim, editor), SPIE Proceedings Series, Volume 3174.
Yılmaz, S., Caliskan, O., Kaplan, H., Kirac, N., 2010. Factors Affecting the Strength of Chemical Anchors, Journal of Engineering and Architecture Faculty of Eskisehir Osmangazi University, Vol: XXIII, No:1.
International Archives of the Photogrammetry, Remote Sensing and Spatial Information Sciences, Volume XXXIX-B5, 2012 XXII ISPRS Congress, 25 August – 01 September 2012, Melbourne, Australia