AUTOMATIC CLASSIFICATION OF HIGH RESOLUTION SATELLITE IMAGERY - A
CASE STUDY FOR URBAN AREAS IN THE KINGDOM OF SAUDI ARABIA
A. Maas*1, M. Alrajhi2, A. Alobeid2, C. Heipke1
1 Institute of Photogrammetry and GeoInformation, Leibniz Universität Hannover - Germany (maas, heipke)@ipi.uni-hannover.de
2 Dept. of Surveying and Mapping, Ministry of Municipal and Rural Affairs, Riyadh Olaya KSA [email protected], [email protected]
ABSTRACT:
Updating topographic geospatial databases is often performed based on current remotely sensed images. To automatically extract the object information (labels) from the images, supervised classifiers are being employed. Decisions to be taken in this process concern the definition of the classes which should be recognised, the features to describe each class and the training data necessary in the learning part of classification. With a view to large scale topographic databases for fast developing urban areas in the Kingdom of Saudi Arabia we conducted a case study, which investigated the following two questions: (a) which set of features is best suitable for the classification?; (b) what is the added value of height information, e.g. derived from stereo imagery? Using stereoscopic GeoEye and Ikonos satellite data we investigate these two questions based on our research on label tolerant classification using logistic regression and partly incorrect training data. We show that in between five and ten features can be recommended to obtain a stable solution, that height information consistently yields an improved overall classification accuracy of about 5%, and that label noise can be successfully modelled and thus only marginally influences the classification results.
* Corresponding author
1. INTRODUCTION
For many applications current topographic databases play a key role; examples comprise car navigation and any type of deci-sion making for city planning and urban or rural development (Heipke et al. 2008). The latter is particularly important for fast growing cities such as the major centres in the Kingdom of Saudi Arabia (KSA) (see Fig. 1 and Alrajhi 2013). Keeping such a database up-to-date has been estimated to require up to 40% of the cost of the original data acquisition (Champion, 2007). Consequently, the automation of the updating process is highly desirable.
High resolution satellite imagery presents a promising data source for this updating task, and automatic classification fol-lowed by a comparison of the new situation with the existing information is the method of choice (e.g. Vosselman et al., 2004; Helmholz et al. 2012). In the classification step, a number of design decisions has to be taken: (a) which classifier should be used?; (b) which classes can be separated?; (c) how should these classes be described, i.e. which features should be com-puted from the original data?; (d) what is the necessary amount and quality of training data?
In the general remote sensing literature a trend towards prob-abilistic classifiers employing random fields or similar ap-proaches can be recognized (e.g. Schindler 2012); answers to the other three questions typically depend on the problem to be solved, the geographic area, the available image data etc. In this paper we report on an empirical investigation with stereoscopic GeoEye and Ikonos satellite data depicting an urban area with a view towards the necessary amount of fea-tures to distinguish the basic topographic classes and the added value of height data to flag new buildings. Based on previous good experience (Maas et al. 2016) we employ label tolerant classification using logistic regression, which allows us to use partly incorrect training data. The rationale for this choice is that this partly incorrect training data can be derived from the existing, partly outdated, geospatial database, which largely facilitates the burden of having to provide an adequate amount of high quality training samples for the automatic classification.
2. DATA SOURCES AND PRE-PROCESSING
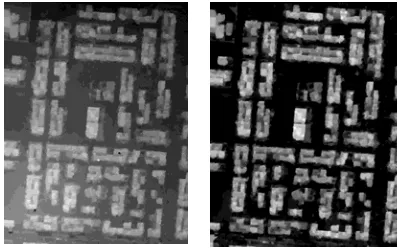
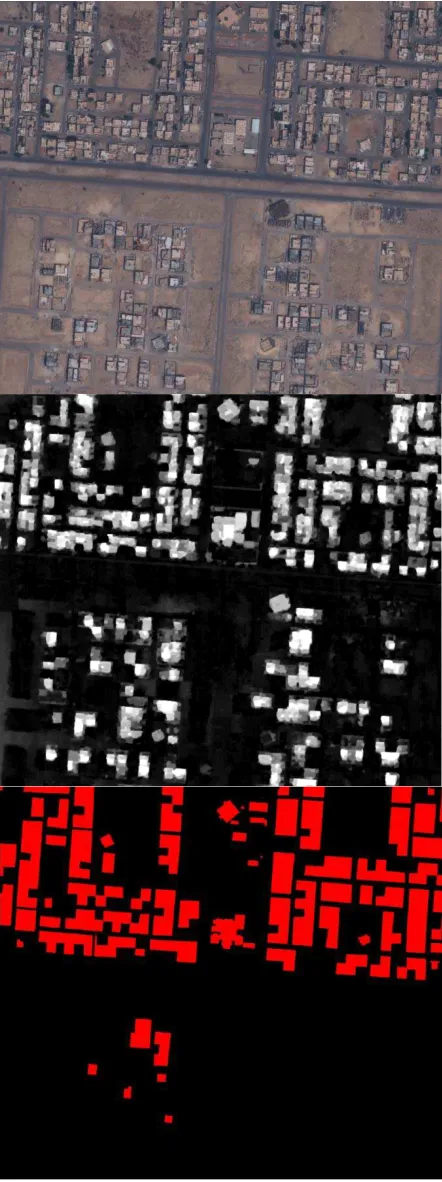
For our experiments we have available two sets of three satellite images each, depicting the same area in Riyadh, KSA: a pan sharpened stereo pair and a corresponding orthophoto for the two sensors, GeoEye with a ground sampling distance of 0.5m and Ikonos with a ground sampling distance of 1.0m; Fig. 2 shows parts of the two orthophotos. From the GeoEye ortho-photo we manually created a reference label image (see Fig. 3). From the stereoscopic images we also computed a Digital Sur-face Model (DSM) using the well-known semi-global matching algorithm (Hirschmüller 2008), followed by triangulation for filling holes and outlier elimination via morphological filtering to derive a Digital Terrain Model (DTM) and finally a normal-ized Digital Surface Model (nDSM) containing only the build-ing heights without terrain undulations: nDSM = DSM - DTM. The DSM and the nDSM derived from the GeoEye stereo pair for the area depicted in Fig. 3 are shown in Figure 4.
3. FEATURE INVESTIGATIONS
In the experiment described in this section we investigate the influence of a varying number of features used for supervised classification. All experiments are conducted using the image shown in Fig. 3. Details of the employed label noise tolerant logistic regression classifier and the standard multi-class logistic regression algorithm used for comparison can be found in (Maas et al. 2016) are not repeated here due to lack of space. First, we derive a large number of 64 features from the image data. These features were then ranked based on the feature importance analysis of a random forest classifier (Breiman, 2001). For the ten most important features we subsequently performed a classification to distinguish the five classes building, street, footpath, tree and ground shown in Fig. 3. For the classification the complete reference label image was used as training data.
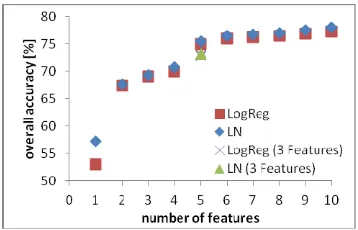
The results are shown in Fig. 5. As expected, the standard multi-class logistic regression and the label tolerant version yield nearly the same results, because no major outliers exist in the training data. Further, it can clearly be seen that while at the
Riyadh 1980 (400 km2 Riyadh 1990 (650 km2) Riyadh 2000 (725 km2) Riyadh 2010 (1,000 km2)
Figure 1: Development of Riyadh, the capital of KSA, between 1980 and 2010
Figure 2: Subsets of GeoEye (left) and Ikonos (right) satellite image used for the investigations.
Figure 3: Orthophoto (left) and manually created reference label image
(right); classes see legend Figure 4: DSM (left) and nDSM (right) of the area shown in Fig. 3
beginning, adding features significantly improves the results, the curve saturates after the five most important features with an overall accuracy of a little less than 80%. These features are three versions of the grey value in the red channel (these three versions slightly differ in the way low pass filtering had been applied), the grey value of the blue channel and the nDSM value. For one case, we also computed a classification with only one feature from the red channel together with the grey value of the blue channel and the nDSM value, called "3
Features" in Fig. 5, which performed nearly as good the version with five features.
Thus, it seems that for the task at hand a limited number of features is sufficient. Based on the achieved results and to have some redundancy for the results in between five and ten features can be recommended.
Figure 5: Classification results (LN: label noise tolerant logistic regression, LogReg: standard multi-class logistic regression; for the definition of "3Features" see text.
4. HEIGHT INVESTIGATIONS
In this section we show the influence of the height, in particular the nDSM value, on the classification results. This investigation is important, because the need to provide accurate height information has significant implications for the flexibility and cost of data acquisition. While it is well known that additional height information does improve the results it is not clear a priori, how significant this improvement actually is. Thus, experiments were conducted to assess this question. incorrect training data are being used.
4.1 Impact of the nDSM on classification
For this height investigation two test areas were used. The first test area is the same the one introduced in section 3, see Fig. 3. We again try to separate all five classes, the complete reference label image was used as training data. The second test area is shown in Fig. 7 (upper row). The scene was acquired from both sensors. Additionally, an outdated map is given, containing the three classes building, street and ground. This map is used as training data, and consequently only three classes were separated.
In the first test we use the first data set and vary the number of features used, and in particular distinguish cases with and without the nDSM value. Numerical results are contained in Tab. 1, Fig. 6 visually depicts the results with and without nDSM value for the case with 4 (red, blue, intensity, hue) and 4+1 8in addition, the nDSM) features.
From both, Tab. 1 and Fig. 6, the influence of the nDSM value can clearly be seen. In terms of overall accuracy use of the nDMS value amounts to an improvement of about 5%, regardless of the number of features used. Fig. 6 suggests that in particular open areas are better classified when height information is available.
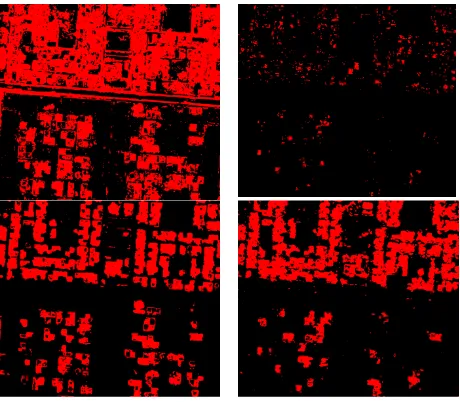
Similar results were obtained with the second scene. Here, only a classifications without height information were conducted, due to missing stereoscopic imagery. Fig. 7 depicts the results. The large amount of false positives and false negative buildings, as well as the fragmentation of the building blocks can clearly be seen.
Figure 6: Results with (left) and without (right) nDSM value as classification
feature
4.2 Separation of buildings and ground
In this experiment we show the influence of height information for detecting buildings, e.g. to detect new constructions during updating. In doing so, we only distinguish two classes in the classification, namely building and nonbilding. We compare label tolerant logistic regression to standard multi-class logistic regression using six respectively seven features (those used for the experiment are shown in the left most columns in Tab. 1). The height information comes from the nDSM derived in the pre-processing step, see section 2. For this experiment the label image used for training has been taken from an existing geo-spatial database, which is outdated in comparison to the GeoEye as well as the Ikonos images. The input data are depicted in Fig. 8, Fig. 9 shows the results for the case of label tolerant logistic regression (the standard logistic regression did not produce any meaningful results, for lack of space these are not shown in the paper).
When comparing Fig's. 8 and 9, the advantage of the nDSM value becomes clearly apparent. Whereas without this feature the GeoEye image delivers far too many false positive buildings and in the Ikonos image there are too many false negatives (upper row of Fig. 9), the situation significantly improves when the nDSM values are incorporated into the classification.
5. CONCLUSION
In this report we have investigated the number of features necessary to automatically classify high resolution satellite images depicting urban areas in the Kingdom of Saudi Arabia in order to generate suitable input data for updating a topographic database. We also assessed the potential benefits of stereoscopic imagery and thus of height information for the same task.
The number of features does not seem to be a critical factor. While in some cases as few as five or even three features seem to be enough to generate useful information, for reasons of redundancy it is recommended to employ in the order of five to 10 features. We have gained good experience with slightly low pass filtered grey values of the three colour channels (red, green, blue) in combination with intensity, hue and saturation.
The role of height information is more critical. From our results we draw two conclusions: the overall accuracy is improved by about 5% when height information in the form of nDSM values derived via state-of-the-art image matching is available. Perhaps more importantly, nDSM values significantly decrease the number of false alarms (both, false
positives and false negatives) when new buildings need to be detected during updating. Thus, if stereoscopic data are not available, a more substantial human interaction must be integrated into the processing chain of updating topographic data from high resolution remote sensing images.
REFERENCES
Alrajhi M., 2013: A Semi-Automated Procedure for Ortho-photo Generation from High Resolution Satellite Imagery. In: Wissenschaftliche Arbeiten der Fachrichtung Geodäsie und Geoinformatik der Leibniz Universität Hannover Nr. 307. Breiman, L., 2001. Random forests. Machine Learning, 45(1):5–32.
Champion, N., 2007. 2D Building change detection from high resolution aerial images and correlation digital surface models. International Archives of the Photogrammetry, Remote Sensing and Spatial Information Sciences Vol. XXXVI-3 / W49A, pp. 197-202.
Heipke C., Woodsford P.A., Gerke M., 2008: Updating geo-spatial databases from images. In: Li Z., Chen J., Baltsavias M. (Eds.), Advances in Photogrammetry, Remote Sensing and Spatial Information Sciences, Taylor & Francis, London, 355-362.
Helmholz P., Becker C., Breitkopf U., Büschenfeld T., Busch A., Braun C., Grünreich D., Müller S., Ostermann J., Pahl M., Rottensteiner F., Vogt K., Ziems M., Heipke C., 2012: Semi-automatic Quality Control of Topographic Data Sets. PE&RS 78 (9), 959–972.
Hirschmüller, H., 2008: Stereo Processing by Semiglobal Matching and Mutual Information, IEEE Transactions on Pattern Analysis and Machine Intelligence, 30(2):328-341.
Maas, A.; Rottensteiner, F.; Heipke, C.; 2016: Using label noise robust logistic regression for automated updating of topographic geospatial databases In: ISPRS Annals of the Photogrammetry, Remote Sensing and Spatial Information Sciences III-7, 133-140.
Schindler K., 2012: An overview and comparison of smooth labeling methods for land-cover classification. IEEE Trans. Geosci. Remote Sens., vol. 50, no. 11, pp. 4534–4545. Vosselman, G., Gorte, B., Sithole, G., 2004. Change detection for updating medium scale maps using laser altimetry. International Archives of the Photogrammetry, Remote Sensing and Spatial Information Sciences vol XXXV-B3, pp. 207-212.
Figure 7: Upper row: GeoEye (left) and Ikonos (right) image. Middle row: Reference label image (red: building; orange: ground, dark: street). Lower row: Classification results, GeoEye (left) and Ikonos (right).
Figure 8: Input data for height investigation. Upper row: GeoEye (left) and Ikonos (right) image. Middle row: nDSM from GeoEye (left) and Ikonos (right). Lower row: reference label image (red: building; black: ground).
Figure 9: Classification results for GeoEye (left) and Ikonos (right) images. Upper row: without nDSM value, lower row: including nDSM value.
Features
red Red red red red Red
green Green blue blue blue Blue
blue Blue intensity intensity intensity Intensity hue hue
hue Hue
saturation Saturation
nDSM nDSM nDSM
overall accuracy [%] 68,8 73,7 68,1 73,5 67,7 73,2
Table 1: Classification results for different amounts of features, each case with and without nDSM value.