3D WEBGIS AND VISUALIZATION ISSUES FOR ARCHITECTURES AND LARGE
SITES
R. De Amicis., G. Conti, G. Girardi., M. Andreolli
Fondazione Graphitech, 38123 Trento, Italy –
(raffaele.de.amicis, giuseppe.conti, gabrio.girardi, michele.andreolli)@graphitech.it
Commission V, WG V/4
KEY WORDS: Geographical Information Systems (GIS), Spinning Globes, Cultural Heritage, Geodatabase, Interactive media access
ABSTRACT:
Traditionally, within the field of archaeology and, more generally, within the cultural heritage domain, Geographical Information Systems (GIS) have been mostly used as support to cataloguing activities, essentially operating as gateways to large geo-referenced archives of specialised cultural heritage information. Additionally GIS have proved to be essential to help cultural heritage institutions improve management of their historical information, providing the means for detection of otherwise hard-to-discover spatial patterns, supporting with computation tools necessary to perform spatial clustering, proximity and orientation analysis. This paper presents a platform developed to answer to both the aforementioned issues, by allowing geo-referenced cataloguing of multi-media resources of cultural relevance as well as access, in a user-friendly manner, through an interactive 3D geobrowser which operates as single point of access to the available digital repositories. The solution has been showcased in the context of “Festival dell’Economia” (the Fair of Economics) a major event recently occurred in Trento, Italy and it has allowed visitors of the event to interactively access an extremely large repository of information, as well as their metadata, available across the area of the Autonomous Province of Trento, in Italy.
Within the event, an extremely large repository was made accessible, via the network, through web-services, from a 3D interactive geobrowser developed by the authors. The 3D scene was enriched with a number of Points of Interest (POIs) linking to information available within various databases. The software package was deployed with a complex hardware set-up composed of a large composite panoramic screen covering a horizontal field of view of 240 degrees.
1. INTRODUCTION
The fruition of Geographic Information (GI) from the Internet, in a direct and interactive way, has enjoyed, in the last few years, a significant growth. The unprecedented success of mapping applications such as Microsoft Bing Maps or Google Maps, is inevitably and radically changing the way people conceive the Internet and its content. These applications are in fact contributing to a radical paradigm shift in the way people access the Internet, now increasingly based on geographical locations rather than on their Internet address, promoting a cultural change that could have unpredictable effects as already occurred in the case of other Web 2.0 disruptive technologies such Facebook, which has recently overtaken emails in terms of messages being exchanged.
In the case of Geographic Information the possibility to play with an interactive mapping software in fact is changing the user’s behaviour as they use platforms, such as Google Earth, not only to find the shortest route to reach a given place but also to identify touristic information within a particular area, or simply for didactical or personal cultural growth, for instance to explore areas of interest. In short these platforms allow the user to freely explore the territory.
2. INITIAL REQUIREMENTS OF THE PROJECT
In fact the territory represents, almost directly, an instance of the cultural identity of a population, through its historical evolution, from an environmental, economic, societal or urban planning point of view.
This paper describes the result of a work, commissioned by a private contractor, which has provided the author with the chance to deploy an IT system that could emphasise this vision. The main challenge set by the contractor was to develop an interactive solution that could be used to represents the various aspects of a territory, be these historical, economic, environmental, and to convey them in an innovative, trendy and appealing way, that could be attractive for the largest possible audience, with the most diverse cultural background.
Content-wise the solution had to emphasise the role of three main factors: technological innovation, cultural identity and the government of a territory.
The final system had to be deployed within a major event, namely the “Festival dell’Economia” (the Fair of Economics), which takes place every year in Trento, Italy. The system had to be used by the large audience to promote exploration, communication and exchange of experience among the visiting public promoting the territory of the surrounding Province of Trento, acting as a gateway to the adjoining areas and as a showcase to the cultural and economic heritage within the Province.
For this reason it was essential for the system to be user friendly to help visitor enjoy their visit, motivating them to further explore the surrounding areas after the visit to the site. Furthermore the solution had to be robust, allowing visit of up to several thousand people over few days, and had to ensure a confortable experience also in the presence of groups of up to 20 people.
When designing the solution the authors could benefit from experience gained in the context of several research activities and projects (Bertacchini et al. 2007; Conti et al., 2011; Conti et al., 2009; De Amicis et al. 2008).
The first part of the work required gathering the digital assets that could be used to best represent the territory, its history and its heritage, namely the Digital Terrain Model (DTM) of the Province of Trento, a complete orthophoto coverage of the Province, a very wide collection of historical photographs, maps extracted from the historical cadastre, additional information regarding the most prominent and culturally relevant locations in the area, but also locations of environmentally sustainable businesses and, last but not least, a number of panoramic pictures of the area.
3. THE PROJECT CHALLENGE AND THE SOLUTION DELIVERED
The challenge the authors had to face was to devise how to represent all these apparently heterogeneous digital information in an interactive manner yet delivering and harmonious experience that could represent the territory in an engaging and user friendly way.
The solution identified made use of a software infrastructure based on a 3D geobrowser developed by the authors (see section 5 - software infrastructure) and an advanced panoramic display system set-up to cover –at high resolution- an horizontal field of 240 degree (see section 6 - hardware set-up).
All the data repositories ware not stored any more in a standard way, within databases or file systems, but they were geo-referenced. Participants could enter the site and interrogate the system: any of the visitor user fly around the scene in an interactive manner and accessing the multimedia content. One may argue that the system could be accessed by one user at time only, but in fact the set-up allowed true group-wise experience whereby a small community of users access the territory, discover information of interest, read documents of relevance and exchange positions and points of view, comment in a collaborative manner.
The large volume covered by the visualisation set-up ensured that the experience become participatory in the very similar manner to a traditional visit to a given site with a group of persons. However this approach has allowed moving beyond the issue of ensuring collaborative access to digital assets through different set-ups sharing the same virtual environment accessed through a number of remote sessions.
4. ASSET AVAILABLE AND ITS PROCESSING
4.1 The 3D model of the terrain
The 3D scene of the region was built with the use of a Digital Terrain Model (DTM) based on the Shuttle Radar Topography Mission (SRTM) dataset made publicly available by NASA.
Although the dataset provides only 90 meter ground resolution this was regarded as more than adequate given the scope of the application. In fact the adoption of a higher resolution DEM, such as the one available by Provincia di Trento which has an average ground resolution of 2 meters, would have added a significantly higher strain in terms of required graphical computing power due to the very high resolution of the screen used (see section 6 - hardware set-up).
To compensate for such a relatively low-resolution data, the terrain was then textured, at very high scale (i.e. when flying out beyond the regional scale) with imagery from Landsat7 satellites (Landsat7, 2001), while at lower scales using imagery acquired by the Province through airborne surveying, delivering ground resolution of 50 cm, covering an area of more than 6,000 square kilometres.
This ensures an excellent graphical impact since the entire scene become extremely rich in visual details. Additionally this represented the basis for the scene which could be interactively navigated with the use of a 3D geobrowser developed by the authors (Conti et al, 2009a; Simoes et al., 2009; Simoes et al. 2010). The user could then decide to see additional digital resources rendered over the terrain.
4.2 Historical maps
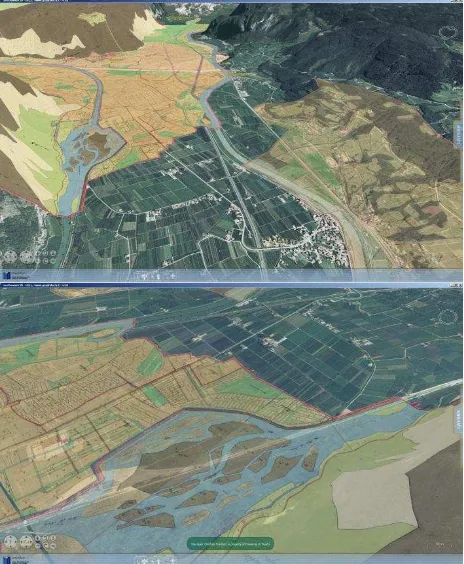
This datasets included not only information related to current territory but also reference to historical asset. The most notable example is show in Figure 1, which illustrates the historical maps of forty city councils across the Trentino Province, which could be rendered on top of the terrain in 3D over an area of more than 3,200 square kilometres.
Figure 1: the system in use while showing the historical maps
It must be noted that this required an extensive preparation work as the historical cadastral maps, dating back to the end of nineteen century, had been initially made available as paper based maps. The various map sheets were classified according to geographical grid of approximately 2 by 2 kilometres. The initial set of paper documents, which had been previously scanned by the local cultural heritage department, was made available to the authors as high resolution set of approximately 2,000 digital images.
However their use within the geo-referenced 3D globe, used for this project, required the application of an affine transformation
to yield ortho-rectified images to be rendered within the 3D scene.
Once ortho-rectified the various independent sets of map sheets had to be grouped and stitched together in order to achieve a single, seamless coverage of a given city council. This process had to be repeated for each set of map sheet which fell within the same administrative borders.
This yielded a set of different maps, one for each administrative area, which had to be merged into a single seamless data structure.
However to do so a further step was required to remove, from each set of map sheets corresponding to an administrative border, the empty areas around the borders and to make this areas transparent to allow proper fitting with other adjoining maps.
Once all images had been blended into a single coverage set this was pre-processed and structured into squared images sets whose side measured 0.04 degree. Each image constituted the top of a pyramid of images of 512x512 pixels at five different levels of detail, created by subdividing the parent image into a set of 4x4 images. The final result was a set of fifty thousand images structured within file system according to their level of resolution and position.
4.3 Other information on locations of relevance
Such a wide data repository was complemented by information available within a database of the Culture Department of the local Province of Trento. This contained information on points of interest of cultural relevance including, but not limited to, museums, places of worship (e.g. churches, monasteries, cemeteries etc.), location of areas of historical military relevance including old fortresses, trenches, and areas subject to bombing during the Second World War.
A further dataset contained information collected by a local trust focusing on initiatives to improve sustainability and reduce carbon footprint. The database contained, among other, information on local farms capable to promote local produce (therefore reducing emission of carbon dioxide), industries deploying green policies, renewable energy sources etc. These repositories were finally complemented by a large set of 360 high-resolution panoramas distributed over the territory of the Province shot at location of high touristic impact such as mountain peaks etc.
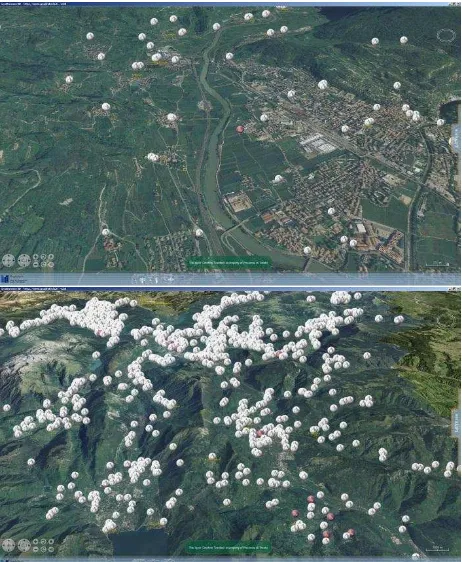
This extremely large repository was made accessible, via the network through web-services, from a 3D interactive geobrowser developed by the authors. The technical details of the software infrastructure are detailed in the following section. The information available through the aforementioned repositories were integrated and made available, within the 3D scene, as a number of Points of Interest (POIs) linking to information available within the different databases.
Whenever the user wanted to retrieve additional information on a given point of interest, they could click on each of these POIs. As result a panel would be automatically formatted with all the multimedia content available, which could include textual description and images, videos to name but a few, all automatically formatted from the information available within the database.
Figure 2: a screenshot showing the location of cultural relevance
Figure 3: a screenshot showing the various cultural resources available in the area
5. SOFTWARE INFRASTRUCTURE
The software developed for the purpose of the fair, as presented in this paper, was based on top of the platform, developed by the authors (Conti et al, 2009a; Simoes et al., 2009; Simoes et al. 2010), for interactive web-based fruition and management of geographical information.
The framework is composed, on the one hand, of a complex federation of server-side component and, on the other, it features a web-based 3D client.
The client is fully developed as pure Java™ application ensuring portability to all the most popular Operating Systems (OS) including Windows, Macintosh and Linux platforms. The client can be deployed as standalone software or, more conveniently, as applet or Java Web Start™ application.
5.1 Resource management
The 3D scene represents the base on top of which all the other detests are rendered. The system, during handshake, downloads the list of resources to be made available to the user. As soon as the client is started the client connects to the servers and downloads the configuration corresponding to the given profile. This includes both the tools available within the interface and the datasets that the client will be granted access to. After successful authentication tools and resources are grouped within two panels, rendered on top of the main window, sliding on the side of the screen once not needed.
During handshake the client requests from thee server the list of resources assigned to a given profile. A servlet responds with an XML which details both the information to be shown to the user, which will be used as label of a table of content. The latter is shown at the right most side of the screen within a sliding panel and can be used to conveniently access the various resources. This information is used by the client to create a set of layers, these are logical sets of resourced packed together, that can be visualised in various ways. These can be layers containing maps, images, but also multimedia data etc.
Layers can also be used to create logically stacked sets of graphical information over the terrain. In other words their order is used by the system to determine the visibility of one dataset with respect to the others, as if they were different layers of graphical resources draped over the terrain in a given order.
The XML detailing the configuration additionally specifies the internet location where each resource is located. In fact the entire infrastructure is based upon the paradigm of the so-called Spatial Data Infrastructure (SDI) a set of federated web services providing access to georeferenced information via standard communication protocols.
When the user selects a resource from the Table of Content the client redirects the request to the web-service providing access to the relevant dataset.
The various web services are deployed within a Java Enterprise Edition framework. Whenever possible the business intelligence required at the server level is ensure through an EJB (Enterprise Java Bean) coupled to a Servlet which is responsible for the communication with the client. Most notably the communication –whenever possible- is performed with the use of standards from Open Geospatial Consortium (OGC, 2011). In particular this ensures that imagery (e.g. maps) or vector information (e.g. roads) can be transmitted in a standardised manner through protocols such as Web Map Service (WMS) or Web Feature Service (WFS).
From the server side this is delivered through a set of software components developed on top of Geoserver (Geoserver, 2011) and GeoTools (GeoTools, 2011), a lower level toolkit which can be used to implement geographical applications.
These server components in turn rely on one or more data repositories which can be available locally or yet within other server within the federation. Local data, typically available through file systems, include satellite or airborne imagery. These resources are not stored within a database but within a structured file system. A set of structured folders allows storing imagery according to a standardised subdivision in “tiles”, i.e. patches of terrain at increasingly smaller scale and higher
resolution as previously discussed when detailing the production of historical maps.
This repository, which is static in nature, allows fast delivery on information at the server side without use of a database through an efficient mechanism of storing, compression and indexing of the various patches of images at different resolution. The clients sends to the server a standardised request (e.g. as WMS request) for a given portion of terrain. The servlet receives the request and fetches the corresponding repository directly at the file system level, encoding the response as WMS messages via HTTP. As a result the server does not need to invoke the full service stack involving use of Geoserver, other libraries as well as the database. This very simple, yet streamlined approach ensures extremely high performances when dealing with static information, often with an order of magnitude improvement in terms of response time.
This approach is extremely beneficial as it allows accessing, within a context such as a solution developed for cultural applications, to information made available by public administrations for operational activities (e.g. for planning or other technical and administrative reasons) in an interoperable manner. This way digital resources such as orthophoto imagery, cadastral maps, geographical data on planning, to name but a few, can be accessed in a completely interoperable manner, thus maximising the scope of the resources available.
The federated approach moves a step further in that if some adaptation is required, for instance to perform re-projection of existing resources to the reference system in use by the client, or to perform a transformation of data model, this can be performed on the fly by a dedicated web service.
Structured information is typically stored within a database with spatial extension (geodatabase). This way additional multimedia or alphanumeric resources can also be accessed directly from the client. This is the case of repositories containing cultural information as detailed in the previous sections.
6. HARDWARE SET-UP
Due to the large number of expected visitors, the visualisation setup had to ensure concurrent vision by group of up to 20 people. For this reason, after a comprehensive study of various solutions, the authors opted for a very effective visualisation solution based on a curved screen covering 240° field of view.
A self-standing structure was used to create a cylindrical projection surface where four Epson EB-G5200 projectors delivered a composite image of 4096x768 pixels at 5000 lm across the 240° curved screen with a radius of 2.2 meters. The projectors were mounted on the upper structure of the projection screen ensuring a large shadow-free area within the cylindrical space.
The large panoramic screen was powered by a PC workstation, configured with two nVidia GTX480 video cards, with a total of 3 GB dedicated video memory. The PC was used to run both the client and the server components including JBoss, Apache etc.
The two video outputs from the nVidia video cards were connected to a Viosio Black Box used to create a single virtual high-resolution screen which is then split into four regions, each corresponding to one of the sectors of the screen. The Black Box was configured to ensure proper edge blending and
correction of the distortion across the four projectors in order to deliver a single seamless image.
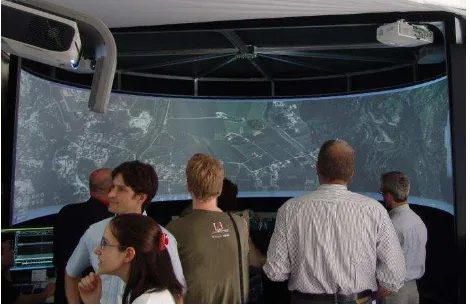
Figure 4: a picture of the tessellated display deployed
7. THE SYSTEM IN USE
The entire set-up was deployed for an entire week within a large tent, open to visitors, within one of the main square of the city. As result the set-up was experienced by thousands of people during the week-long fair of economics.
Although no formal assessment could be made, given the context of the set-up, the public showed great interest for the solution that was often regarded as very informative and pleasant. Several users reported explicitly that the set-up had fuelled their interest towards the surrounding area, and had acted as excellent promotional platform. Most interestingly several local visitors, i.e. those living in the city, regarded the system as very useful to help them comprehend cultural links across various domains that they had not appreciated before.
Figure 5: an image of the system being used during the Fair of Economics
8. CONCLUSIONS AND FUTURE WORKS
This paper has shown the result of a project that required the creation of a engaging solution to provide access to cultural information in order to emphasise the importance of a territory and its resources. The authors have decided to rely on a platform, traditionally used to manage geospatial information, to create a solution that could deliver an harmonious experience when accessing distributed data over the Trentino Province.
The solution had to be respond to a number of strict constraints including the possibility to be experienced by several users at time, being robust, provide access to heterogeneous information, be engaging, and capable to attract the largest possible audience. The solution has been detailed from the software and hardware standpoint.
Currently the authors are also extending the solution presented in this paper with a multi-touch system capable to manage 32 simultaneous points of contact. This solution is being used to create a collaborative environment where several users at the same time not only visualise information over a screen but also interact with its content in a very user friendly way composing information of relevance over a large screen. This will bring to new scenarios of explorative collaboration.
Figure 6: the multi-touch panel being used as further extension of the system.
9. REFERENCES AND/OR SELECTED BIBLIOGRAPHY
Bertacchini, P. A., Beusing, R., Bursche, A., Conti, G., De Amicis, R., Etz, M., Holweg, D., Linaza, M. T., Maver, T. Posluschny, A., Pritchard, D., Sievers, S., Tavernise A. 2007. NetConnect - Connecting European Culture Through new Technology. In Proceedings of Eva London, 11-33 July 2007, the London College of Communications, London (UK).
Conti, G, De Amicis, R, Girardi, G, Andreolli, M. 2011. User centered technologies, serious games and learning: a critical, speculative perspective. In D Koukopoulos and F Lazarinis (Eds) Handbook of Research on Technologies and Cultural Heritage: Applications and Environments. IGI Press. (In press)
Conti, G., De Amicis, R., Girardi, G., Andreolli M., & Piffer S. 2009. The role of interactive computer graphics to augment the learning experience of cultural heritage within museums and expositions. In M. Chang and C-W. Kuo (Eds.), Handbook of Research on Learning Culture and Language via ICTs: Methods for Enhanced Instruction, (pp. 153-169). Hershey, USA: Information Science Reference.
Conti, G., De Amicis, R., Piffer, S., Simoes, B. 2009a. Multi-level service infrastructure for Geograhical Visual Analytics in the context of Territorial Management. In David Paradice, Manuel Mora (Eds.) IJITSA International Journal of Information Technologies and The Systems Approach, IGI Global. Jan-2010.
De Amicis, R., Girardi, G., Conti, G. 2008. The evolution of the city of Trento across centuries . In proceedings of Digital
Interactive Media in Entertainment & Arts (Dimea 2008) conference, Athens Information Technology, Athens. ACM Press.
Geoserver, last accessed Jan 2011, available online from:
http://geoserver.org/display/GEOS/Welcome
GeoTools, last accessed Jan 2011, available online from:
http://www.osgeo.org/geotools
Landsat7, last accessed Jan 2011, available online from: http://geo.arc.nasa.gov/sge/landsat/l7.html
OGC, Open Geospatial Consortium, last accessed Jan 2011, available online from: http://www.opengeospatial.org/
Simoes B., Conti G., De Amicis R., Piffer S., (2009). Enterprise-level architecture for interactive web-based 3D visualization of geo-referenced repositories. In proceedings of Web3D, Darmstadt 2009.
Simões B., Piffer S., Carriero A., Conti G. and De Amicis R. 2010. Interactive access and processing of multispectral imagery: the user in the loop. In proceedings of PSATS 2010 2nd International ICST Conference on Personal Satellite Services, Rome, February 4 - 5, 2010, Springer.