ON GEOMETRIC PROCESSING OF MULTI-TEMPORAL IMAGE DATA
COLLECTED BY LIGHT UAV SYSTEMS
T. Rosnell a, *, E. Honkavaara a, K. Nurminen a a
Finnish Geodetic Institute, Geodeetinrinne 2, 02940 Masala, Finland - (tomi.rosnell, eija.honkavaara, kimmo.nurminen)@fgi.fi
Commission I, WG I/V
KEY WORDS: UAV, Photogrammetry, Remote Sensing, Sensor Orientation, Point Cloud, Matching
ABSTRACT:
Data collection under highly variable weather and illumination conditions around the year will be necessary in many applications of UAV imaging systems. This is a new feature in rigorous photogrammetric and remote sensing processing. We studied performance of two georeferencing and point cloud generation approaches using image data sets collected in four seasons (winter, spring, summer and autumn) and under different imaging conditions (sunny, cloudy, different solar elevations). We used light, quadrocopter UAVs equipped with consumer cameras. In general, matching of image blocks collected with high overlaps provided high quality point clouds. All of the before mentioned factors influenced the point cloud quality. In winter time, the point cloud generation failed on uniform snow surfaces in many situations, and during leaf-off season the point cloud generation was not successful over deciduous trees. The images collected under cloudy conditions provided better point clouds than the images collected in sunny weather in shadowed regions and of tree surfaces. On homogeneous surfaces (e.g. asphalt) the images collected under sunny conditions outperformed cloudy data. The tested factors did not influence the general block adjustment results. The radiometric sensor performance (especially signal-to-noise ratio) is a critical factor in all weather data collection and point cloud generation; at the moment, high quality, light weight imaging sensors are still largely missing; sensitivity to wind is another potential limitation. There lies a great potential in low flying, low cost UAVs especially in applications requiring rapid aerial imaging for frequent monitoring.
* Corresponding author. This is useful to know for communication with the appropriate person in cases with more than one author. 1. INTRODUCTION
Unmanned aerial vehicles (UAVs) offer interesting new possibilities for the remote sensing in wide range of application areas. Eisenbeiss (2009) and Evaraerts (2009) have recently published extensive reviews of UAV technology and examples of numerous potential UAV applications.
For commercial actors it is relevant to manage data collection under different conditions, which is significant difference in comparison to conventional airborne photogrammetric applications. Many UAV remote sensing applications require data collection in certain period of time and optimal conditions cannot be ensured. Examples of these applications include precision agriculture, water quality assessment, insect and disease detection in forests and disaster mapping. Multi-temporal data collection is also necessary to provide time series that are needed in multi-temporal reflectance models of earth surfaces used in environment and climate related applications.
We have been operating Microdrones (2011) md4-200 and md4-1000 quadrocopter UAVs with light weight consumer cameras since 2009. Our objective is to develop robust methods for local area remote sensing and photogrammetry that are operable under different conditions. Our approach in image processing is to carry out rigorous georeferencing and point cloud generation and then perform radiometric corrections. The subsequent applications will be based on analysis of point clouds and spectral information, optionally by fusing passive and active methods. (Honkavaara et al., 2009; Leberl et al., 2010; Hakala et al., 2010; Rosnell and Honkavaara, 2011)
In this study we emphasize georeferencing and point cloud generation. New matching strategies have been proven to provide dense and accurate point clouds from image blocks with large overlaps (DeVenecia et al., 2007; Leberl et al., 2010).
Quality of image matching is dependent to a high extent on radiometric image quality, which is influenced by many factors. In the passive, low-altitude UAV imaging, the major radiation components reflected from the object and entering to the sensor include the direct sun illumination, skylight and illumination reflected from surrounding objects; the dominating radiation component is dependent on the atmospheric state and shadowing objects (Honkavaara et al., 2009). With consumer cameras the amount of light reaching the detector is controlled by exposure time and f-stop, and the signal amplifying is controlled by ISO setting. Sensor sensitivity and stability and especially the signal-to-noise ratio (SNR) are fundamental quality indicators. The image radiometry is also dependent on the object, and the status of object is expected to have influence (for example, leaf-on and leaf-off or snow and no-snow conditions). Furthermore, with low weight imaging systems the image motion and non-regular block structures due to wind will influence the point cloud quality.
Objective of this investigation is to consider aspects of georeferencing and producing point clouds from UAV image data sets that have been collected under different seasons (spring, summer, autumn and winter), under different conditions (sunny, under cloud cover, different solar elevations) and using different systems. We first describe the test arrangements in Section 2. In Section 3 we present the results of geometric processing and point cloud generation and the conclusions are given in Section 4.
2. TEST SET-UP
2.1 UAV imaging systems
Two UAV based imaging systems were used in the experiment. Microdrone md4-200 is an electronic quadrocopter UAV manufactured by Microdrones company (2011). It is capable of
carrying a payload of 250 g at least. Md4-200 is capable of carrying a pre-programmed flight plan that includes waypoints and information of desired flight speed and altitude. Microdrone md4-1000 is a larger version of md4-200. It has the same
software capabilities as the smaller UAV except our version’s
dynamic control for manual flight mode is currently disabled. Md4-1000 is capable to carry a 1.2 kg payload. The md4-200 was equipped with Ricoh GR Digital II and III (Ricoh GR2, GR3) digital compact cameras (Ricoh 2011) and the md4-1000 was equipped with Panasonic Lumix GF1 (Lumix 2011) and Nikon D5000 SLR camera (Nikon 2011). Details of the cameras are given in Table 1.
2.2 Image materials
Missions were carried out in three areas: open, agricultural environment at the Sjökulla test site and built environments around the FGI main building (Masala) and residential area (Masala2) close by. These environments were described in details by Rosnell and Honkavaara (2011).
Images were collected under wide variety of conditions (Table 2, Table 3). All four seasons in Finland were included in this study. The illumination conditions varied from cloudy to sunny weather and variation in solar elevation was 11° to 52°. In most
cases regular vertical blocks with large forward and side overlaps were used, but in some cases also oblique data were collected. Flying heights were 50-130 m and resulting ground sampling distances (GSDs) were 1.4-2.8 cm (and up to 13.7 cm in oblique images). In all blocks the wind speed was moderate, 2-4 m/s. In most cases a preprogrammed flight mode with continuous shoot mode was used, but in some cases also manual mode with live video feed or visual navigation were used (see Rosnell and Honkavaara for details).
Manual control was used in determining image exposure parameters (Table 3). During our previous campaigns we have found out that faster or equal to 1/1600s exposure time produces clear images without any danger of motion blurring. ISO sensitivity greatly affects to a noise level of produced image. We have decided to rather use large aperture and low ISO sensitivity than higher ISO sensitivities. We have mainly used 100-200 ISO sensitivity with pocket cameras and 200-400 with consumer DSLR-cameras. Parameters for imaging were determined by analyzing histogram of shadowed and lighted areas. Our aim was to keep shadows as bright as possible without endangering of saturating bright areas.
Table 1. Details of the cameras (c: principal distance), adepends on the length of exposure; b including lens
Camera Pixel size (µm) c (mm) f-stop Rows Coumns Weight (g) Image interval (s)
Ricoh GR II 2 6 1.9-9a 2544 3656 180 5
Ricoh GR III 2 6 1.9-9 2736 3648 180 5
Lumix GF 1 4.5 20 1.8-16 3000 4000 448b 5
Nikon D5000 5.5 20 2.8-22 2848 4288 830b 1
Table 2. Imaging conditions in Sjökulla (60º14’31’’, 24º23’1’’) and Masala (60°9’39’’, 24°32’41’’) flight campaigns.
Block Date Time Camera UAV Location Season Weather Solar
elevation (°)
Azimuth (°)
Sjo0305gr2 3.5.2010 11:30 GR 2 Md4-200 Sjökulla Spring Sunny 45.5 178.5
Sjo2406gf1 24.6.2010 11:00 GF 1 Md4-1000 Sjökulla Summer Sunny 52.5 164.8
Sjo0910gf1 9.10.2010 12:30 GF 1 Md4-1000 Sjökulla Autumn Cloudy 22.2 197.5
Sjo0910gr3a 9.10.2010 10:00 GR 3 Md4-200 Sjökulla Autumn Cloudy 21.4 157.3
Sjo0910gr3b 9.10.2010 13:00 GR 3 Md4-200 Sjökulla Autumn Cloudy 20.8 205.4
Sjo1602Nik 16.2.2011 12:00 Nikon Md4-1000 Sjökulla Winter Sunny 13.1 212.2
Mas1305gr2 13.5.2010 14:30 GR 2 Md4-200 Masala Spring Sunny 38.0 236.5
Mas0809gr3a 8.9.2010 13:30 GR 3 Md4-200 Masala Summer Cloudy 31.3 213.8
Mas0809gr3b 8.9.2010 14:00 GR 3 Md4-200 Masala Summer Sunny 29.0 222.0
Mas3009gr3 30.9.2010 13:30 GR 3 Md4-200 Masala Autumn Cloudy 22.6 213.3
Mas2402gr3 24.2.2011 14:00 GR 3 Md4-200 Masala2 Winter Sunny 11.2 227.5
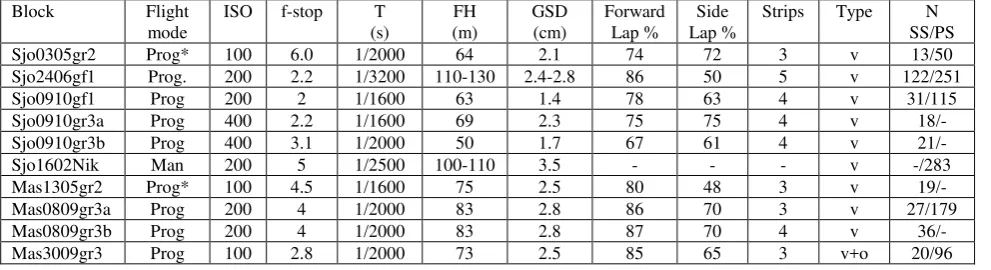
Table 3. Details of image blocks. Prog: Preprogrammed flight plan; Man: Visual control from ground; Man vid: manual flight aided by live video; *: images were taken in stop-and-go mode; T: exposure time; FH: flying height; N SS/PS: number of images in SOCET SET and Photosynth processing; Type: block type oblique (o) or vertical (v). Block details are for the vertical block that was used in SOCET SET.
Block Flight
mode
ISO f-stop T (s)
FH (m)
GSD (cm)
Forward Lap %
Side Lap %
Strips Type N
SS/PS
Sjo0305gr2 Prog* 100 6.0 1/2000 64 2.1 74 72 3 v 13/50
Sjo2406gf1 Prog. 200 2.2 1/3200 110-130 2.4-2.8 86 50 5 v 122/251
Sjo0910gf1 Prog 200 2 1/1600 63 1.4 78 63 4 v 31/115
Sjo0910gr3a Prog 400 2.2 1/1600 69 2.3 75 75 4 v 18/-
Sjo0910gr3b Prog 400 3.1 1/2000 50 1.7 67 61 4 v 21/-
Sjo1602Nik Man 200 5 1/2500 100-110 3.5 - - - v -/283
Mas1305gr2 Prog* 100 4.5 1/1600 75 2.5 80 48 3 v 19/-
Mas0809gr3a Prog 200 4 1/2000 83 2.8 86 70 3 v 27/179
Mas0809gr3b Prog 200 4 1/2000 83 2.8 87 70 4 v 36/-
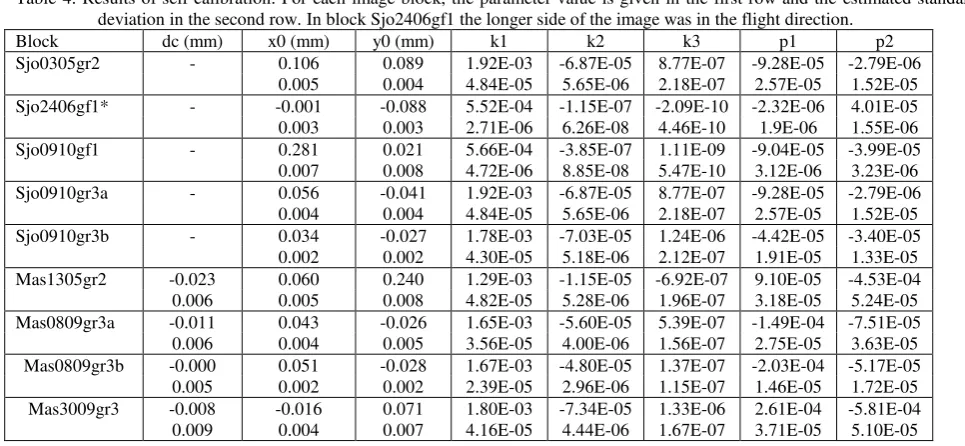
Mas2402gr3 Man vid 100 6.3 1/2000 65 2.3-13.7 60 - 1 o 3/210 Table 4. Results of self calibration. For each image block, the parameter value is given in the first row and the estimated standard
deviation in the second row. In block Sjo2406gf1 the longer side of the image was in the flight direction.
Block dc (mm) x0 (mm) y0 (mm) k1 k2 k3 p1 p2
Sjo0305gr2 - 0.106 0.089 1.92E-03 -6.87E-05 8.77E-07 -9.28E-05 -2.79E-06
0.005 0.004 4.84E-05 5.65E-06 2.18E-07 2.57E-05 1.52E-05 Sjo2406gf1* - -0.001 -0.088 5.52E-04 -1.15E-07 -2.09E-10 -2.32E-06 4.01E-05 0.003 0.003 2.71E-06 6.26E-08 4.46E-10 1.9E-06 1.55E-06
Sjo0910gf1 - 0.281 0.021 5.66E-04 -3.85E-07 1.11E-09 -9.04E-05 -3.99E-05
0.007 0.008 4.72E-06 8.85E-08 5.47E-10 3.12E-06 3.23E-06 Sjo0910gr3a - 0.056 -0.041 1.92E-03 -6.87E-05 8.77E-07 -9.28E-05 -2.79E-06 0.004 0.004 4.84E-05 5.65E-06 2.18E-07 2.57E-05 1.52E-05 Sjo0910gr3b - 0.034 -0.027 1.78E-03 -7.03E-05 1.24E-06 -4.42E-05 -3.40E-05 0.002 0.002 4.30E-05 5.18E-06 2.12E-07 1.91E-05 1.33E-05 Mas1305gr2 -0.023 0.060 0.240 1.29E-03 -1.15E-05 -6.92E-07 9.10E-05 -4.53E-04 0.006 0.005 0.008 4.82E-05 5.28E-06 1.96E-07 3.18E-05 5.24E-05 Mas0809gr3a -0.011 0.043 -0.026 1.65E-03 -5.60E-05 5.39E-07 -1.49E-04 -7.51E-05 0.006 0.004 0.005 3.56E-05 4.00E-06 1.56E-07 2.75E-05 3.63E-05 Mas0809gr3b -0.000 0.051 -0.028 1.67E-03 -4.80E-05 1.37E-07 -2.03E-04 -5.17E-05 0.005 0.002 0.002 2.39E-05 2.96E-06 1.15E-07 1.46E-05 1.72E-05 Mas3009gr3 -0.008 -0.016 0.071 1.80E-03 -7.34E-05 1.33E-06 2.61E-04 -5.81E-04 0.009 0.004 0.007 4.16E-05 4.44E-06 1.67E-07 3.71E-05 5.10E-05
Table 5. Bundle block adjustment statistics: standard deviations of exterior orientation parameters, standard deviations of point unknowns and empirical RMSEs.
Block X0 Y0 Z0 ω φ κ Theoretical (cm) RMSE (cm)
(cm) (cm) (cm) (mdeg) (mdeg) (mdeg) X Y Z X Y Z
Sjo0305gr2 1.7 2.5 0.9 21.3 13.9 4.6 1.2 0.8 2.8 2.4 4.6 8.4
Sjo2406gf1 5.3 4.5 1.7 21.2 24.6 4.8 0.7 0.8 3.2 2.9 4.3 10.9
Sjo0910gf1 1.8 2.3 0.6 20.7 15.0 3.7 0.6 0.5 2.3 2.7 3.4 7.8
Sjo0910gr3a 2.4 3.7 0.9 29.6 17.6 5.8 0.9 0.9 3.2 2.8 2.5 9.7
Sjo0910gr3b 2.1 4.0 1.0 45.7 22.1 6.6 0.7 0.6 2.1 3.6 3.2 6.0
Mas1305gr2 2.2 2.9 1.5 23.4 16.2 7.7 1.6 1.1 4.7 7.5 8.5 6.5
Mas0809gr3a 1.9 2.4 1.3 18.0 13.1 6.7 1.5 1.1 3.8 11.4 8.0 5.1
Mas0809gr3b 2.1 3.0 1.0 21.1 14.1 5.4 1.3 0.9 3.7 11.7 8.5 6.1
Mas3009gr3 1.9 2.4 1.4 19.7 14.3 6.5 2.1 1.5 5.7 8.0 8.0 6.7
2.3 Data processing and evaluation
We have developed two georeferencing methods: one is based on BAE Systems' SOCET SET, which is commercial photogrammetric software, and the other one on the Microsoft®
Photosynth™ service available in the Internet. Details of
methods are given by Rosnell and Honkavaara (2011).
The principle approach is to provide approximate orientations and surface model by the Photosynth (2011), which is designed to handle images with large perspective differences and is based on invariant feature matching methods. Outputs of Photosynth are interior and exterior image orientations and a rather noisy and low density point cloud in local coordinate system, which were transformed to the desired global coordinate system using well-identifiable details in the object.
Accurate orientations and point clouds are provided using Bae Systems SOCET SET (Walker, 2007). The SOCET SET processing begins by orientation determination using well-established self-calibrating bundle block adjustment method. Our idea is to use the orientations and surface model provided by Photosynth as input for the SOCET SET processing, but because we have not yet performed the integration, the approximate orientations for SOCET SET were determined interactively. After good enough approximate orientations are available, automatic tie point matching is carried out; in this study we generated 81 uniformly distributed tie points per
image (only block Mas2402gr3 was processed using interactive tie points). Point clouds are created using the Next Generation Automated Terrain Extraction software (NGATE) (DeVenecia et al., 2007). The point clouds were created per image strip in triangulated irregular network (TIN) format with 10 cm point interval; the matching strategy is mostly based on correlation matching, and in edges edge-based matching is used. We used in Sjökulla the default NGATE strategy (ngate.strategy) and in Masala the strategy designed for areas with high rise buildings (ngate_urban_canyon.strategy). In the winter data (block Mas2402gr3) in addition a strategy for images with low signal power (ngate_low_sp.strategy) was tested.
In this study we self-calibrated in all blocks (excluding Mas2402gr3) the principal point (x0, y0), radial distortion (k1, k2, k3) and decentering distortion (p1, p2) (details of these additional parameter modes are given by Fraser 1997). In the blocks of FGI main building we also determined correction for the principal distance (dc).
In Sjökulla, we used 5 targeted ground control points (GCPs) (1 cm horizontal and 2 cm vertical accuracy); 30 photogrammetric-ally determined points were used as checkpoints (2 cm horizontal and 6 cm vertical accuracy) (details are given by Rosnell and Honkavaara, 2011). In the FGI main building, 10 roof corners and 3 road paintings were used as GCPs (accuracy of 3-5 cm in all coordinates); these were used as independent
checkpoints one at a time by using other points as GCPs. The block Mas2402gr3 was georeferenced using national digital elevation model and topographic data base, and GPS points.
First of all, we evaluated the performance of photogrammetric blocks by considering theoretical standard deviations of unknown parameters (exterior orientation, point unknowns and self-calibration) and by using independent checkpoints. Secondly, quality of images and photogrammetric point clouds were studied visually. We did not evaluate accuracy of point clouds in this study, because we considered that the success rate of matching was more critical question in these first evaluations.
3. RESULTS
3.1 General results
Our previous study with blocks Sjo2406gf1 and Mas3009gr3 showed that the SOCET SET provided dense point clouds that followed photogrammetric principles; the accuracy of point clouds approached the accuracy of point determination in aerial triangulation (Rosnell and Honkavaara, 2011). The point clouds by Photosynth were sparser, noisier and less accurate than photogrammetric point clouds and burdened with ball shaped distortion over the area. The most problematic objects for the Photosynth were uniform objects, where the feature based matching failed. The NGATE was less sensitive to uniform surfaces, but more problems appeared in 3D objects (especially trees) than in Photosynth.
In self-calibration, most of the parameters could be calibrated with a good accuracy (Table 4). For example, estimated standard deviation of principal point was 2-8 µm. In some cases the parameters of the same camera appeared to remain quite stable in time and location (for example, calibrations of the GR 3 in 8.9.2010 in Masala and in 9.10.2010 in Sjökulla). However, also large changes appeared, so it is advisable to carry out campaign specific calibrations. Our previous results showed that proper calibration had great impacts in block accuracy (Rosnell and Honkavaara, 2011).
A certain system and block setup provided similar accuracy results in certain test area over the time (Table 5). Block Sjo2406gf1 differed significantly from other blocks, because it had different structure (larger area, greater flying height). The standard deviations of the perspective center positions were on the level of 1-4 cm and the attitude accuracy deviated from
0.004° in κ to up to 0.045° in ω. In Sjökulla, the point determination RMSEs were 3-4 cm in horizontal coordinates and 6-11 cm in height. In Masala, the RMSEs were 7-12 cm in X, 8-9 cm in Y and 5-7 cm in Z. In both test areas the empirical applications. Further tuning of block adjustments and self-calibration could have been possible, but the current result is sufficient for our point cloud generation investigations.
3.2 Influence of season
The season has many influences in object and imaging conditions. The largest seasonal differences appear in land covers (vegetated surfaces, snow cover) and in forests with deciduous trees (leaf-on and leaf-off conditions). Season influences in illumination conditions (in Southern Finland variation of maximum solar elevations is 5-50°) and there are also seasonal differences under atmospheric conditions: for example, in Finland the spring is sunnier than other seasons.
a) b)
c) d)
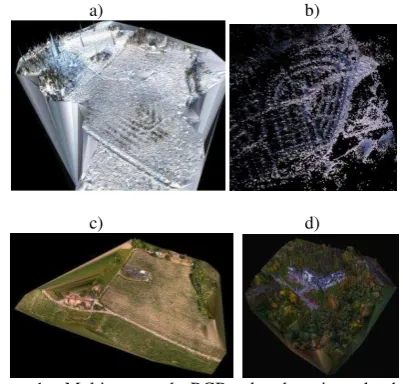
Figure 1. Multi-temporal RGB-colored point clouds by Photosynth: a) Sjo1602Nik, b) Mas2402gr3, c) Sjo2406gf1 and d) Mas3009gr3. In a, c and d an interpolated point cloud is shown (indicated sufficiently dense and inclusive point cloud) but in Sundsberg data the interpolation was not successful.
RGB colored point clouds created by Photosynth using winter, summer and autumn images are shown in Figure 1. Photosynth was succesful in ordering all tested blocks and provide point clouds without any apriori orientation information. Lower point densities were experienced in uniform surfaces (asphalt, flat roof covers, snow) and some noise appeared in point clouds (not visible in Figure 1). Point cloud quality was in average poorer in snow covered areas, but as far there were some features, processing was successful.
Multi-temporal NGATE point clouds of FGI main building are shown in Figure 2. Images were collected under cloudy and sunny conditions, with 23º to 38º solar elevations in leaf-on and leaf-off seasons (spring to autumn). The point cloud generation was successful in general, but failures appeared in homogeneous surfaces (flat black roof and asphalt). Clearest differences caused by season appeared in deciduous trees and bushes; the point cloud generation was the poorest in leaf-off data (Figure 2a), which is the expected behaviour. In other covers we did not detect seasonal effects.
point densities. The point cloud generation was successful if there were features in the images, but the method did not typically manage to find points in uniform, flat snow covers (Figure 3). Also, shadows had an effect on matching: more points appeared in edges of shadows and point clouds appeared to be sparser in shadowed areas.
a)
b)
c)
d)
Figure 2. Multi-temporal orthophotomosaics and point clouds of the FGI main building where colour indicates height value and in black regions matching was not successful: a) Mas1305gr2 (sunny), b) Mas0809gr3a (cloudy), c) Mas0809gr3b (sunny) and d) Mas3009gr3 (cloudy).
Figure 3. Left: anaglyf stereo model of winter data Mas2402gr3. Right: Point cloud by NGATE.
3.3 Influence of imaging conditions
Point clouds created using images collected in the area of FGI main building with different solar elevations and cloudy and sunny weathers are shown in Figure 2. The best point densities over the homogeneous roof and asphalt surfaces were obtained using images collected under sunny weather, which is likely to be due to the higher image quality (Figure 2a, c); when using images collected under cloud cover, matching failed to large extent with these objects. On the other hand, matching was not successful in shadows of the building and trees (in asphalt in the front side of the model) using data collected under sunny conditions; point clouds were generated in the backyard or the building with better success ratio with cloudy data. Quality of point clouds of tree surfaces appeared to be better with the data collected under cloud cover (Figure 2b).
a) b)
c) d)
Figure 4. Examples of image quality with different sensors and conditions: a) Sjo0305gr2 (sunny), b) Sjo0910gf1 (cloudy), c) Sjo0808gr3a (cloudy) and d) Sjo0910gr3b (cloudy).
a)
b)
Figure 5. Orthophotomosaics and point clouds of the Sjökulla blocks a) Sjo0910gr3b and b) Sjo0910fg1.
3.4 Influence of imaging sensor
Influence of the imaging sensor was studied with the Sjökulla data, where images were collected using the Ricoh and Lumix cameras. The Lumix (Figure 4b) clearly outperformed the Ricoh cameras (Figure 4a, c, d) in image quality. Ricoh cameras appeared to be very noisy in all evaluated data sets; the noisiest images were the ones collected in morning on cloudy weather using ISO setting of 400 (Figure 4c).
Examples of point clouds created using the images collected by Lumix and Ricoh in the afternoon in 10.9 are shown in Figure 5. The image quality influenced clearly the point cloud quality. Matching was mostly successful with the higher quality Lumix, while large areas with matching failures appeared with Ricoh. The reflectance target with nominal reflectance of 0.05 appeared to be the most challenging surface for matching.
4. DISCUSSION AND CONCLUSIONS
Data collection under different conditions and in different seasons will become highly relevant in many UAV remote sensing applications. The passive imaging is a complicated process with a large number or factors influencing the data quality and performance of applications, so detailed understanding of different factors is necessary.
We expect that point cloud generation by image matching will be a fundamental preprocessing step in many future UAV applications that utilize passive image data. We investigated the influences of various factors (season, solar elevation, weather conditions and sensor) in point cloud generation using two representative methods. The results indicated that all of the factors influenced the quality of point clouds, and that surprisingly, the sunny weather did not always provide the best results. Cloudy weather may be more suitable for (pocket) cameras, featured with rather limited dynamic range than sunny weather with drastic lightning differences between shadowed and lighted areas. We did not evaluate the absolute accuracy of point clouds in this study because we think that the success of matching is more critical factor. According to our experiences the accuracy of height points provided by NGATE was close to the accuracy of aerial triangulation, while the Photosynth point clouds were more noisy and distorted. On the other hand, results with Photosynth proved that the novel image collection ordering methods were successful in ordering the UAV image blocks in all tested seasons and imaging conditions.
The signal-to-noise ratio of the sensor is the fundamental quality indicator from the point of view of accurate point cloud generation. It is also important to select the sensor settings properly to provide high SNR, blur-free and high dynamic range images. Currently, the lack of high quality sensors for micro and mini UAVs is a challenge in multitemporal all weather applications with these systems. We did not consider in this study wind conditions, which is a critical factor with low-weight UAV systems. Gusty wind has remarkable effects in photo and block quality.
In the future it will be important to improve photogrammetric point cloud generation methods to be able to process uniform surfaces and shadowed areas, and also more detailed analysis of different objects, relevant for specific applications, will be necessary. Moreover, it is crucial to be able to process automatically and with high success rate large number of images that have drastic perspective and angular differences; our experiences with Photosynth and SOCET SET indicate that this is already possible, but methods should be further improved. Radiometric processing should be investigated in the forthcoming studies. We also emphasize based on our results
Fraser, C.S., 1997. Digital camera self-calibration, ISPRS Journal of Photogrammetry & Remote Sensing, 52, 149-159.
Hakala, T., Suomalainen, J., Peltoniemi, J.I., 2010. Acquisition of Bidirectional Reflectance Factor Dataset Using a Micro Unmanned Aerial Vehicle and a Consumer Camera. Remote Sens., 2, 819-832.
Honkavaara, E., Arbiol, R., Markelin, L., Martinez, L., Cramer, M., Bovet, S., Chandelier, L., Ilves, R., Klonus, S., Marshall, P., Scläpfer, D., Tabor, M., Thom, C., Veje, N., 2009. Digital airborne photogrammetry—A new tool for quantitative remote sensing?—A state-of-the-art review on radiometric aspects of digital photogrammetric images. Remote Sens., 1, 577-605. Leberl, F., Irschara, A., Pock, T., Meixner, P., Gruber, M., Scholz, S., Wiechert, A., 2010. Point clouds: Lidar versus 3D vision. Photogrammetric Engineering & Remote Sensing, 76, 1123-1134.
Rosnell, T., Honkavaara, E., 2011. Point Cloud Generation from Aerial Image Data by Quadrocopter Type Micro Unmanned Aerial Vehicle and Digital Still Camera. Submitted to Sensors.
References from Books:
Walker, S., 2007. New features in SOCET SET ®. In Photogrammetric Week ‘07; Fritch, D., Ed.; Wichmann Verlag: Heidelberg, Germany, 2007; pp. 35-40.
DeVenecia, K., Walker, S., Zhang, B., 2007. New Approaches to Generating and Processing High Resolution Elevation Data with Imagery. In Photogrammetric Week ‘07; Fritch, D., Ed.; Wichmann Verlag: Heidelberg, Germany; pp. 297-308. References from Other Literature:
Everaerts, J., 2009. NEWPLATFORMS - Unconventional Platforms (Unmanned Aircraft Systems) for Remote Sensing 102 pages. Frankfurt a.M. EuroSDR official publication 56. Eisenbeiss, H., 2009. UAV Photogrammetry. DISS. ETH NO. 18515.
References from websites: