REGIONALIZATION OF AGRICULTURAL MANAGEMENT
BY USING THE MULTI-DATA APPROACH (MDA)
G. Baretha,b,* and G. Waldhoff a
a Institute of Geography (GIS & Remote Sensing Group), University of Cologne, 50923 Cologne, Germany - (g.bareth, guido.waldhoff)@uni-koeln.de
b ICASD - International Center for Agro-Informatics and Sustainable Development (www.icasd.org)
KEY WORDS: crop, agriculture, management, GIS, remote sensing, multi-data approach, land cover, land use, regional modelling
ABSTRACT:
Regional process-based (agro-)ecosystem modelling depends mainly on data availability of land use, weather, soil, and agricultural management. While land use, weather, and soil data are available from official sources or can be captured with monitoring systems, management data are usually derived from official statistics for administrative units. For numerous spatial modeling approaches, these data are not satisfying. Especially for process-based agro-ecosystem modeling on regional scales, spatially disaggregated and land use dependent information on agricultural management is a must. Information about date of sowing, dates of fertilization, dates of weeding etc. are required as input parameters by such models. These models consider nitrogen (N)- and carbon (C)-matter fluxes but essential amounts of N-/C-input and N-/C-output are determined by crop management. Therefore, in this contribution a RS- and GIS-based approach for regional generation of management data is introduced. The approach is based on the Multi-data Approach (MDA) for enhanced land use/land cover mapping. The MDA is a combined RS and GIS approach. The retrieved information from multitemporal and multisensoral remote sensing analysis is integrated into official land use data to enhance both the information level of existing land use data and the quality of the land use classification. The workflow of the MDA to generate enhanced land use and land cover data consists basically of two components: (a) the methods and data of the remote sensing analysis and (b) the methods and data of the GIS analysis. The MDA results in disaggregated land use data which can be used to link crop management information about the major crops and especially crop rotations like date of sowing, fertilization, irrigation, harvest etc. to the derived land use classes. Consequently, depending on the land use, a distinct management is given in a spatial context on regional scale. In this contribution, three case studies of different regions in Germany will be presented: (i) the dairy farm region
“Württembergisches Allgäu”, (ii) the arable land region “Kraichgau”, and (iii) the diverse Rur-Watershed in Western Germany. For each of the study regions, a different MDA-based approach for regionalizing agricultural management is applied and will be discussed.
1. INTRODUCTION
Since decades, regional modelling of ecosystems is in the focus of numerous research activities and publications (Li, 1996; Li, 2007; Wolf et al., 2012). For agro-ecosystems models which focus on plant growth, yield forecast, and matter fluxes are developed and are available for regional applications (Klar et al., 2008; Leip et al., 2008; Lenz-Wiedemann et al., 2010). The most important limitations of regional application of agro-ecosystem models are described by Kersebaum et al. (2007). The authors state that the “applications of agro-ecosystem models on field or regional scale are mostly characterized by a high uncertainty of input data, especially regarding soil and management information”. This fairly strong statement is a result of comparing 18 different models on the same input dataset. Bareth and Angenendt (2003) and Bareth and Yu (2005) present similar findings for regional economic-ecological agro-ecosystem modelling. In this context, Bareth (2009) proposes the establishment of spatial environmental information systems (SEIS) which provides such data.
In this contribution, the focus is on generating spatial management data for regional agro-ecosystem modelling. Process-based models like the DNDC model (www.dndc.sr. unh.edu) need detailed input data such as date of sowing, of fertilizing, of weeding, of tillering etc. Additionally, the amounts of the inputs are required (e.g. irrigation, fertilizer etc.). Due to the above mentioned problem and limitation of the
availability of management data, different approaches for providing spatial management are described. Bareth et al. (2001) use administrative units to distribute and calculate average fertilizer inputs for townships while Neufeldt et al. (2006) use crop specific inputs for spatial modelling units. Similar disaggregated approaches are described by Leip et al. (2008) and Smith et al. (2010), especially the latter focus on a modelling tool for management data.
In contrast to the described and available approaches to regionalize management data on administrative or modelling units, we propose in this contribution a new method to produce spatially disaggregated management data. The proposed method is based on the Multi-data Approach (MDA) (Bareth, 2008; Bareth and Waldhoff, 2009) and builds on crop type maps or even crop rotation (CR) maps (Waldhoff et. al, 2012). Therefore, we (i) introduce the general approach of the MDA, we (ii) present results of the land use classification for three agricultural regions in Germany, and we (iii) evaluate the potential of using the MDA to produce spatially disaggregated agricultural management data.
2. MULTI-DATA APPROACH (MDA)
The basic idea of the MDA is integrating remote sensing classification data into official land use data and overlaying additional available and appropriate data sources (Bareth,
2001). The workflow of the MDA to generate enhanced land use and land cover data consists basically of a GIS- and a RS-part (Fig.1). The task of the remote sensing RS-part is to classify multitemporal (and multisensoral) satellite imagery and to provide a classification assessment in terms of data quality.
For the analysis of crop rotations, multitemporal satellite imagery are of key importance to consider phenological characteristics (Rohierse and Bareth, 2004). The results are imported into a GIS environment. Here, the classified data are combined with additional relevant and available topographical and/or land cover data. These are usually official data provided by national surveying and mapping bureaus. The idea is to use high quality topographic spatial information e.g. about residential area to improve the land use classification. In the latter case, all affected land use classes of the remote sensing analysis will not be considered any more.
Besides official land use data which are available in topographic information systems like the German official topographic-cartographical information system called ATKIS (www.atkis.de) or e.g. the official land use database of China (http://ngcc.sbsm.gov.cn/english/), numerous land use infor-mation are stored in various spatial databases. These spatial biotope/biodiversity databases (e.g. in Germany), spatial databases of national parks, research projects, water protection areas etc., can be used for such an approach. Additionally, data from official statistics like agricultural or land use data have to be considered (Bareth 2009). The MDA is described in detail by Bareth (2008).
Figure 1. Schematic procedure of the MDA
3. CASE STUDIES
3.1. Dairy Farm Region “Württembergisches Allgäu”
The first case study is the intensive dairy farm region of the
“Württembergisches Allgäu” in Southern Germany (Bareth 2000; Bareth et al. 2001). For the MDA, an IRS-1C image (1st September 1997) was analyzed for land use and was overlaid with numerous available official GIS data. The most important GIS data source is the ATKIS, the German topographic vector database in a scale of 1:25,000. Besides ATKIS, available data on biotopes, water and nature protection areas as mentioned above were used for overlay analyses. Hence, the final MDA land use data contain numerous spatial information besides the RS derived classification. In Fig. 2, the IRS-1C image is visualized with the selected topographical GIS vector data. Only by displaying urban and forest polygons, it is very obvious that a significant proportion of the image is covered by spatial knowledge from an additional source.
Figure 2. IRS-1C image with topographical GIS vector data
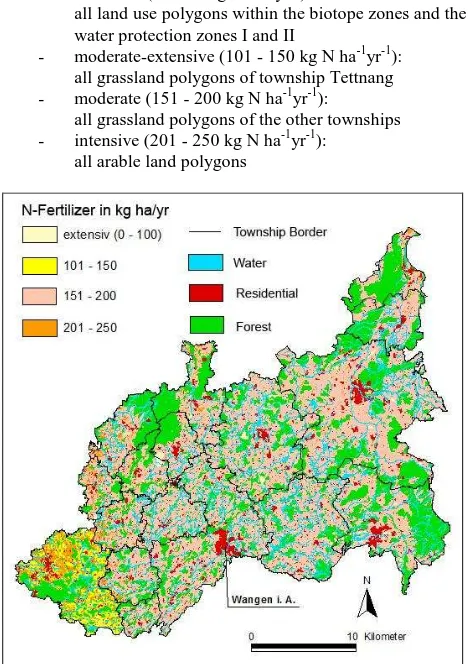
The generated final MDA land use data serve in a next step as the base for spatially disaggregating agricultural management. Here, the fertilizer input is presented as an example. The N-fertilizer input for grassland and arable land is calculated for each administrative unit (township) by using agricultural statistics (fertilizer amount, livestock number etc.). The distribution of the fertilizer amount within a township is based on the land use data. But most important, some land use classes in the MDA land use indirectly contain limitations by law for N-fertilizer input e.g. special water protection zones or special biotopes. Therefore, following four rules were applied for the distribution (Bareth 2000):
- extensive (0 - 100 kg N ha-1yr-1):
all land use polygons within the biotope zones and the water protection zones I and II
- moderate-extensive (101 - 150 kg N ha-1yr-1): all grassland polygons of township Tettnang - moderate (151 - 200 kg N ha-1yr-1):
all grassland polygons of the other townships - intensive (201 - 250 kg N ha-1yr-1):
all arable land polygons
Figure 3. Spatially disaggregated regionalization of N-fertilizer
input for the “Württembergisches Allgäu”
The result of the spatial and land use coupled N-fertilizer input regionalization for the “Württembergisches Allgäu” is shown in Fig. 3. It is clearly visible that there is no large difference between the townships, except for Tettnang (far Southwest), which has a significant lower input due to comparable low livestock numbers resulting in a comparable low N-input from manure. The administrative border gives a strong spatial footprint which is usually the case for administrative based maps. The other townships are pasture dominated and the amount of animals per land unit is also comparable. In general, the area of arable land in the region is sparse which results in a lower input of mineral fertilizer compared to arable land regions
like the “Kraichgau”. The latter is described in the next case
study.
3.2. Arable Land Region “Kraichgau”
The “Kraichgau” is located in Southern Germany in the North-West of Baden-Württemberg which is the South-North-Western state of Germany. In the South-West of the “Kraichgau”, the Black Forest and in the North the Odenwald are adjoining. In the west the Rhine River and in the North-East the Neckar River frame the study area. The “Kraichgau” is the second case study and was investigated by Rohierse (2004) and Rohierse and Bareth (2004).
For the MDA, four IRS-1C images were purchased for the years 2000 and 2001 and a multitemporal land use classification was carried out (Rohierse and Bareth, 2004). In Fig. 4, the result of the analyses is shown. It is clearly visible, that compared to the land use map of the “Württembergisches Allgäu”, crop types were identified. But the differentiation between winter cereals and summer cereals was not satisfying. Therefore, all cereals are generalized in one land use class.
Figure 4. Crop type map for the “Kraichgau” (Rohierse, 2004)
The generated crop type data is essential for improving the regional disaggregation of N-fertilizer input data. The improved method is presented in Fig. 5 and was developed by Rohierse (2004) and Rohierse et al. (2002). As mentioned before, the MDA produces disaggregated land use data which can be used to link N-fertilizer input according to spatial-based rules. The spatial-based rules assume that the farmers’ management is carried out according to good practice. This includes avoiding
over-fertilization and satisfying laws regulating management in protection or special management zones. The advantage of this more detailed approach is the loss of the footprint of administrative units. The latter is visualized in Fig. 6, 7, and 8.
Base Geodata
Multi-Data Approach
Final Land Use
N-Input Distribution according to good practise
Generated Geodatabase
•satellite data
•ATKIS data
•soil map
•DEM
Implementation of agricultural statistics
regionalization
Figure 5. MDA for the “Kraichgau” (Rohierse, 2004)
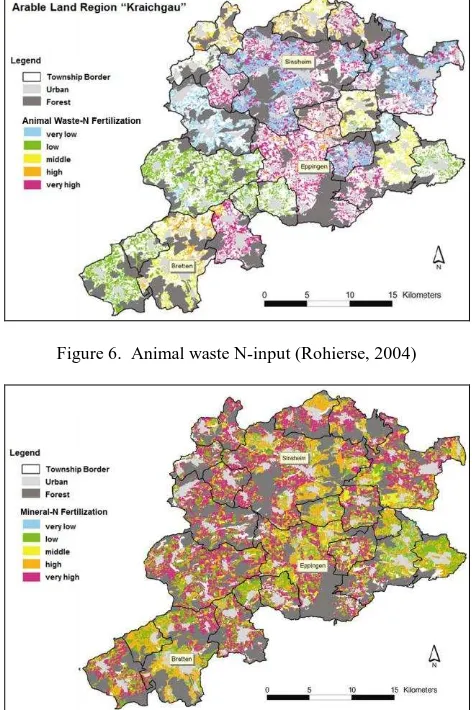
In Fig. 6 and Fig. 7, the MDA-based spatially disaggregated N-input from animal waste and mineral fertilizer are displayed. While the animal waste map still shows clearly administrative units, the mineral fertilizer map does not. The latter is caused by the distribution of N according to good practice in dependence of crop type. The N-input was spatially distributed according to N-removal and soil-N availability. Additionally, protection
areas were considered as before for the “Württembergisches Allgäu”. The strong administrative footprint of the animal waste in Fig. 6 is caused by the data source, the livestock numbers per administrative unit.
Figure 6. Animal waste N-input (Rohierse, 2004)
Figure 7. Mineral N-input (Rohierse, 2004)
The total N-fertilizer input map for the “Kraichgau” is given in Fig. 8. It represents the sum of N-input from animal waste and mineral fertilizer. Astonishingly, the MDA-based regionalization of N-management does not show a strong administrative footprint anymore even so the data used to calculate the amount of N-input are for administrative units. The distribution of the N-amount within each administrative unit according to complex spatial rules and land use classes is very strong and gives a more realistic pattern.
Figure 8. Total-N input for the “Kraichgau” (Rohierse, 2004)
3.3. The Rur-Watershed
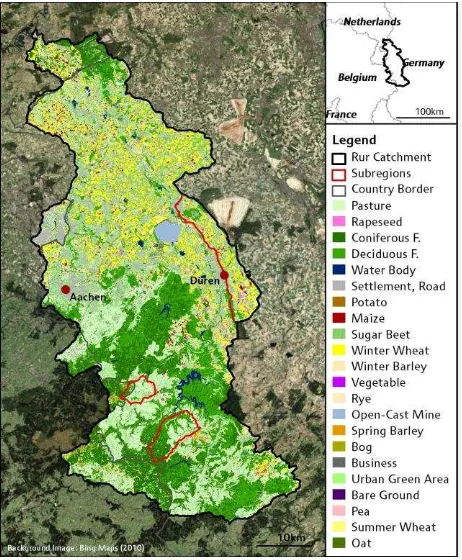
The catchment of the river Rur is situated in Western Germany, with small parts in The Netherlands and Belgium. The study area is characterised by a rather flat terrain in the northern part, which is dominated by intensive agriculture, whereas the southern part consists of low mountain ranges with forest areas and grassland (Fig. 9) (Waldhoff et al., 2011).
For the MDA, numerous satellite imagery of various sensors (ASTER, RapidEye a.m.m.) for the years 2007-2011 were purchased within the framework of the interdisciplinary
“Transregional Collaborative Research Centre 32 (CRC/TR32): Patterns in Soil-Vegetation-Atmosphere-Systems: Monitoring,
Modelling and Data Assimilation” (www.tr32.de). As a result, the classification of crop types is possible (Fig. 9). In contrast to the before mentioned case studies, the ambitious objective of this case study is the MDA-based production of crop rotation maps serving as a data rich environment for the regionalization of agricultural management.
Multitemporal land use classifications are carried out for each year, yielding annual crop type maps. By overlaying the annual crop type maps in a GIS-environment, regional crop rotation patterns can be produced in a spatial context. As an example, the annual crop type data for the years 2007 to 2009 are summarized in crop rotations in Fig. 10. The results of the crop rotation mapping are very promising due to its spatial resolution. The data/map scale and the quality of the classification enable the spatial identification of field or management units. For these spatial units, the
Figure 9. Crop type map for the Rur-Watershed (Waldhoff et al., 2011)
Figure 10. Crop rotation map 2007-2009 for the Rur-Watershed (Waldhoff et al., 2011)
belonging crop rotation information with its annual crop type coverage is available. The annual change of the land use pattern can now be addressed for the Rur-Watershed. Related to this annual alteration, is the change of crop dependent matter fluxes and management practices like N- and inputs, N- and C-removals etc. Consequently, the mapping of annually varying management patterns is only possible by using such a land use data base.
4. DISCUSSION & CONCLUSION
Different approaches of land use dependent regionalization of agricultural management are presented in this contribution. In contrast to many other published approaches, the MDA-based case studies focus on the integration of available related data from multiple sources and data integration technologies within a GIS-environment. These data are the base for the spatial distribution of agricultural management. Besides GIS, the multitemporal and multisensoral remote sensing classification for multiannual crop type mapping is the core and key of the presented approach. Furthermore, the distribution of e.g.
calculated N-input is carried out by using knowledge-based production rules which are developed for each crop type and a set of spatial settings (e.g. protection areas).
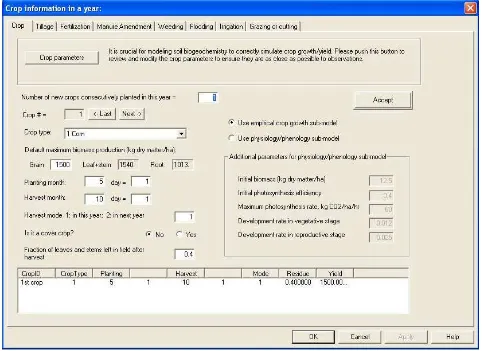
In this contribution, we presented in three case studies the development and improvement of the regionalization of agricultural management based on the MDA. From the beginnings in the late nineties, a step-wise improvement is documented which finally results in crop rotation maps. From our knowledge, the presented approach is the only method to provide the spatial input data which are needed for regional agro-ecosystem modelling and which were identified by Kersebaum et al. (2007) as the most limiting parameter in regional agro-ecosystem modelling. As an example, a screenshot of one of the latest DNDC versions is shown in Fig. 11. For each year of a long-term simulation, the crop type or crop types (in case of a cropping index > 1) have to be provided with all related management information. Finally, the MDA derived land use data can provide crop cover with the related soil information for large regions.
Figure 11. Screenshot of the DNDC model (9.1) (http://www.dndc.sr.unh.edu/)
5. REFERENCES
Bareth, G., 2009. GIS- and RS-based spatial decision support: structure of a spatial environmental information system (SEIS). International Journal of Digital Earth, 2(2), pp. 134-154.
Bareth, G., 2008. Multi-Data Approach (MDA) for enhanced land use and land cover mapping. Proc. XXI ISPRS Congress, 3-11 July 2008, Beijing, China.
Bareth, G., 2001. Integration of an IRS-1C land use classification in the official topographical information system (ATKIS) to enhance the quality of the information of arable
land and grassland for a dairy farm region in southern Germany (in German with English summary). GIS 6/2001, pp. 40-45. Bareth, G., 2000. Emissions of Greenhouse Gases from Agriculture - Regional Presentation and Estimation for a dairy farm region by using GIS. (PhD thesis in German with English summary). Hohenheimer Bodenkundliche Studien 56.
Bareth, G. and Andenedt, E., 2003: Ökonomisch-Ökologische Modellierung von klimarelevanten Emissionen aus der Landwirtschaft auf regionaler Ebene (Economic-ecological modeling of greenhouse gases from agriculture on regional level). Berichte über Landwirtschaft 81(1), pp.29-56.
Bareth, G. and Yu, Z., 2005. Interfacing GIS with a process based agro-ecosystem model – case study North China Plain. Proceedings of the International Symposium on Spatio-temporal Modelling, Spatial Reasoning, Spatial Analysis, Data Mining and Data Fusion, Peking University, China, Vol. XXXVI, Part 2/W25, pp. 69-74.
Bareth, G., Heincke, M., and Glatzel, S., 2001: Soil-land-use-system approach to estimate nitrous oxide emissions from agricultural soils. Nutrient Cycling in Agroecosystems 60, pp.219-234.
Kersebaum, K.Ch., Hecker, J-M., Mirschel, W. and Wegehenkel, M., 2007. Modelling water and nutrient dynamics in soil-crop systems. Springer, Berlin Heidelberg New York. Klar, C.W., Fiener, P., Neuhaus, P., Lenz-Wiedemann, V.I.S., and Schneider K., 2008. Modelling of soil nitrogen dynamics within the decision support system DANUBIA. Ecological Modelling, 217(1-2): 181-196.
Lenz-Wiedemann, V.I.S., Klar, C.W., and Schneider, K., 2010. Development and test of a crop growth model for application within a Global Change decision support system. Ecological Modelling 221, pp. 314-329.
Li, C., 2007. Modeling soil organic carbon sequestration potential with modeling approach. In: H. Tang, E. van Ranst and J. Qiu (eds.): Simulation of Soil Organic Carbon Storage and Changes in Agricultural Cropland in China and Its Impact on Food Security. China Meteorological Press.
Li, C., Narayanan, V., and Harriss, R.C., 1996. Model estimates of nitrous oxide emissions from agricultural lands in the United States. Global Biogeochemical Cycles 10, pp.297-306.
Neufeldt, H., Schäfer, M., Angenendt, E., Li, C., Kaltschmitt, M., and Zeddies, J., 2006. Disaggregated greenhouse gas emission inventories from agriculture via a coupled economic-ecosystem model. Agriculture, Ecosystems and Environment 112, pp.233-240.
Rohierse, A., 2004: Regionale Darstellung der Umwelt-belastungen durch klimarelevante Gase in der Agrarlandschaft Kraichgau - Das Boden-Landnutzungs-Informations-System für Treibhausgasemissionen (Regionali-zation of greenhouse gases
for the „Kraichgau“ – The Soil-Land use- Information System
for Greenhouse Gases) (PhD thesis in German with English summary). University oh Hohenheim-Stuttgart. http://opus.ub.uni-hohenheim.de/volltexte/2004/48/
Rohierse, A. and Bareth, G., 2004. Integration of multitemporal remote sensing analyses in ATKIS for the disaggregation of the object type arable land (in German with English summary). GIS, 03/2004, pp. 35-41.
Rohierse, A., Bareth, G., and Doluschitz, R., 2002: Regionale Darstellung der Umweltbelastung durch klimarelevante Gase am Beispiel des württembergischen Kraichgaus. Proceedings GIL 2002, 18.-20.09.2002, Dresden.
Smith, W.N., Grant, B.B., Desjardins, R.L., Worth, D., Li, C., Boles, S.H., and Huffman, E.C., 2010. A tool to link agricultural activity data with the DNDC model to estimate GHG emission factor in Canada. Agriculture, Ecosystems and Environment 136, pp.301-309.
Waldhoff, G. and Bareth, G., 2009. GIS- and RS-based land use and land cover analysis - case study Rur-Watershed, Germany. In: Lin, L., Xia, L., Kai, L. and Xinchang, Z. (eds.): Geoinformatics 2008 and Joint Conference on GIS and Built Environment: Advanced Spatial Data Models and Analyses. Guangzhou, Guangdong, China. Proc. SPIE, Vol. 7146, 714626. doi:10.1117/12.813171
Waldhoff, G., Curdt, C., Hoffmeister, D. and Bareth, G., 2012. Analysis of multitemporal and multisensor sensing data for crop rotation mapping. Proceedings of the XXII Congress of the ISPRS, Melbourne, Australia, (accepted).
Waldhoff, G., Curdt, C., Hoffmister, D. and Bareth, G., 2011. Spatio-temporal land use patterns for regional (agro-)ecosystem modelling. Proc. Int. Symposium on Remote Sensing and GIS methods for Change Detection and Spatio-Temporal Modelling (CDSM),15.-16.12.2011, Hong Kong, China.
Wolf, B., Kiese, R., Chen, W., Grote, R., Zheng, X., and Butterbach-Bahl, K., 2012: Modeling N2O emissions from steppe in Inner Mongolia, China, with consideration of spring thaw and grazing intensity. Plant and Soil 350(1-2):297-310.
6. ACKNOWLEDGEMENTS
The case studies of the Württembergisches Allgäu and of the
“Kraichgau” were investigated within the Graduiertenkolleg GRK 259 “Mitigation Strategies for the Emission of Greenhouse Gases and Environmentally Toxic Agents from Agriculture and Land Use“. The case study of the Rur-Watershed was investigated within the CRC TR 32 “Patterns in Soil-Vegetation-Atmosphere-Systems. Monitoring, Modelling
and Data Assimilation”. All three projects were/are funded by the German Research Foundation (DFG). We thank the German Aerospace Center (DLR) for the provision of data from the RapidEye Science Archive and Geobasis.NRW for the provision of the ATKIS-Basis-DLM. Additionally, we thank the
Landwirtschaftskammer NRW for the supply of the ‘Feldblock’
data.