INTEGRATION OF DIFFERENT FILTER ALGORITHMS FOR IMPROVING THE
GROUND SURFACE EXTRACTION FROM AIRBORNE LIDAR DATA
S.S. Deng a, *, W.Z. Shi b a
Dept. of Land Surveying and Geoinformatics, the HK Polytechnic University, Hong Kong – [email protected] b Dept. of Land Surveying and Geoinformatics, the HK Polytechnic University, Hong Kong – [email protected]
KEY WORDS: Airborne LiDAR, Filter algorithm, Integration, Filtering error, Statistics
ABSTRACT:
An important step for processing airborne Light Detection And Ranging (LiDAR) data is point cloud filtering. Points striking on vegetation and man-made objects and low points (points significantly lower than neighboring points) are filtered out, leaving ground points for generation of digital terrain models (DTM). A variety of filter algorithms have been developed, which have disparate performance in different landscape and environment. This study investigates the potential of integrating the results of different filter algorithms for improving the ground surface extraction from the LiDAR point cloud. A simple procedure was proposed based on a statistical approach to identify and remove filtering errors and combine ground points from each filtering result. The procedure was tested in an area with rugged terrain covered by dense vegetation of variable heights. The filtering results of two popular filter algorithms, progressive TIN (Triangulated Irregular Network) densification and hierarchical robust interpolation, were integrated. The filtering results of two algorithms and the integration result were qualitatively evaluated. The evaluation results indicated that the proposed integration procedure can remove most vegetation points that were not filtered out by filter algorithms, and combine ground points from each filtering result.
* Corresponding author
1. INTRODUCTION
Land surface analysis results are subject to both the accuracy and the processing methods of Light Detection And Ranging (LiDAR) data. LiDAR point cloud filtering, i.e. removal of non-ground points, remains a challenging problem, especially in mountainous area (Lu et al., 2009). A variety of filter algorithms have been developed (Mongus and Žalik, 2012) and algorithm comparisons were given in a number of studies (e.g. Sithole and Vosselman, 2003; 2004; Meng et al., 2010). The selection of the appropriate filter algorithm depends on the type and complexity of the landscape (Sithole and Vosselman, 2004; James et al., 2007; Slatton et al., 2007). There is no filter algorithm suitable for all circumstances and each algorithm has its own advantage and limitation in a particular environment. This study focuses on development of a procedure to integrate filtering results of different algorithms, not on comparison of filter algorithms. The purpose of the proposed procedure is to incorporate advantages of different filter algorithms so that the majority of filtering errors can be eliminated and ground points from each filtering result are integrated. The filtering errors mainly refer to the non-ground points that are not filtered out by the filter algorithms and retain in the ground point sets derived by filter algorithms. We are not expecting to remove all filtering errors since the complexity of terrain and of above-ground objects usually make a clear differentiation between ground and non-ground points impossible.
The integration procedure involves a statistical approach to eliminate filtering errors and combine ground points from each filtering result based on thresholds defined by statistics of elevation differences between ground point sets and digital terrain models (DTM). In the following parts of the paper, two
popular filter algorithm used for illustration of the proposed procedure are first briefly introduced in Section 2, followed by a detailed description of the integration procedure (Section 3). The integration procedure is tested in an area located on the west coast of Lantau Island, Hong Kong. The filtering results of the two filter algorithms and the integration result are visually examined and evaluated in Section 4. Finally the conclusion comes out in Section 5.
2. FILTER ALGORITHMS
In this study, filtering results of two popular algorithms, namely progressive TIN densification (PTD) and hierarchical robust interpolation (HRI), are integrated by the proposed procedure. The two algorithms have been embedded in commercial software respectively. Both Sithole and Vosselman (2003; 2004) and Razak et al. (2011) qualitatively and quantitatively compared the two filter algorithms. In Sithole and Vosselman (2003; 2004), the qualitative comparison indicated that HRI filter performed better in filtering low points and vegetation on slopes than PTD filter, whereas the quantitative comparison indicated that HRI filter produced more Type I errors (rejection of bare-earth points) and less Type II errors (accept object points) than PTD filter. Razak et al. (2011) evaluated several LiDAR-derived DTMs for mapping landslides and for identifying morphological features of landslides in forested area. The DTMs were derived by different filter and interpolation algorithms. The vertical accuracy of the DTM derived by PTD filter was slightly higher than three DTMs derived by different parameterizations of HRI filter. The point density of ground points extracted by different parameterizations of HRI filter was two times or three times higher than that of PTD filter.
2.1 Progressive TIN densification (PTD)
The algorithm is an iterative process where a coarse TIN consisting of initial seed points is gradually densified (Axelsson, 2000). Three main steps are included in the process: (1) estimation of initial thresholds using all LiDAR data, (2) selection of seed points, and (3) iterative densification of TIN until all points are classified as ground or non-ground.
This algorithm was developed by Axelsson (2000) and was implemented in the software Terrasolid. Several parameters should be defined by users, including maximum building size, maximum terrain angle, iteration angle, iteration distance and edge length. The maximum building size is used for selection of seed points. The maximum terrain angle is the steepest allowed slope in the terrain. The iteration angle parameter is the maximum angle between a point, its projection on triangle facet and the closest triangle vertex. The iteration distance parameter is the maximum distance to the TIN facet during each iteration. The edge length parameter is used to avoid adding unnecessary point density to the terrain model. If each edge of triangle is shorter than the specified edge length, the triangle will not be further processed.
2.2 Hierarchy robust interpolation (HRI)
Kraus and Pfeifer (1998) originally introduced an iterative robust interpolation algorithm for extraction of terrain models in wooded areas from airborne LiDAR data based on a linear prediction. The iterative robust interpolation algorithm was extended by Pfeifer et al. (2001) to a hierarchical approach, which was embedded in software SCOP++. The hierarchical approach contains three main steps: (1) create coarser resolution data sets (i.e. thin out), (2) filter the data and generate a DTM, and (3) compare the DTM with finer resolution data and add points within a certain interval. The approach proceeds from coarser resolution to finer resolution. Steps (2) and (3) are repeated for each level. When comparing a DTM with finer resolution data, distances between points in finer resolution data and the DTM are calculated. If the distances are within a specified interval (e.g. -1m ~ 1m), the points are included for the following filtering step.
3. INTEGRATION OF DIFFERENT FILTERING
RESULTS
A simple procedure was developed to integrate filtering results of different algorithms. The proposed procedure is based on an assumption that the vast majority of non-ground LiDAR points have been filtered out by the algorithms and the remaining non-ground points account for only a small percentage of the non-ground points derived by the filter algorithms. In addition, the discrepancies between the filtering results of different algorithms are assumed to be not large.
For a LiDAR data set, each point is labelled as ground or non-ground after filtering. If two filtering results are integrated, let ground points. The integration procedure involves following steps:
1. Generate two regular grid DTMs for G1 and G2; 2. Calculate elevation differences between each ground point in G1 and the generated DTM for G2, and remove those ground points with elevation difference values larger than a specific threshold;
3. Calculate elevation differences between each ground point in G2 and the generated DTM for G1, and remove those ground points with elevation difference values larger than a specific threshold;
4. Combine remaining ground points in G1 and G2 and generate a new regular grid DTM;
5. Calculate elevation differences between each ground point in G1 and G2 and the new generated DTM, and add points with elevation difference values smaller than a specific threshold to the whole ground point set.
Two key points of this integration procedure are calculation of elevation differences and specification of thresholds of elevation differences. The elevation difference between a ground point i and a DTM can be defined as
) involving a specific number of neighboring DTM nodes. In this study a quartic model devised by Zevenbergen and Thorne (1987) is adopted to approximate the ground surface:
k the nine coefficients. If the nodes in a 3×3 window are utilized, the quartic function passes exactly through the nine nodes surrounding the ground point i.
Two types of elevation difference thresholds need to be defined for the integration procedure: the thresholds for removal of non-ground points (steps 2 and 3) and thresholds for acceptance of ground points removed in previous steps (step 5). This study utilizes a simple method to define the thresholds: firstly statistical values (standard deviation and mean value) of elevation differences between one set of ground points and the DTM generated by the other set of ground points are calculated; then the thresholds are defined as
D
m
D (3) where the first term represents the mean value of elevation differences, m is a real number, and σD is the standard deviation of elevation differences. For removal of non-ground points, m is assigned a positive value and the points with positive elevation difference values larger than the threshold are eliminated. Points with negative elevation difference values are not processed since the possibility of points with negative elevation difference values being non-ground points is relatively low. For integrating the ground points removed in previous steps, m is set to a positive value and the points with elevation differences smaller than the threshold are added if they are not in the International Archives of the Photogrammetry, Remote Sensing and Spatial Information Sciences, Volume XL-2/W1, 2013
present ground point set. The specification of multiplier m may vary in different steps.
4. TEST RESULTS AND DISCUSSION
4.1 Test site and LiDAR data
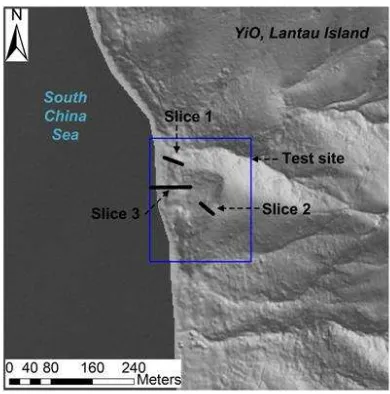
A test site with an area of about 0.04 km2 on the west coast of Lantau Island, Hong Kong was selected to evaluate the filtering results of different filter algorithms and test the proposed procedure (Figure 1). The test site is composed of rugged terrain covered by woods, shrub and grass. The elevation ranges from 1.33 to 88.76 m in Hong Kong Principle Datum. The mean slope gradient is 27º and the maximum slope gradient is 75º.
An airborne LiDAR survey was conducted between December 2010 and January 2011, covering the land area of the whole territory of Hong Kong of about 1,100 km2 (Lai et al., 2012). The LiDAR data were collected at maximum point spacing of 0.5 m. At most 4 returns were recorded for each laser pulse. Using ground survey data obtained by static GPS and total station in 15 sample areas all over the Hong Kong territory, The vertical and horizontal accuracy of the LiDAR data were estimated to be 0.059 m and 0.288 m at 95% confidence level respectively.
4.2 Filtering results of two filter algorithms
Before filtering the point cloud, LiDAR data was first processed to remove low points that are significantly much lower than neighboring points so that the effects of low points on point cloud filtering could be eliminated. For the algorithm of PTD, we set the maximum slope angle to 65º, the iteration angle to 15º, and the iteration distance to 1.0 m. Other parameters were set to their default values. The parameter values were determined according to the characteristics of the terrain and the land cover within the test area. For the algorithm of HRI, a predefined parameterization embedded in SCOP++, called forest filter, was utilized, which was devised for forested areas. These two algorithms were separately applied to the LiDAR data within the test area. The PTD algorithm filtered out 74% of 167465 LiDAR points, whereas the HRI algorithm filtered out 59% of all points.
The filtering results of two algorithms at the test site were visually examined. It is impossible to perform an accurate quantitative evaluation due to the inaccessibility of the steep terrain and dense vegetation in most parts of the area. An aerial photo of 0.5m resolution was available to facilitate the visual examination. According to the aerial photo, the area is covered by vegetation of variable heights, including trees, bushes and grass, and there is no distinct man-made objects. Therefore, the points filtered out by the algorithms were classified as vegetation points, whereas the remaining points were classified as ground points. A number of vertical slices of classified point cloud were extracted on different locations to evaluate the results of filter algorithms according to the point distribution in 3D space and the land cover information provided by the aerial photo. Three vertical slices were finally selected to indicate the filtering results of the two algorithms (Figure 1).
Figure 1. Locations of vertical slices of LiDAR point cloud within the test area
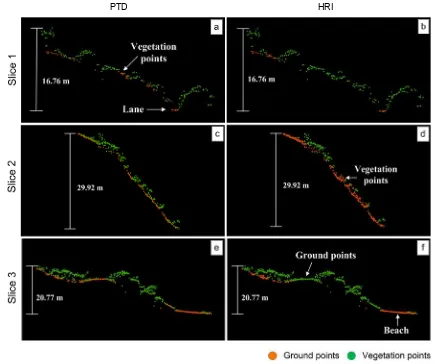
The classified LiDAR points in three vertical slices are displayed in Figure 2. The terrain of slices 1 and 3 is gentler than the terrain of slice 2. According to the distribution of LiDAR points in 3D space and the land cover information provided by aerial photo, the slope at the location of slice 1 is regarded to be covered by trees of about three to five meters high. The filtering and classification result in Figure 2a indicates that the PTD filter did not filter out all LiDAR points striking on tree crowns and a part of vegetation points (shown by arrow) were misclassified as ground points. In contrast, the HRI filter filtered out all vegetation points and a large point gap appears on the slope where no laser pulses arrive at the ground (Figure 2b). Figures 2c and 2d indicate a steep slope covered by bushes and trees of about one to three meters high. The aerial photo also reveals grass land and bare earth over small areas within slice 2. Even though more LiDAR points were classified as ground points by the HRI filter than by the PTD filter, a number of points (shown by arrow) located on low-height vegetation were not filtered out by the HRI filter and were misclassified as ground points. Figure 2e and 2f show an undulating terrain connected to the beach. LiDAR points located on a mound (shown by arrow) were correctly classified as ground points by the PTD filter (Figure 2e) but were filtered out by the HRI filter (Figure 2f).
The results shown in Figure 2 indicate that it is difficult to determine which filter algorithm performed better in such a rugged terrain covered by variable vegetation. On the whole, the HRI filter extracted much more ground points than the PTD filter. However, neither algorithm can filter out all vegetation points and the vegetation points misclassified as ground points may result in fake rugged slope surface. Furthermore, despite a smaller number of ground points extracted by the PTD filter, ground points related to some terrain features (e.g. a mound) that were filtered out by the HRI filter could be extracted by the PTD filter.
Figure 2. Filtering and classification results of two algorithms (PTD and HRI) for three vertical slices of LiDAR point cloud.
4.3 Integration result
The procedure proposed in this study was utilized to integrate the filtering results of two popular filter algorithms, i.e. the PTD and HRI filter. Firstly two grid DTMs were generated based on the ground points extracted by PTD and HRI filter. Kriging was used to create two DTMs of 1m resolution. Secondly, elevation differences between one ground point set and the DTM generated from the other ground point set were calculated. A 3×3 nodes window, centred on the node that is nearest to the ground point, was employed to construct the quartic model (Equation (2)) for each ground point. Mean value and standard deviation of elevation differences were calculated to derive thresholds for removal of non-ground points (Equation (3)). According to the theory of statistics, for a data set following a normal distribution, about 15.87% of the data are larger than the standard deviation and only about 0.14% of the data are larger than three-times standard deviation. This study adopted a threshold of two-times standard deviation so that most vegetation points can be removed and few ground points are removed together with vegetation points. Next, both sets were combined to create a single ground point set and a new DTM was generated. Vertical distances between the original ground point sets and the newly generated DTM were calculated and thresholds were specified to integrate those ground points removed in previous steps. This threshold should be more strict that the threshold for removing vegetation points so as to avoid
accepting vegetation points. Thus a threshold equivalent to the newly calculated standard deviation was used. In the following paragraphs, the DTM generated from the ground points derived by the PTD filter is called PTD-DTM, while the DTM generated from the ground points derived by the HRI filter is called HRI-DTM.
For removal of vegetation points, thresholds of 1.43m and 0.45m were applied to the results of the PTD and HRI filter respectively. For adding ground points removed in previous steps, thresholds of 0.77m and 0.27m were utilized for the PTD and HRI filter respectively. The integration procedure produced a final ground point set containing 67886 points (the number of all LiDAR points is 167465). A total of 1605 points were removed from the ground point set derived by the PTD filter, whereas 2829 points were removed from the ground point set derived by the HRI filter. The integration results of the three vertical slices of LiDAR point cloud (see Figure 2) are shown in Figure 3.
In comparison with original ground point sets in Figure 2a and 2b, the integration result of slice 1 (Figure 3a) is almost the same as the filtering result of the HRI filter. The vegetation points contained in the ground point set derived by the PTD filter were removed by the integration procedure and therefore are not present in the final result. The integration result of slice 2 (Figure 3b) indicates a combination of the ground points of both sets and the removal of vegetation points (shown by arrow
PTD HRI
in Figure 2d) contained in the ground point set derived by the HRI filter. In slice 3 (Figure 3c) a number of ground points located on a mound (shown by arrow in Figure 2f) that were filtered out by the HRI filter are present in the final ground point set, although not all ground points on the mound were integrated. All the results indicate the potential of improving the filtering results of different algorithms by applying the integration procedure. The most of vegetation points that are not filtered out by those filter algorithms can be identified and removed, and ground points appearing in different filtering results can be combined.
Figure 3. Integration results of three vertical slices of LiDAR point cloud.
The limitation of the proposed integration procedure is the definitions of the thresholds for removal of vegetation points and for acceptance of ground points are more or less subjective. The detection of vegetation points is under the assumption that the elevation differences of ground points follow a normal distribution and the elevation difference values of vegetation points significantly deviate from the mean. However, it is difficult to determine a elevation difference threshold that can clearly differentiate ground points from vegetation points in such a rugged terrain covered by vegetation of variable heights. For instance in Figure 3c, a number of points on a mound contained in the ground point set derived by the PTD filter are not present in the final integration result due to their large vertical distances to the HRI-DTM, whereas vegetation points (shown by arrow) on a gentle slope close to the beach were integrated into the final result owing to small elevation differences. In addition, the thresholds were defined based on the mean and the standard deviation, but the standard deviation of elevation differences are easily biased by vegetation points
with large elevation differences. An alternative way is incorporation of the point distribution in 3D space and/or spectral information from high-resolution aerial photo or satellite imagery into the integration procedure.
5. CONCLUSION
This study proposed a simple procedure to integrate results of different filter algorithms applied to airborne Light Detection And Ranging (LiDAR) data. A statistical approach was adopted to identify and remove non-ground points contained in each ground point set and combine ground points using thresholds defined based on the statistics (mean and standard deviation) obtained from the distributions of elevation differences between ground point sets and DTMs. The procedure was tested in an area with rugged terrain covered by dense vegetation of variable heights. Filtering results of two popular filter algorithms, namely progressive TIN (Triangulated Irregular Network) densification (PTD) and hierarchical robust interpolation (HRI), were integrated. The filtering results of the two algorithms and the integration result were visually examined according to the LiDAR point distribution in three-dimensional space and land cover information provided by a high-resolution aerial photo. The HRI filter extracted much more ground points (41% of all LiDAR points) than the PTD filter (26% of all LiDAR points), although ground points related to some terrain features (e.g. a mound) were extracted by the PTD filter but were filtered out by the HRI filter. Both ground point sets contained vegetation points unfiltered out by the filter algorithms. The proposed integration procedure can remove most vegetation points contained in both ground point sets, and combine ground points from each filtering result.
Even though the proposed integration procedure has the capability of improving the filtering results of different algorithms, not all vegetation points contained in each ground point set can be identified and removed and some actual ground points on rugged terrain may be removed. This is due to the limitation of the integration method that relies only on elevation information and utilizes thresholds defined based on a normal distribution assumption and biased statistics (affected by non-ground points). Further studies will investigate the feasibility of more complicated statistical approaches and the incorporation of land cover information provided by aerial photo/satellite imagery into the integration procedure. Anyway this study provided a strategy for inspection of the quality of airborne LiDAR point cloud filtering result in that large elevation differences between two filtering results commonly represent filtering errors.
ACKNOWLEDGEMENT
Acknowledgement is made to the Head of the Geotechnical Engineering Office and the Director of the Civil Engineering and Development, the Government of the Hong Kong Special Administrative Region, for the permission to use the LiDAR data.
REFERENCES
Axelsson, P., 2000. DEM generation from laser scanner data using adaptive TIN models. International Archive of International Archives of the Photogrammetry, Remote Sensing and Spatial Information Sciences, Volume XL-2/W1, 2013
Photogrammetry and Remote Sensing, XXXIII(B4), Amsterdam, pp. 110-117.
James, L.A., Watson, D.G., Hansen, W.F., 2007. Using LiDAR data to map gullies and headwater streams under forest canopy: South Carolina, USA. Catena, 71, pp. 132-144.
Kraus, K. and Pfeifer, N., 1998. Determination of terrain models in wooded areas with airborne laser scanner data. ISPRS Journal of Photogrammetry and Remote Sensing, 53, pp. 193-203.
Lai, A.C.S., So, A.C.T., Ng, S.K.C., Jonas, D., 2012. The territory-wide airborne light detection and ranging survey for the Hong Kong Special Administrative Region. The 33RD Asian Conference on Remote Sensing, Pattaya, Thailand. Lu, W.-L., Murphy, K.P., Little, J.J., Sheffer, A., and Fu, H., 2009. A Hybrid Conditional Random Field for Estimating the Underlying Ground Surface from Airborne LiDAR Data. IEEE Transactions on Geoscience and Remote Sensing, 47(8), pp. 2913-2922.
Meng, X.L., Currit, N., Zhao, K.G., 2010. Ground Filtering Algorithms for Airborne LiDAR Data: A Review of Critical Issues. Remote Sensing, 2(3), pp. 833-860.
Mongus, D. and Žalik, B., 2012. Parameter-free ground filtering of LiDAR data for automatic DTM generation. ISPRS Journal of Photogrammetry and Remote Sensing, 67, pp. 1–12.
Pfeifer, N., Stadler, P., Briese, C., 2001. Derivation of digital terrain models in the SCOP++ environment. OEEPE Workshop on Airborne Laser scanning and Interferometric SAR for Detailed Digital Elevation Models, Stockholm, Sweden. Razak, K.A., Straatsma, M.W., van Westen, C.J., Malet, J.P. and de Jong, S.M.. 2011. Airborne laser scanning of forested landslides characterization: Terrain model quality and visualization. Geomorphology, 126, pp. 186-200.
Sithole, G. and Vosselman, G., 2003. Report: ISPRS comparison of filters. Available online at: http://www.itc.nl/isprswgiii-3/filtertest/Report05082003.pdf (accessed 15 April 2013). Sithole, G. and Vosselman, G., 2004. Experimental comparison of filter algorithms for bare-Earth extraction from airborne laser scanning point clouds. ISPRS Journal of Photogrammetry and Remote Sensing, 59, pp. 85-101.
Slatton, K.C., Carter, W.E., Shrestha, R.L., and Dietrich, W. 2007. Airborne Laser Swath Mapping: Achieving the resolution and accuracy required for geosurficial research. Geophysical Research Letters, 34, L23S10.
Zevenbergen, L.W., Thorne, C, 1987. Quantitative analysis of land surface topography. Earth Surf Proc Land, 12, pp. 47–56.