ESTIMATING WOOD VOLUME FOR
PINUS BRUTIA
TREES IN FOREST STANDS
FROM QUICKBIRD-2 IMAGERY
Petros Patias a *, Panagiota Stournara a
a AUTH, Department of Cadastre, Photogrammetry and Cartography, Laboratory of Photogrammetry and Remote Sensing, Greece - (patias, pstour)@topo.auth.gr
Commission VIΙ, WG VIΙ/4
KEY WORDS: Quickbird-2, Marker-controlled watershed segmentation, Object-based classification, Tree wood volume, Individual tree crown delineation
ABSTRACT:
Knowledge of forest parameters, such as wood volume, is required for a sustainable forest management. Collecting such information in the field is laborious and even not feasible in inaccessible areas. In this study, tree wood volume is estimated utilizing remote sensing techniques, which can facilitate the extraction of relevant information. The study area is the University Forest of Taxiarchis, which is located in central Chalkidiki, Northern Greece and covers an area of 58km2. The tree species under study is the conifer evergreen species P. brutia (Calabrian pine). Three plot surfaces of 10m radius were used. VHR Quickbird-2 images are used in combination with an allometric relationship connecting the Tree Crown with the Diameter at breast height (Dbh), and a volume table developed for Greece. The overall methodology is based on individual tree crown delineation, based on (a) the marker-controlled watershed segmentation approach and (b) the GEographic Object-Based Image Analysis approach. The aim of the first approach is to extract separate segments each of them including a single tree and eventual lower vegetation, shadows, etc. The aim of the second approach is to detect and remove the “noisy” background. In the application of the first approach, the Blue, Green, Red, Infrared and PCA-1 bands are tested separately. In the application of the second approach, NDVI and image brightness thresholds are utilized. The achieved results are evaluated against field plot data. Their observed difference are between -5% to +10%.
* Corresponding author
1. INTRODUCTION
Wood volume is one of the most important forest parameters and its monitoring is one of the main tasks of regional forest management plans aiming among others to the preservation of the environment, recreation, strengthening the local economy etc. Field work is very laboursome and it can become infeasible for it to be conducted in inaccessible areas. The satellite imagery by having the advantage of covering large areas with relatively low cost offers the possibility to expand forest studies and forest parameter extraction in larger areas facilitating in this way forest management.
There have been several studies so far estimating wood volume with the use of remote sensing data. Their data type, tree species, study area and accuracies vary, so no direct comparison can be made.
SPOT-4 XS with 20 m resolution and SAR data with 3 m resolution were used in (Holmström and Fransson 2003) for conifers and broadleaves in Sweden. On plot level, the relative Root-Mean-Square Error (RMSE) was 64% for optical data and 53% combining optical with radar data. On stand level, the error using all available data, reached 30% (optical data) and 22% (optical and radar data). An error of 58 to 84% (relative RMSE) was observed on plot level in the study (Tuominen and Pekkarinen 2005) which was conducted in Finland utilizing airphotos of 0.5 m on tree species of pine, fir and birch. A combination of Landsat TM (30 m), IRS-IC (5 m) and airphotos (1-2 m) was utilized in Finland (Poso et al. 1999). The relative RMSE was 58%. Quickbird imagery (0.6 m and 2.4 m spatial
resolution) and ASTER data (15 m and 30 m spatial resolution) were utilized in north Siberia for pines and birch. The smallest relative RMSE was approximately 40% (Fuchs et al. 2009). LIDAR, CIR (Colour InfraRed) airphotos (0.4 m spatial resolution) and TM satellite imagery were utilized to estimate the wood volume of pines, beeches and oaks in southwest Germany (Latifi et al. 2010). The RMSE on plot level was 23% to 60%. ICESat/GLAS and MODIS data were also utilized to estimate wood volume for various species such as pines, birch, firs and others in central Siberia (Nelson et al. 2009). The error mentioned was 12% and 18% (calculated against field data for subregions). Better accuracies were achieved in studies using LIDAR data, around 30% to 40%. In (Watt and Watt 2013) wood volume was estimated with LIDAR data for pines in New Zealand. The RMSE error was 80.2 m3/ha which if compared with the average wood volume on stand level corresponds to 31%. In (Kankare et al. 2013) the wood volume was estimated on plot level for coniferous trees in Finland. The RMSE was between 26% to 34% approximately.
In this study, wood volume is estimated for calabrian pines in Greece based on per-tree delineation. VHR Quickbird-2 imagery of 0.6 m spatial resolution is utilized in combination with allometric data. The achieved results are evaluated against field plot data.
2. STUDY AREA
The study area is the University Forest of Taxiarchis, which is located in mount Cholomontas in central Chalkidiki, Northern Greece (40°23’‐40°28’ N, 23°28’‐23°34’ E). It covers an area The International Archives of the Photogrammetry, Remote Sensing and Spatial Information Sciences, Volume XLI-B7, 2016
of 58km2. The vegetation of the area includes various pines, more specifically calabrian (Pinus brutia), black (Pinus nigra) and maritime (Pinus maritima) pines, oak (Quercus confertae), beech (Fagus moesiaca) and broadleaf evergreen shrubs. The tree species under study is the conifer evergreen species P. brutia (calabrian pine). The location of the study area is shown in Figure 1.
(a)
(b)
(c)
Figure 1. The location of the study area, (a) in the geographical area of Greece, (b) a zoom of the study area in the map shown in 1(a), (c) the boundaries of the University Forest of Taxiarchis on Google Earth © Google Earth, copyright 2016.
3. DATA
3.1 Satellite imagery
A pansharpened Quickbird-2 image of 0.6 m spatial resolution was utilized. It was acquired on 10/7/2004 with a very small off-nadir view angle of 4.1° in UTM projection, zone 36, ellipsoid and geodetic datum WGS84. It was supplied by the
Forest Service of Polygyros. The imagery initially consisted of 4 different image pieces with visually obvious radiometric differences, which were mosaicked to form a single image. In order to reduce tonal differences the method of histogram matching embedded in Erdas Imagine 9.2 was used during the mosaicking. In this method a lookup table is applied as a function which converts the histogram of one image to resemble the histogram of the other (Leica Geosystems Geospatial Imaging, 2008). The Rational Polynomial Coefficients (RPC) of the image, relating image space coordinates (line and column) to object coordinates (Krishna et al.2008) were also available. A DEM (Digital Elevation Model) derived from a Cartosat-1 stereopair. Its vertical accuracy was evaluated to be 1.3 m using 20 check points (Stournara & Patias, 2013), measured using the Global Positioning System (GPS) and the RTK method (Fotiou et al., 2009).
3.2 Forest data
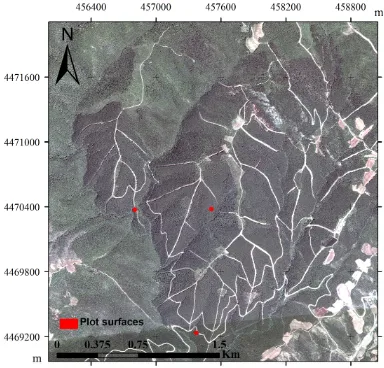
The field data was derived from the Forest Service of the University Forest of Taxiarchis. Field data was collected on plot level. Cyclical plots of 10 m diameter (0.031 ha) were utilized in the field. Three plot surfaces pure with calabrian pine were utilized in this study (Figure 2). The boundaries of the plot surfaces were supplied by the Forest Service in vector format and georeferenced in the Hellenic Geodetic Reference System 1987 (EGSA87).
For these plot surfaces the wood volume of the trees were measured. Wood volumes were measured in the field during 2012-2013. Because there is significant time distance between satellite imagery acquisition and time of field data collection, annual increments of wood volume were also utilized in this study. They were derived from the official forest management plan of the area (Table 1).
Figure 2. The location of the plot surfaces on the satellite imagery (RGB=3/2/1 bands).
Plot number (stand number)
Wood volume (m3)
Wood volume annual increment (m3/ha/year)
3 (6) 195.53 6.30
36 (5) 260.04 7.16
22 (13) 254.37 7.85
Table 1. Wood volume data from the forest management plan of the area.
The allometric equation which was used for the estimation of Dbh in this study was developed for Aleppo pine in northern Evoia, central Greece in very similar environmental conditions as northern Greece (Mitsopoulos, 2005). Aleppo pine and calabrian pine are very similar tree species. The allometric equation combines the tree crown diameter with the Dbh of the tree:
The allometric equation was developed with random sampling in 10 different Aleppo pine stands in 2003 and 2004. The total number of the trees sampled was 40. The crown diameter was measured in the field as the average of the minor and major tree crown diameter.
The volume table which was used in this study was developed for the Calabrian pine of the Taxiarchis Forest by the Forest Service of the area. This volume table is of single input, i.e. the tree Dbh is the input variable and the wood volume of the tree is the output variable. The initial volume table included values for trees with Dbh up to 30 cm. The wood volume values for trees with Dbh larger than 30 cm were calculated in this study utilizing the equation of the same volume table, in order to be able to use them for trees extracted from the automatic methodology having Dbh larger than 30 cm.
4. METHODOLOGY
4.1 Preprocessing
During preprocessing the image was orthorectified with 16 control points and 7 check points and transformed from the UTM projection to the EGSA87 coordinate system. The control and check points were distributed covering the whole extent of the image. The horizontal coordinates of the control and check points were acquired from the Orthophotos Viewing Service of the webpage of the Greek National Cadastre (Greek National Cadastre and Mapping Agency S.A., 2015). The Cartosat-1 derived DEM was used for the height information. The control point error was 0.35 m and the check point error was 0.25 m. The PCA (Principal Component Analysis) transformation was applied on the pansharpened image. The PCA transformation is utilized for imagery enhancement∙ it compresses data information into fewer bands, reducing in this way the complexity of the multi-dimensionality of images. The PCA bands are usually more interpretable than the initial image discriminate lower vegetation or other land cover types from the trees. Lower vegetation must be classified as a separate class, because otherwise the tree crowns will be delineated larger than they really are. In object-based classification features used in the rulesets of classification are calculated based on objects and not on pixels as in the pixel-based classification. Objects are created by merging initially pixels into objects and then existing objects into larger ones. In this study the multiresolution segmentation and the object-based classification approach
embedded in the commercial software eCognition Developer 8.7 was utilized. This kind of segmentation aims to minimize heterogeneity and maximize homogeneity of the image objects. The scale, shape and compactness parameters affect the homogeneity of the objects and are user-determined. Higher value of the scale parameter results in larger objects.
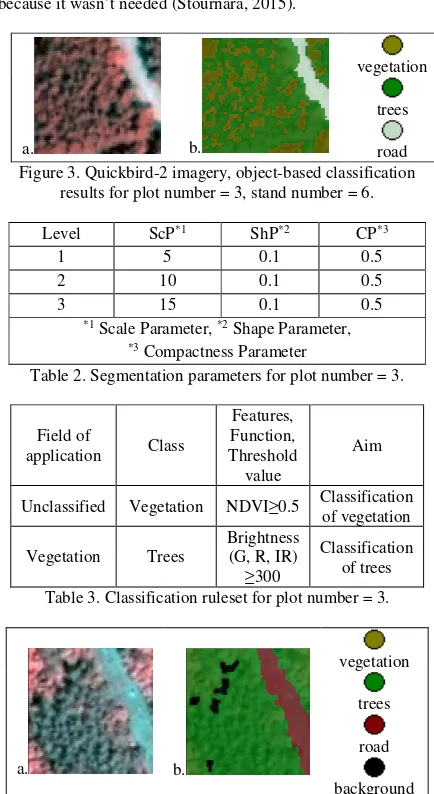
User-determined parameters for segmentation and classification rulesets applied for the two plots (plot number 3 and stand number 6, plot number 22 and stand number13) are displayed in Tables 2-5 and Figures 3-4. For the third one (plot number 36 and stand number 5) no classification scheme was applied, because it wasn’t needed (Stournara, 2015).
a. b.
vegetation
trees
road Figure 3. Quickbird-2 imagery, object-based classification
results for plot number = 3, stand number = 6.
Table 2. Segmentation parameters for plot number = 3.
Field of
Unclassified Vegetation NDVI≥0.5 Classification of vegetation
Table 3. Classification ruleset for plot number = 3.
a. b.
vegetation
trees
road
background Figure 4. Quickbird-2 imagery, object-based classification results and classification classes for plot number = 22, stand
number = 13.
Table 4. Segmentation parameters for plot number = 22. The International Archives of the Photogrammetry, Remote Sensing and Spatial Information Sciences, Volume XLI-B7, 2016
Field of
Vegetation Trees - Classification of trees Table 5. Classification ruleset for plot number = 22.
4.3 Tree area segmentation
The image was segmented into separate segments using the marker-watershed approach (Burger and Burge 2008). Each separate segment contains a single tree and lower vegetation, except for the regions without trees such as the road in Figure 4.
The watershed segmentation approach is based on visualizing an image in three dimensions as a topographic surface∙ two spatial coordinates, the value of the pixel being the third dimension. It is applied to extract nearly uniform objects from the image. The watershed segmentation uses the watershed line (a ridge of land that separates two adjacent catchment basins) to separate adjacent catchment basins (Gonzalez and Woods, 2002). Here, adjacent catchment basins correspond to tree crowns. Trees are higher than the surrounding area or pixels of trees have higher values than the pixels of the surrounding area. If this surface is reversed, maximum becomes minimum and tree crowns form basins. Adjacent tree crowns share a common boundary, similarly to a watershed line (Stournara, 2015).
Local maxima of separate bands were identified and used as markers in the marker-controlled watershed segmentation of the image. The marker-controlled watershed segmentation uses initial pixels as markers to reduce the oversegmentation of the image (Gonzalez and Woods, 2002).
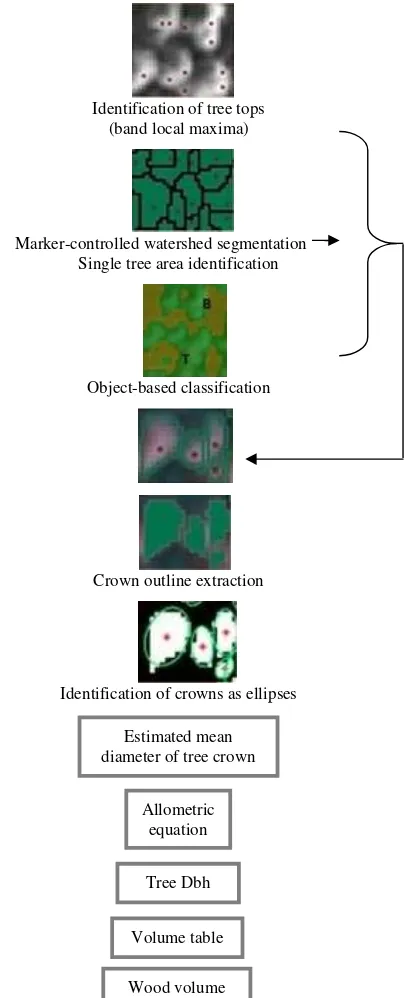
In this study, local maxima correspond to tree tops because, especially in the case of conifers, due to tree structure, tree tops receive more light, so local maxima correspond to tree tops or pixels which are located very close to tree tops (Brandtberg and Walter, 1998; Ke et al., 2010). This procedure was applied separately for the blue, green, red, infrared and the PCA-1 bands. The overall process is shown in Figure 5.
4.4 Wood volume estimation
Wood volume estimation was based on the results of the methodology described in the paragraphs 4.2 and 4.3. The allometric equation and the volume table described in paragraph 3.2 were utilized to estimate the wood volume. The mean tree estimate the mean diameter of the tree crown in a similar way as it is done in the field measurements, the minor and major axis of the tree crown were estimated (Figure 5). The outlined per-tree crowns were further processed as objects in Matlab 10 software environment in order to estimate the two axes of the tree crown, which were used afterwards to calculate the mean crown diameter.
Identification of tree tops (band local maxima)
Marker-controlled watershed segmentation Single tree area identification
Figure 5. Overall workflow of methodology applied (Stournara, 2015).
5. RESULTS AND DISCUSSION
The satellite image was acquired in 2004, while the field data for wood volume was collected during the period 2012-2013. For this reason wood volume was estimated twice, once without taking into account the annual increment of wood volume and the second time considering also the annual increment. The estimation of the total increment was based on the most recent year, i.e. 2013. The annual increment value for every plot surface was obtained from the official forest management plan of the area.
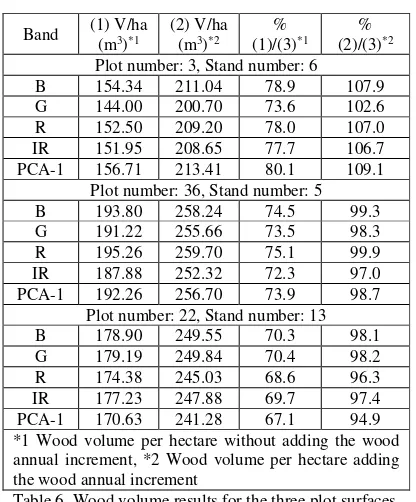
It can be observed (Table 6) that the estimation of wood volume is generally close to the field measurements∙ when annual increments are added percentage results are approaching 100%.
From the results shown in Table 6, it can be deduced for every plot that the estimated values don’t show much differentiations between them. For plot 3 all percentage results are up to +10% over 100%, for plot 36 they are all up to 3% below 100%, while for plot 22 they range around 95% to 98%.
Band (1) V/ha Plot number: 3, Stand number: 6
B 154.34 211.04 78.9 107.9
G 144.00 200.70 73.6 102.6
R 152.50 209.20 78.0 107.0
IR 151.95 208.65 77.7 106.7 PCA-1 156.71 213.41 80.1 109.1
Plot number: 36, Stand number: 5
B 193.80 258.24 74.5 99.3
G 191.22 255.66 73.5 98.3
R 195.26 259.70 75.1 99.9
IR 187.88 252.32 72.3 97.0
PCA-1 192.26 256.70 73.9 98.7 Plot number: 22, Stand number: 13
B 178.90 249.55 70.3 98.1
Table 6. Wood volume results for the three plot surfaces.
Differences between the bands are small and are usually due to counting or not a tree in the plot surface. Minor shifts of the centroids of the tree crown polygons that are located near the plot boundary cause differentiations in the estimated values of the wood volume. These shifts are caused by addition or subtraction of a few pixels from the polygons, which result in slight variations of the centroid positions.
The differences among the results of the various bands are up to 3% in the plots 22 and 36 and up to around 5% in the plot 3. Generally, it can be deduced that the results from the green band are slightly better. The rest of the bands showed stability in the estimation of the wood volume, with the red and the blue band being slightly better than the rest.
6. CONCLUSIONS
This study showed that the methodological scheme applied produced results which approach the field measurements. This is quite promising for applying this methodological scheme to other regions and tree spieces. Differences among various bands should be better examined individually on each study case. Comparing these results with the results of other studies mentioned in paragraph 1, they are generally well within their result limits.
ACKNOWLEDGEMENTS
The authors are grateful to the University Forest Administration and Management Fund for providing forest field data and to the Forest Service of Polygyros for providing the imagery data.
REFERENCES
Brandtberg, T. and Walter, F., 1998. Automated delineation of individual tree crowns in high spatial resolution aerial images by multiple-scale analysis, Machine Vision and Applications, 11(2), pp. 64-73.
Burger, W. and Burge, M., 2008. Digital Image Processing: An Algorithmic Introduction Using Java. New York: Springer Sciences.
Faust, N.L., 1989. Image Enhancement. Volume 20, Supplement 5 of Encyclopedia of Computer Science and Technology, New York: Marcel Dekker, Inc.
Fuchs, H., Magdon, P., Kleinn, C. and Flessa, H. 2009. Estimating aboveground carbon in a catchment of the Siberian forest tundra: Combining satellite imagery and field inventory.
Remote Sensing of Environment, 113, pp. 518-531.
Gonzalez, R.C. and Woods, R.E., 2002. Digital Image Processing. New Jersey: Prentice Hall.
Jensen, J.R., 1996. Introductory Digital Image Processing: A Remote Sensing Perspective. 2d ed. Englewood Cliffs, New Jersey: Prentice-Hall.
Leica Geosystems Geospatial Imaging, LLC, 2008. Erdas Imagine 9.2 On-Line Help Documentation.
Ke, Y., Zhang, W. and Quackenbush, L.J., 2010. Active contour and hill climbing for tree crown detection and delineation.
Photogrammetric Engineering & Remote Sensing, 76(10), pp. 1169-1181.
Krishna, B.G., Amitabh, T.P., Srinivasan, P. and Srivastava, K., 2008. DEM Generation from High Resolution MultiView Data Product. In: The International Archives of the Photogrammetry, Remote Sensing and Spatial Information Sciences, Beijing, China, Vol. XXXVII, Part B1, pp. 1099-1102.
Latifi, H., Nothdurft, A. and Koch., B., 2010. Non-parametric prediction and mapping of standing timber volume and biomass in a temperate forest: application of multiple optical/LiDAR-derived predictors. Forestry, 83, pp. 395-407.
Mitsopoulos, D. I., 2005. Crown fire analysis and management in Aleppo pine (Pinus halepensis Mill.) forests of Greece. Ph.D. Dissertation. School of Forestry and Natural Environment, Aristotle University of Thessaloniki. Thessaloniki. Greece. 193 p. [In Greek].
National Cadastre and Mapping Agency S.A., 2015. http://gis.ktimanet.gr/wms/ktbasemap/default.aspx.
Nelson, R., Ranson, K.J., Sun, G., Kimes, D.S., Kharuk, V. and Montesano, P. 2009. Estimating Siberian timber volume using MODIS and ICESat/GLAS. Remote Sensing of Environment, 113, pp. 691-701.
Poso, S., Wang, G. and Tuominen, S. 1999. Weighting Alternative Estimates when Using Multi-Source Auxiliary Data for Forest Inventory, Weighting alternative estimates when using multisource auxiliary data for forest inventory. Silva Fennica, 33, pp. 41–50.
Stournara, P., 2015. Development of automated remote sensing methods for estimating wood volume of forest ecosystems. Ph.D. Dissertation School of Rural and Surveying Engineering. Aristotle University of Thessaloniki, Thessaloniki, Greece. 193 p. [In Greek].
Stournara, P. and Patias, P., 2013. Evaluation of Cartosat-1 Digital Surface Model for Cholomontas region, Chalkidiki. In:
On measurements of lands and constructions, Ziti Publications, ISBN 978-960-89704-2-7, pp. 165-176. [in Greek]
Tsakiri-Strati, M., 2010. Remote Sensing. Thessaloniki: Publications Office AUTH.
Tuominen, S. and Pekkarinen, A., 2005. Performance of different spectral and textural aerial photograph features in multi-source forest inventory. Remote Sensing of Environment, 94, pp. 256-268.
Watt, P. and Watt, M.S., 2013. Development of a national model of Pinus radiata stand volume from lidar metrics for New Zealand. International Journal of Remote Sensing, 34, pp. 5892-5904.