UTILIZING SAR AND MULTISPECTRAL INTEGRATED DATA
FOR EMERGENCY RESPONSE
S. Havivi a*, I. Schvartzman b, S. Maman a, A. Marinoni c, P. Gamba c, S.R. Rotman b, D. G. Blumberg a a
Ben-Gurion University of the Negev, The Department of Geography and Environmental Development, 8410501 Beer Sheva, Israel- [email protected]
b
Ben-Gurion University of the Negev, The Electrical Engineering Department, 8410501 Beer Sheva, Israel c
University of Pavia, The Department of Electronics, Via A. Ferrata 1, 27100 Pavia, Italy
Commission VII, WG VII/5
KEY WORDS: Change detection, Coherence, Covariance Equalization, Natural hazards, Multi-dimensional data fusion.
ABSTRACT:
Satellite images areused widely in the risk cycle to understand the exposure, refine hazard maps and quickly provide an assessment after a natural or man-made disaster. Though there are different types of satellite images (e.g. optical, radar) these have not been combined for risk assessments. The characteristics of different remote sensing data type may be extremely valuable for monitoring and evaluating the impacts of disaster events, to extract additional information thus making it available for emergency situations. To base this approach, two different change detection methods, for two different sensor's data were used: Coherence Change Detection (CCD) for SAR data and Covariance Equalization (CE) for multispectral imagery. The CCD provides an identification of the stability of an area, and shows where changes have occurred. CCD shows subtle changes with an accuracy of several millimetres to centimetres. The CE method overcomes the atmospheric effects differences between two multispectral images, taken at different times. Therefore, areas that had undergone a major change can be detected. To achieve our goals, we focused on the urban areas affected by the tsunami event in Sendai, Japan that occurred on March 11, 2011 which affected the surrounding area, coastline and inland. High resolution TerraSAR-X (TSX) and Landsat 7 images, covering the research area, were acquired for the period before and after the event. All pre-processed and processed according to each sensor. Both results, of the optical and SAR algorithms, were combined by resampling the spatial resolution of the Multispectral data to the SAR resolution. This was applied by spatial linear interpolation. A score representing the damage level in both products was assigned. The results of both algorithms, high level of damage is shown in the areas closer to the sea and shoreline. Our approach, combining SAR and multispectral images, leads to more reliable information and provides a complete scene for the emergency response following an event.
1. INTRODUCTION
A natural or man-made disaster often causes severe damage, in urban areas the devastating consequences are often greater
(Oštir et al., 2003). In the event of a natural disaster, remote sensing is a valuable source of spatial information (Joyce et al., 2009). Satellite images (both optic and radar) are used widely to understand the exposure, refine hazard maps and quickly provide an assessment of the disaster.
Synthetic Aperture Radar (SAR) is an active microwave sensor, operating under all weather conditions, provides information on changes in surface roughness (Ferretti et al., 2007), structural changes in built-up areas and canopy volume in vegetated areas. Multispectral sensors provide high capabilities for the identification and separation of different materials, in the water or even on land.
Hazard studies mostly use one kind of satellite data, different types of satellite images have seldom been combined for risk assessments. The use of different remote sensing data may be extremely valuable for monitoring and evaluating the impacts of disaster events, to extract valuable information, available for emergency situations. It is therefore of paramount importance to define a framework enabling us to combine or fuse the
information available in an emergency situation, exploiting the data sets recorded from multiple spaceborne sensors, and focusing on disasters.
This work aims to demonstrate the advantages obtained by combining optical and radar data. Thus, two different change detection methods are used: Coherence Change Detection (CCD) for SAR data and Covariance Equalization (CE) for multispectral data.
2. RESEARCH AREA
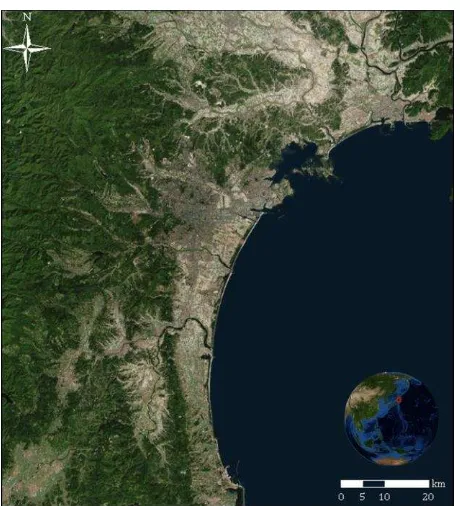
On March 11th, 2011, an earthquake with magnitude of 8.9 occurred in the east coast of Japan. It triggered a destructive tsunami within several minutes. The tsunami caused an extensive damage (Li et al., 2011). More than 15,800 people were killed, 3,800 missing, and 5,900 were injured. More than 978,000 houses were damaged and destroyed (Udo et al., 2012). This study is focusing on the urban areas at the north-eastern Japan, along the coastline (Figure 1).
The International Archives of the Photogrammetry, Remote Sensing and Spatial Information Sciences, Volume XLI-B7, 2016 XXIII ISPRS Congress, 12–19 July 2016, Prague, Czech Republic
This contribution has been peer-reviewed.
Figure 1. Japan north-eastern coastline.
3. MATERIALS AND METHODS 3.1 Data acquisitions and pre-processing
High resolution TerraSAR-X (TSX) and Landsat 7 images, covering the research area, were acquired for the period before and after the tsunami event (Table 1). TerraSAR-X imagery with 2m/pixel spatial resolution and Landsat7 imagery with 30m/pixel. Each image was pre-processed according to the specific properties of each sensor. The quality of Landsat7 imagery is disturbed by corrupted scan lines, due to the failure in the corrector on the satellite. In the CE method calculation this problem was disregard. A precise co-registration was conducted on the TerraSAR imageries, with a RMS error of fit 0.1 pixel. Table 1. Images that were used in the research.
3.2 Coherence Change Detection (CCD)
Classical SAR interferometry requires high coherence between the images (Ferretti et al., 2007). The coherence change detection is based on both amplitude and phase. It provides an identification of the stability of an area, and shows where changes have occurred. Coherence shows subtle changes with an accuracy of several millimetres to centimetres (Ferretti et al., 2007). It quantifies the resemblance of a subset of the image between two points in time. It is given equation 1:
(1)
Where:
- fk and gk are the radar complex reflection measurements. - The absolute coherence value γ is a measure of the
similarity between the two observations, 0 ≤ γ≤ 1. - Low values present changes in the area, and high values
indicate no changes.
3.3 Covariance Equalization (CE)
Change detection for multispectral data the covariance equalization method was applied. This method was first proposed by Schaum & Stocker (2003). The algorithm transforms the multispectral cubes, such that both cubes have unit covariance matrix and zero mean, thus reducing global effects on both images. CE is calculated according to equation 2 and 3: different illumination and weather conditions.
- Areas that had undergone change correspond to higher values and vice versa.
3.4 Integration of SAR and Multispectral data
The obtained products, of both the coherence change detection and the covariance equalization, have been integrated within the same geographical coordinate system. In order to combine both products, multispectral data (30m) was spatially linearly interpolated to match the SAR resolution (2m). Then, the damage level was estimated by weighting the obtained results for each pixel. As high coherence values imply no change, and high CE values imply change, a subtraction had to be done. While CCD values range from 0 to 1, CE values range from 0 to infinity, therefore CE values were linearly normalized to 0 to 1. Multiplying the coherence values by the weight of -0.33 and CE by the weight of 0.66 obtained best results.
4. RESULTS AND DISCUSION
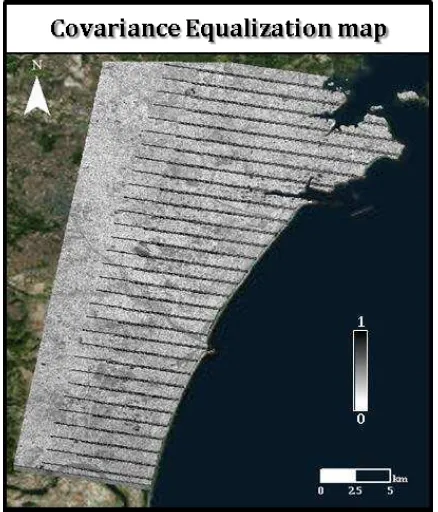
The results of the two change detection methods: coherence and CE are shown in Figure 2 and Figure 3, respectively. The coherence results (Figure 2) show high level of damage along the coastline, in the centre and southern parts of the image. The northern part appears more stable. Inland urban areas are characterized by a high level of stability (white shades). In contrast, the farmlands are characterized by low stability, both along the coastline and the inland. The CE results (Figure 3) show similar results to the coherence. Highest level of damage was observed along the coastline. Inland urban areas were observed as stable. In contrast to the coherence results, very small changes were observed in the farmlands around the urban areas.
The International Archives of the Photogrammetry, Remote Sensing and Spatial Information Sciences, Volume XLI-B7, 2016 XXIII ISPRS Congress, 12–19 July 2016, Prague, Czech Republic
This contribution has been peer-reviewed.
Figure 2. Coherence change detection map. High values (close to 1, white in the scale) represents no change=stability. Observed mostly in urban areas. Low Values (close to 0, black)
represent severe damage, appears mostly along the coastline.
Figure 3. Covariance equalization map. Low values (close to 0, white in the scale) represent no change=stablility. High values
(close to 1, black) represent severe damage.
Figure 4, shows a damage assessment map produced by the integration of the two change detection methods, coherence results for SAR data and CE results for Multispectral images. No changes, meaning stability, are indicated by the value 0 (white) and significant changes are indicated by the value 1 (black). The grey shades represent areas that were detected as unstable by the coherence and stable by the CE or vice versa. The crop areas are a good example for such areas.
Figure 4. Damage assessment map produced by integration of coherence and CE methods. White color (value 0) represents no change=stability. Stability is mostly apparent in urban areas and
made-man structures, like roads. Black color (value 1) represents severe damage, seen mostly along the coastline. The difference of the methods response to changes is shown in Figure 5. Crop areas were found unstable by the coherence. Yet, the same area was found unchanged (stable) by the CE. These differences are attributed to the sensor's properties and to the change detection methods used. The SAR coherence uses both the amplitude and the phase data, thus even the smallest changes can be detected. Vegetation is characterized by low coherence because of its dynamic behaviour due to wind-induced motion of vegetation, different in crop growth during the seasons, etc. The CE, calculated for Multispectral data, is less sensitive to subtle changes in the vegetation state, (as the coherence). Moreover, the spatial resolution difference is also a very influential factor.
Figure 5. Comparison of crop areas: A) optical image; B) coherence map; C) CE map; D) damage assessment map. The
urban area around the crops indicate high stability. The International Archives of the Photogrammetry, Remote Sensing and Spatial Information Sciences, Volume XLI-B7, 2016
XXIII ISPRS Congress, 12–19 July 2016, Prague, Czech Republic
This contribution has been peer-reviewed.
5. CONCLUSIONS
This study exploits the advantages in combining different remote sensing data, optic and radar, for risk assessments. In order to base this approach, an integration of change detection methods for TerraSAR-X and Landsat 7 datasets was applied. Despite the disadvantages of each sensor, separately, the integration of both data to a single product improves the accuracy of the results. The results show that combining SAR and multispectral images, leads to more reliable information and provides a complete scene for the emergency response following an event.
ACKNOWLEDGEMENTS
The authors wish to thank the Ministry of Science, Technology and Space of Israel, Italian Space Agency (ASI) and BGU for their partial support of this study. In addition, the authors thank German Aerospace Centre (DLR) for TerraSAR-X data providing free of charge in the framework of proposal ID: GEO0053.
REFERENCES
Ferretti, A., Monti-Guarnieri, A., Prati, C., Rocca, F., & Massonet, D. (2007). InSAR Principles-Guidelines for SAR Interferometry Processing and Interpretation. Netherlands: ESA Publications.
Joyce, K.E., Belliss, S.E., Samsonov, S.V., McNeill, S.J., & Glassey, P.J. (2009). A review of the status of satellite remote sensing and image processing techniques for mapping natural hazards and disasters. Progress in Physical Geography, Vol. 33, pp. 83-207.
Li, R., Liu, S., Guan, Q., & Peng, Y. (2011). Post-disaster assessment of northeastern coastal region for the 2011 Sendai Earthquake and tsunami. , Vol. 3, pp. 2429-2432.
Oštir, K., Veljanovski, T., Podobnikar, T., & Stančič, Z. (2003).
Application of satellite remote sensing in natural hazard management: the Mount Mangart landslide case study. International Journal of Remote Sensing, Vol. 24, pp. 3983-4002.
Schaum, A., & Stocker, A. (2003). Linear chromodynamics models for hyperspectral target detection. in Proceedings of the 2003 IEEE Aerospace Conference (IEEE, 2003), Vol. 4, pp. 1879-1885.
Udo, K., Sugawara, D., Tanaka, H., Imai, K., & Mano, A. (2012). Impact of the 2011 Tohoku earthquake and tsunami on beach morphology along the northern Sendai coast. Coastal Engineering Journal, 54, 1250009.
The International Archives of the Photogrammetry, Remote Sensing and Spatial Information Sciences, Volume XLI-B7, 2016 XXIII ISPRS Congress, 12–19 July 2016, Prague, Czech Republic
This contribution has been peer-reviewed.