AUTOMATIC GENERATION OF BUILDING MAPPING USING DIGITAL, VERTICAL
AND AERIAL HIGH RESOLUTION PHOTOGRAPHS AND LIDAR POINT CLOUDS
W Barragán a, *, A Campos b, G Sanchez c,
a
Topographic Engineering, environment and natural resources Faculty, Francisco José de Caldas, Distrital University, Bogotá, Colombia – [email protected]
b
Department of cartography, Geotopo research group, Francisco José de Caldas, Distrital University, Bogotá Colombia – [email protected]
c
Environment Engineering, libre University, Bogotá, Colombia – [email protected]
Commission VII, WG VII/4
KEY WORDS: Cartography, Automatic Extraction, Photogrammetry, Aerial Photographs. Image Segmentation
ABSTRACT:
The objective of this research is automatic generation of buildings in the interest areas. This research was developed by using high resolution vertical aerial photographs and the LIDAR point cloud through radiometric and geometric digital processes. The research methodology usesknown building heights and various segmentation algorithms and spectral band combination. The overall effectiveness of the algorithm is 97.2% with the test data.
1. INTRODUCTION
The GEOTOPO1 Research Team made the methodological
design of this research that was submitted to a field test and whose purpose was to automatically extract and in a vectorial way the building roofs in the working field, located in Bogotá,
Colombia. Last tendencies to automatically generate
cartography were used, as well as the directions imposed by the scientific and technical commissions of the International Society of Photography and Teledetection (IPRS) during the last five years (Triglav & Zorn, 2014; Nga & Yanai, 2014). In the same way we had into account the Colombian tendencies from the different universities having curricular programs having to be with the geomatic area.
We also used the integral method that allows digital image processing of a high spatial resolution (Sebari & He, 2013). Once we obtained the internal and external orientation and the digital design of ground, we obtained the orthophoto (Minetto, Thome, Leite & Stolfi, 2014; Martínez, Soria & Arias, 2014; Lim & Suter, 2009). This product was then the prime matter to be used with the point clouds obtained from the LIDAR technology. We also had into account the building height extracted from the surface digital model (SDM), and the image segmentation algorithms were generated through totally digital processes. The aforementioned is complemented through the threshold definition and the standard deviation of pseudoimge that represents the digital model of surface (Madhavan, Wang, Tanahashi & Yamamoto,2006; Kabolizade, Ebadi & Ahmadi, 2010).
To highlight the features of elements, we made algebraic operations and combinations among the spectral bands of photographs, reaching a whole view of the area buildings. We determined geometry, shape and capacity (Awrangjeb, Zhang & Fraser, 2013) as well as scale factors. These factors, all together
1 The research group is directed by William Barragán Zaque and develos activities since 2007, they develop their activities at the Universidad Distrital Francisco José de Caldas in Bogotá. The group is supported by the Faculty of Topographic Engineering and PhD in Information and Communicatio Sciences with emphasis on Geomatics.
allowed the automatic extraction of the buildings in the area covered by air photographs. The result of this work exhibits the buildings obtained through a totally automatic way. In this we made possible to view the significant progress as well as the limitations in this topic (Gamanya, Maeyer & Dapper, 2009). Final products were confirmed in field and we evidenced the last technologies in image segmentation, mixed with point clouds LIDAR and the integration of the different algorithms of class assignation that allow us to automatically obtain the
buildings of the working area with a 97.2%2 trust. Also, we
demonstrated that these tools can be used in other interesting fields of Colombian territory.
2. METHODOLOGY CONSTRUCTION
To start we made a whole photogrammetric process that allows us to obtain digital orthophotos. For that, we built Terrero’s Digital Model (TDM) the source of definition for units and the size of the pixel to work (8 cm), which is consistent with the final size of the image. Then we make segmentation of the image using the multiresolution algorithm (Hermosilla, Ruiz, Sarria & Recio, 2008).
Finally we make the conditions stipulation as well of the creation of rules that allows the automatic extraction of buildings. For this we classify the different elements of orthophoto using measurements of DSM and we start to refine based on the spectral information and other adjustments and fundamentals of context and shape to obtain automatic cartography of the area buildings.
PHASE I – PHOTOGRAMMETRIC PROCESS
The images were acquired from the Instituto Geográfico Agustín Codazzi – IGAG taken with the digital aerial camera
2 Reliability was estimated based on the simple comparative error margin existing in the interest area measured directly on ground by means of techniques involving high quality standards (global positioning where multiple signals are simultaneously received from the different positions of satellites, correcting ambiguities and allowing to determine the tridimensional position of point with precision.
Vexel Ultracam D3. To develop this task we had take into that fit to the photogrammetric restitution, something that allows to obtain cartography (Barragán, 2013).
In this phase we made the selection of the reference frame that allows the definition of locations by means of coordinates. This is the essential complement for the establishment of photogrammetric block, because we have into account the average flight height for photographs and the kind of sensor (in this case data from photogrammetric camera Vexcel Ultracam D).
Before starting the inner orientation of each vertical aerial photograph, we create the pyramidal images that optimize the spreading time and process (Qin & Gruen, 2014). For this orientation we use the pixel size. Besides the sensor setup, it is necessary to input data from calibration certificate of camera with which photos were taken. In the case of external data homologous points in the image. This process can be manually or automatically made. When the photogrammetric block is adjusted it is possible to calculate the statistics having to be with the minimum squares used to estimate the precision parameters. Minimum squares reduce and distribute errors through the block. In the same way, the real coordinates are assigned to the design based on the control points obtained on ground.
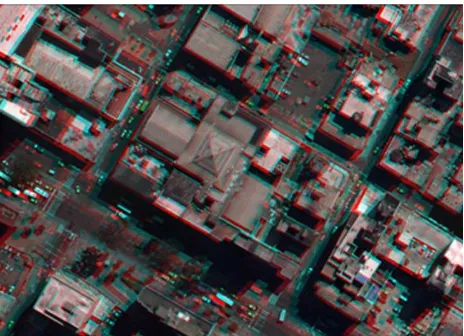
Finally in this stage we elaborate DTM. To test its precision, this is generated through a parameter which is the same number of pixels per square meter in the final design required. Ground data can be seen through mono or stereo ways. In figure one, we observe a part of the stereoscopic pair of the working area, which can be seen in third dimension. This item is important to generate the DTM to be used in the orthophoto to be worked with segmentation (Ergum, Sahin & Ustuntas, 2014).
3 Aerial digital metric camera, owned by the Instituto Geográfico Agustín Codazzi – IGAC.
4 Allows us to obtain positioning data in a photo with respect to the fixed reference point on ground, identifying rotation changes such as: pitch, roll and yaw.
Figure 1. Stereoscopic design of a part of working area in Bogotá to be seen in third dimension through the anaglyphs system.
Source: Authors.
PHASE II – SEGMENTATION
Segmentation Algorithms
These algorithms are used to subdivide whole images to the pixel level, or exhibit the image objects of different domains in more little image objects. There are different algorithms to make segmentation of digital images. The most simple are the ones of
the chess board called Chessboard Segmentation5. And the
segmentation based on the quadrangle trees or quadtree6. There
are more sophisticated algorithms like the multiresolution segmentation and the filter contrast one (Awrangjeb et al., 2013). Specific use of those algorithms appears whenever you want to create new image objects based on the information from the layers of the original image. Besides, they are a very valuable tool to refine objects in the existing image, by means of the subdivision in more little images for a very close exam of the most little parts.
Segmentation Algorithm by means of Multi Resolution
This algorithm minimizes medium heterogeneity of the objects existing in an image, having into account a determined resolution. It can be worked at the level of object or the level of pixels to create new image objects in the specific interest area. (Kabolizade et al., 2010).
The multi resolution segmentation algorithm continuously merges pixels and the object existing image. So, this algorithm is termed as “from down to up” algorithm due to the reason that
it exhibits a segmentation on a region by pairs (pairwise)7
(Guarnieri et al., 2011). The segmentation process by multi resolution represents a wider mutual focus (mutualbest-fitting) and it works based on the following rules:
1. The root file looks for the best adjustment with the
neighboring one for a possible merge.
5 It is a segmentation algorithm that divides the pixel domain or the domain of object images in square image objects. The main characteristic is that segmentation of digital image is exhibited in squares of equal size, similar to a chessboard. The square size is defined is the scale parameters.
6 It is a segmentation algorithm that divides the pixel domain in different sized squared objects. It is applied on all the objects of domain and each object has to be cut along the division lines. Each square has a maximum size being right with the uniformity parameters defined in the scale. The maximum size of a squared object is 256 x 256, or 65.536 pixels.
7 Segmentation based on the pair comparison. It means any comparison process between pairs to assess the preferred entity, or the one having a larger amount of some quantitative properties. The pair comparison method is used in the scientific study of preferences, attitudes, and multi agent systems of artificial intelligence.
2. If the best adjustment is not mutual, the best mutual candidate image for a new root.
3. The image object finds its best mutual one.
4. When the best adjustment of pixels is mutual, image
objects can merger
5. On each pair merged, each image object at the object
level will be manipulated only once.
6. Cycles continue the necessary times until a possible
merge is not obtained.
Procedure starts with the segmentation of individual image
objects of a pixel, which constantly merge in several pairs8
becoming bigger bigger units, whenever there is a higher uniformity threshold that can’t be locally overpassed (Ergum et al., 2014; Minetto et al., 2014). This criterion is defined as an spectral uniformity combination. This calculation can be only affected by means of modifying the scale parameters. For this task we used a value corresponding to 25 pixels as the factor (Jung, Jeon & Cho, 2014). When assuming a high value as a parameter, the segmentation result of a segmentation a bigger size image. Otherwise, when given a lower value for this quantification, result is a shorter sized object.
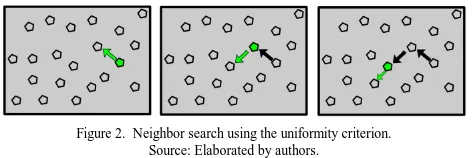
In Figure 2 we can notice that every image object uses the uniformity criterion in order to determine the best neighbor to merger with. If the first neighboring image object (green) doesn’t acknowledge the first object image (gray) as the best neighbor, algorithm moves (green arrow) to the second object image in order to find the best neighbor.
Figure 2. Neighbor search using the uniformity criterion. Source: Elaborated by authors.
A routine is made to search for the best neighboring image object. Iterations are made until there is no possible merges with additional image objects. This procedure can be made without overpassing the maximum allowed uniformity for an image object, as defined previously (Bucksch & Lindenberg, 2008; Kabolizade et al., 2010). No matter the average size of image objects, multi resolution segmentation exhibits a good abstraction and confirmation of areas. However it has as a main requirement that the working station (WS) must have a very high memory capacity. It is necessary to have into account that other segmentation techniques may require more informatics resources. Figure 3 graphically exhibits the formation of new areas. It exhibits how the multi resolution segmentation algorithm works for the location to jump from one place to another until finding the best neighbor. If uniformity of the new image object overpasses the scale parameter, both objects of the paired image merge forming then a new area.
8
pair or loop in programming, is something repeated several times in a part of a code, generating iterations until the condition can’t be reached anymore.
Figure 3. Formation of a new area. Source: Authors
Adjusting Segmentation
To make a multiresolution segmentation we can assign a weight to the different layers of the image. It is possible to have more suitable results due to when the higher the assigned value is for an image layer, it will add more relevance to the formation of pixels of the layer during the segmentation process.
It is also possible to specify thematic layers to be candidates for a segmentation. Each thematic layer used for segmentation will lead to an additional division of image objects, at the same time it will allow a consistent access to its thematic information. It is possible to segment an image using more than one thematic layer. Te results are the image objects representing the right intersections among those thematic layers. There is no doubt that the definition of of size for the new areas in the segmentation is the scale parameter, which determines the maximum uniformity allowed for the resulting image objects. This parameter also defines the resulting objects of a determined scale value to condition a higher number of uniform areas and a lower number of uniform areas. (Sebari et al., 2013).
It is advisable to produce image objects having the higher possible scale, they allow to distinguish the different image areas being right with the principle of having final areas as big as possible and fine as possible. It is also advisable to verify that the separation of the different areas to be more important than the objects’ scale of the image.
Criterion for establishing uniformity
The scale parameter defines the uniformity of the resulting areas of segmentation. Three main criteria are calculated mainly: color, softness and compactness. Color criterion is the most important in order to create significant objects. When there is high uniformity, it normally improves the quality of the element extraction, because their compactness is associated with the concept of the image shape (Awrangjeb et al., 2013). The aforementioned allows the shape criteria to be especially useful to prevent the resulting of highly broken interest units. If there is a high special resolution, the probability is also high. Figure 4 exhibits an air photograph with a GSD of 3 centimeters that corresponds to an area in the north of Bogotá, taken from a helicopter at a 100 meter height, having a nonmetric calibrated camera.
Figure 4. Aerography with a 3cm pixel size corresponding to an area in the northern Bogotá.
. .Source: Elaborated by authors.
Shape
Analysis made based on this judgment modifies the relationship between the shape and color criteria. Alteration of these variables when exhibiting a numeric value of 1, diminishes the average od spectral values in the image layers contributing to the uniformity criterion. This is weighted with the average of similarity of shape. If a weight change is given on the shape criterion to a numeric value of 1, it will lead to more optimized objects in special uniformity. However the shape criterion can’t have a numeric value higher than 0.9 due to without having the spectral information of image, resulting objects won’t relate with the spectral information (Ergum et al., 2014). Besides the spectral information, the object uniformity will be optimized with respect to the shape of the object defined by compactness parameter.
Compactness
To be able to optimize the final result of image objects, we use compactness. It must be used when different image objects that are very compact have to be separated by non-compact object and only by means of a very weak spectral contrast. In figure 5 we can see a segmented aerography comparison with a parameter of uniformed uniformity criteria, 0.1, shape, compactness 0.5. besides it presents a variation in the scale factor. For a) 800, b) 500, c) 300, and d) 100.
(a) (b)
……….(c) (d)
. Figure 5. Segmented air photograph, with a variation in the scale factor. Source: Elaborated by authors.
Spectral Difference Segmentation
This algorithm merges the neighboring image objects, based on the medium values and the image intensity layer, it means, that if the difference among their medium intensity layers is below the value given by the maximum spectra difference, it merges (Ergum et al., 2014). This algorithm is designed to refine the segmentation existing results, by means of the spectral merger of similar image object produced by former segmentations.
Segmentation Adjustments
It is possible to define the maximum spectral difference having into account the panchromatic values between the image objects that are used during segmentation. If the difference value is low, the neighboring objects merge (Sebari et al., 2013). Bellow we can see equations [(1, 2, 3)] that represent the normalization of each of the layers based on the assigned weight to each of them, where [k1; k2; k3] correspond to the layers, and [w] has to be with the assigned weight.
1
=
( 11+ 2+ 3 )
(
1)
2
=
( 21+ 2+ 3 )
(2)
3
=
( 31+ 2+ 3 )
(3)
Equation 4 represents the image layer weight relationship each of them with the corresponding considered values, where we can find out that the higher the weight is for an image layer, more relevant the pixel information for the layer will be during the segmentation process. The mathematical expression (Abs) corresponds to the average differences between neighbors. This feature describes the difference between an object image and its neighboring objects’ images in terms of their layer intensity medium values (Awrangjeb et al., 2013). We can also use a variable such as the layer weight.
1 × 11 – 12 + 2 ×
21 – 22 + 1 × 31 – 32 (4)
PHASE III – AUTOMATIC EXTRACTION
The main material to obtain cartography in an automatic way are basically two: the first, the multispectral image obtained from V excel ultra Cam D; and the second, the LIDAR point cloud that was changed in a pseudo image, and it represents the Surface Digital Sample (Madhavan et al., 2006). Image has three spectral stripes (red, green, blue). It had a multi resolution segmentation in order to be able to discriminate the different areas with uniformity and heterogeneity. Then we can make the first classification of buildings having as a basic parameter their height, information extracted from the DSM media, which for the development of the current task was stated to be higher or equal to2610 msnm. As a result we obtained areas satisfying this elevation condition. The obtained areas are made a statistic analysis of the standard deviation behavior for the heights of the formerly classified elements. It is assumed that if the standard deviations of heights have a low dispersion, it corresponds to the buildings’ roofs; if there is a high dispersion, it has to be with vegetation. Through this criterion we can a mathematical algorithm for class assessment assuming that the elements having a standard deviation value higher than 6 correspond to trees. In this way we, we can subtract the aforementioned areas considered to be buildings and which based on the Standard Deviation Values DSM are not such (González, Rodríguez & Lagüela, 2012). Although the building categorization is improved, it is possible to observe that even part of vegetation has been classified as buildings. To improve this result, we made a refinement based on the spectral information where we can make the following operation among strips:
egetation Enhance = (# " ! " + ! " + !$% ! " ) ! "
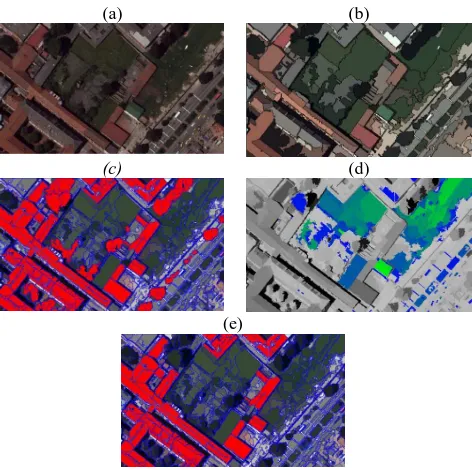
After applying the aforementioned formula, we can see the places where there is vegetation. This information is useful to identify areas that are still classified as buildings and are not. This allows us to generate a more accurate classification. As the new building classification exhibits areas where we can observe that buildings are no completed in geometry, it means that they don’t have a regular and defined shape as really exhibited. We proceed to make a refinement based on context. For this procedure we have into account the area relationship with the neighboring pixels. When applying the class assignation algorithm and define a threshold condition for the edges of buildings, geometry improves substantially (Awrangjeb et al., 2013). In this way we reach a totally automatic and accurate result for the areas corresponding to buildings in the studio field. Figure 6 exhibits different images evidencing the segmentation process and automatic extraction of buildings. In image a) Red, Blue and Green (RGB). B) Image segmentation with a scale parameter of 100. c) Image classification having into account the DSM height values. d) Vegetation enhancement obtained through the stripe mathematical operation. e) Final result, automatic building extraction, the product of a the application of different algorithms and refinements.
(a) (b)
(c) (d)
(e)
Figure 6. Automatic Segmentation Process for buildings. It exhibits the sequence of application of the different algorithms and refinements.
Source: Authors.
CONCLUSIONS
We can affirm that Automatic extraction of elements in photographs, areas and images that are product of aero transported sensors, will be to medium or long term, one of the most used methods for cartography generation, due to reliability, efficiency and promptness in obtaining the representative elements of ground.
In a general perspective, image segmentation is the most important starting point to obtain high precision works derived from cartographic products. Quality of these results is comparable with the one of the traditionally obtained by means of the restitution of stereoscopic samples. Selected criteria for this segmentation depend from homogeneity or heterogeneity of the segmented areas. This will lead to the ease of making refinements and apply the right algorithms allowing the improvement of the classification made.
The suggested and implemented methodology for the development of this task can be improved based on the proposed goal and depending on the required elements to extract digital images. Here suggested results were confirmed directly on ground, and we concluded that the trust level in the final extracted classification is the equivalent to 97.2%. Through this, it is clear that the obtained results are reliable because from every 100 pixels automatically classified, at leas 97 were correctly classified if compared with direct ground measurements.
ACKNOWLEDGEMENTS
Acknowledgements of support for Francisco José de Caldas, Distrital University, Florida Atlantic University, Department of Civil, Environmental & Geomatics prof. Sudhagar Nagarajan libre University.
REFERENCES
Awrangjeb, M., Zhang, C. & Fraser, C. S. (2013). Automatic extraction of building roofs using LIDAR data and multispectral imagery. ISPRS Journal of Photogrammetry and Remote
Sensing 83, 1-18.
Barragán, W. (2013). Historical documentation in San Agustin (Huila), Colombia, world historical heritage using close range photogrammetry techniques. Taking the Benefits of Geographic Information Technologies 93, Applied Geoinformatics for
Society and Environment (AGSE Conferences) Stuttgart.
Bucksch, A. & Lindenbergh, R. (2008). CAMPINO - A skeletonization method for point cloud processing. Journal of
Photogrammetry and Remote Sensing 63(1), 115-127.
Ergun, B., Sahin, C., & Ustuntas, T. (2014). Segmentation and determination of grid points of curve points in terrestrial laser scanning data for regular curve surfaces via C-means integrated fuzzy logic approach. Optics and Lasers in Engineering 52, 261-268.
Gamanya, R., Maeyer, P, & Dapper, M. (2009). Object-oriented change detection for the city of Harare, Zimbabwe.
Expert Systems with Applications 36(1), 571-588.
García-San-Miguel, D. & Lerma, J. L. (2013). Geometric calibration of a terrestrial laser scanner with local additional parameters: An automatic strategy. Journal of Photogrammetry
and Remote Sensing 79, 122-136.
González-Aguilera, D., Rodriguez-Gonzalvez, P., Armesto, J., & Lagüela, S. (2012). Novel approach to 3D thermography and energy efficiency evaluation. Energy and Buildings 54, 436-443.
Guarnieri, A., Vettore, A., Camarda, M., & Domenica, C. (2011). Automatic registration of large range datasets with spin-images. Journal of Cultural Heritage 12(4), S. 476-484.
Hermosilla, T., Ruiz, L.A., Fdez. Sarriá, A., & Recio, J.A. (2008, febrero). Detección automática de edificios en imágenes aéreas mediante técnicas de teledetección y análisis contextual. Ponencia presentada en el Congreso Internacional sobre
Ingeniería Geomática y Topográfica, TOP-CART 2008.
Valencia, España.
Jung, J., Hong, S., Jeong, S., Kim, S., Cho, H., Hong, S., & Heo, J. (2014). Productive modeling for development of as-built BIM of existing indoor structures. Automation in Construction 42, 68-77.
Kabolizade, M., Ebadi, H., & Ahmadi, S. (2010).. An improved snake model for automatic extraction of buildings from urban aerial images and LiDAR data. Computers, Environment and
Urban Systems 34(5), 435-441.
Lim, E. H. & Suter, D. (2009). 3D terrestrial LIDAR classifications with super-voxels and multi-scale Conditional Random Fields. Computer-Aided Design 41(10), 701-710.
Madhavan, B., Wang, C., Tanahashi, H., Hirayu, H., Niwa, Y., & Yamamoto, K. (2006). A computer vision based approach for 3D building modelling of airborne laser scanner DSM data. Computers, Environment and Urban Systems 30(1), 54-77.
Martínez, J., Soria-Medina, A., Arias, P., & Buffara-Antunes, A. F. (2012). Automatic processing of Terrestrial Laser Scanning data of building façades. Automation in Construction 22, 298-305.
Minetto, R., Thome, N., Cord, M., Leite, N. J., & Stolfi, J. (2014). SnooperText: A text detection system for automatic indexing of urban scenes. Computer Vision and Image
Understanding 122, 92-104.
Nga, D. H. & Yanai, K. (2014). Automatic extraction of relevant video shots of specific actions exploiting Web data.
Computer Vision and Image Understanding 118, 2-15.
Qin, R. & Gruen, A. (2014). 3D change detection at street level using mobile laser scanning point clouds and terrestrial images.
Journal of Photogrammetry and Remote Sensing 90, 23-35.
Sebari, I. & He, D. C. (2013). Automatic fuzzy object-based analysis of VHSR images for urban objects extraction. Journal
of Photogrammetry and Remote Sensing 79, 171-184.
Triglav ekada, M., Zorn, M., & R. Colucci, R. (2014). Changes in the area of the Canin (Italy) and Triglav glaciers (Slovenia) since 1893 based on archive images and aerial laser scanning.
geod. vestn. 58(02), 274-313.