ASSESSMENT OF OSCAT WINDS FOR COASTAL CIRCULATION ON THE NORTH
WESTERN CONTINENTAL SHELF OF INDIA
M. Salim a,b, *, K. Nagendra a, S. Bansal a, R. K. Nayaka, M. S. Rao b, S. K. Sasmal a, C. B. S. Dutt a, K. H. Rao a, V. K. Dadhwal a
a National Remote Sensing Centre (NRSC). ISRO, Hyderabad, India.
b Centre for Earth atmosphere and weather modifications, JNTUH, Kukatpally, Hyderabad, India. * [email protected]
Commission VI, WG VI/4
KEY WORDS: Scatterometers wind, OSCAT, Coastal Circulations.
ABSTRACT:
Winds and tides are the major driving forces of the circulation in the coastal and marginal seas. Data Interpolating Variation Analysis (DIVA) method is used to generate spatial and time series data of sea surface winds for the period 2010-2013 at daily time scale from the OSCAT observations. Validity and consistency of the data were examined against the in situ observations and ECMWF re-analysis at different time scales. Amplitude of semi-annual cycle of OSCAT winds in the coastal domain is 30% larger than the ECMWF winds while the amplitude of annual cycle of OSCAT winds is 20% smaller than the ECMWF winds. On the open oceans, intensity of respective semi-annual cycles are mostly similar while annual cycle of OSCAT wind is 20% smaller than the ECMWF winds. Wind driven currents over the western continental shelf of India were simulated by forcing OSCAT and ECMWF winds to a coastal circulation model. It is observed that the mean seasonal circulations from both the simulations are identical spatial pattern however the magnitude of simulated currents based on OSCAT winds are much stronger than ECMWF wind forcing. These currents used in a lagrangian tracer transport code to model the oil-spill events occurred in this region. It revealed that OSCAT based ocean currents has performed better in simulating the trajectory than the ECMWF wind driven currents.
* Corresponding author. This is useful to know for communication with the appropriate person in cases with more than one author.
1. INTRODUCTION
The lack of high resolution winds limits the exploration of modelling the circulations and dynamics in coastal domains. The availability of High resolution 12.5 Km winds from Ocean Sat 2 Scatterometer (OSCAT) may have improved impact in representing coastal oceans from regional to coastal scale modelling. The scatterometer derived Ocean Surface winds are useful for several oceanographic applications associated with ocean currents, fluxes of momentum, heat, moisture, exchange of gasses between ocean and atmosphere, etc. The Ocean surface Winds are major factor for generating the Ocean Currents, which play important role in transport of tracers such as heat, chlorophyll, sediment, etc in the ocean. Winds accelerate evaporative processes at the ocean surface, hence driving exchange of fresh water and heat (latent heat flux) between the ocean and atmosphere. Besides that, it controls exchange of various gaseous elements and compounds (such as CO2) between ocean and atmosphere. The gridded wind products from the Oceansat-2 observations are being generated at different spatial resolutions: 50km, 25 km, 12.5 km etc. Assessment of wind products at 50 Km and 25 km were carried out previously (Sudha and Rao, 2013, Chakraborthy et al (2013), Vogelzang et al. (2011)). A proper assessment of this high resolution winds are essential with emphasis on coastal domain along with the in-situ measurements as well as their performance with the circulation models.
In the present study, the assessment of 12.5 km winds for coastal oceans of India has been out by comparing with European Centre for Medium-range Weather Forecast
(ECMWF) reanalysis, in-situ buoy observations and by forcing on a coastal circulation model. The experimental set-up of circulation model was being carried out on the north western continental shelf of India.
2. DATA AND METHODOLOGY
OSCAT data at 12.5 Km resolution is downloaded from the website ftp://podaac-ftp.jpl.nasa.gov.in. Daily wind passes of OSCAT for year 2011 are collected and combined into single file. Vector representational Wind Seasonal Maps for OSCAT 2011 are plotted using climatological axis. Its need of validation for high resolution OSCAT winds with the study region of Indian Ocean.
The ECMWF reanalysis products, which feeds historical and other available weather observations to a NWP (Numerical Weather Prediction System) system. It models or recreate past atmosphere sea and land surface conditions over specific periods to obtain the clear picture how the climate is changed. Reanalysis provides the most comprehensive and more accurate four Dimensional picture of our atmosphere. It has been used as input data for many predictive and analysis system developed for monitoring of ocean and land surface processes and atmospheric trace gas and pollution etc. With national and international efforts, several in situ met-observation networks (moored buoy, ARGO and ship-of opportunities) have been installed in the TIO. RAMA (Research Moored Array for African-Asian-Australian Monsoon Analysis and Prediction) buoy networks comprised of 30 buoys are continuously measuring the met-parameters along The International Archives of the Photogrammetry, Remote Sensing and Spatial Information Sciences, Volume XL-8, 2014
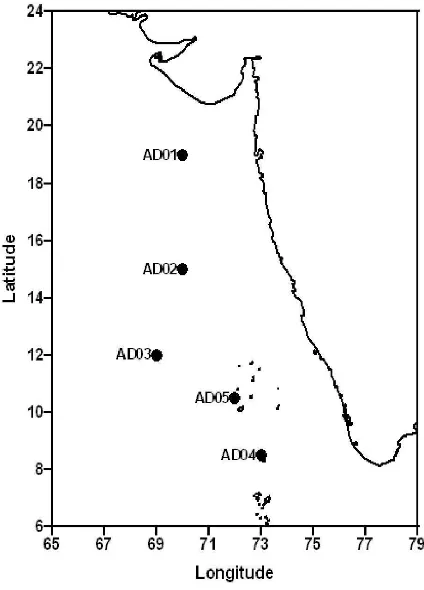
with oceanographic parameters since 2008. India also deployed few coastal moored observations on the eastern Arabian Sea for the similar purpose. The data retrieved from these in situ networks are very reliable and can be used for the calibration and validation of satellite observation, algorithms, and model derived parameters. We have obtained 5 moored buoy data from Indian National Centre for Ocean Information services (INCOIS) at locations 700E-190N (AD01), 700E-150N (AD02), 690E-120N (AD03), 730E-8.50N (AD04), 720E-10.50N (AD05) Figure. 1.
Figure 1: Coastal Moored Buoy locations 2.1 Generation of Oscat Daily winds
The Daily wind fields of OSCAT has been generated using Data-interpolating variational analysis (DIVA) tool. DIVA is a data analysis tool developed by GeoHydrodynamic and Environmental Research (GHER) under the SeaDataNet project of the European Union. DIVA utilizes variational inverse method (VIM) for data interpolation (Brasseur et al. 1996). DIVA additionally has the unique provision for identifying the coastline and topography inbuilt into it and has a numerical coast independent of the number of observations. Automatic outlier detection, based on the comparison of the data residual and the standard deviation, is one of the additional features of this analysis tool (Troupin et al. 2010). It is therefore considered suitable for the present work. Daily winds of OSCAT ascending and descending passes are first merged and then submitted to the DIVA technique to generate a daily composite of 12.5 Km resolution.
2.2 The Circulation model
In the present study we have used the Princeton Ocean Model (POM) developed by Blumberg and Mellor (1987). The POM is a terrain following three dimensional ocean circulation model most suited for coastal ocean processes studies. The
model settings was followed the same methodology of Nayak et. Al., 2014 and Salim et. Al., 2014, here the study area was extended for the west coast of India (See Figure.1). In the present case, model grid of the study region extends 65 - 780E and 6 - 24 0N, consists of uniform Cartesian coordinate system with 2 minute spatial. The model run was carried out with time varying tidal level (due to the major tidal constituents: M2, S2, N2, O1, and K1), feeble currents at western and southern boundary and winds at surface.
3. RESULTS AND DISCUSSIONS
3.1 OSCAT Vs In-Situ observations.
The OSCAT Wind data is validated along the west coast of India with the Moored Buoys (See Figure 2 and 3). Coastal moored buoy’s data plays key role in measuring the characteristics of ocean. The observational Coastal Moored Buoy provides the data about atmospheric pressure, air temperature, humidity, wind, currents and wave data of the ocean currents for both the operational and further research purpose. The RMS Difference for Wind Speed is 2 m/sec and for Wind Direction are 600 for all the Coastal Moored Buoys on an average over the Indian Ocean.
Figure 2: Scatter plots between wind speeds measured at NIOT coastal buoys (AD01-AD05, SW02) and co-located OSCAT winds.
Figure 3: Scatter plots between wind direction measured at NIOT coastal buoys (AD01-AD05, SW02) and co-located OSCAT winds.
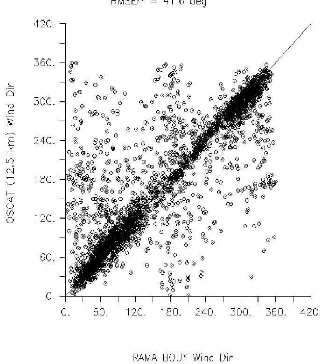
We also looked at the validity of OSCAT Wind Data at open ocean by using the available In-situ Observational RAMA Buoy Data network instruments Located at different Lat/Long positions over the Indian Ocean (See Figure 4 and 5). Normally OSCAT Wind Speed is in the range of 0 to 24 m/sec and Wind direction is 0 to 3600 degrees. OSCAT Wind Speed and Wind Direction parameters are compared with In-Situ RAMA Buoy Data and the RMS error is 1.3 m/sec for wind speed and 41.60 phase difference for wind direction on an average for all the operational Buoys over the Indian Ocean Region.
Figure 4: Scatter plots between RAMA buoys wind speed Forecasting) ERA-Interim Wind Product over the Indian Ocean in several grid regions of Arabian Sea(AS), Bay of Bengal(BOB), and Equatorial Indian Ocean(EQ) for different seasons (Winter Spring, Summer, Autumn) of Climatological axes. For Winter Season the OSCAT Wind U and V components are Comparable with ECMWF U and V components. The Scatter plots for Wind U and V components between OSCAT and ECMWF are plotted. The RMS
difference for U and V are 0.38 and 0.82 in AS region and 0.82, 0.79 in BOB and 0.43, 0.76 in EQ region respectively. There is large difference in RMS in Coastal region than open Ocean region on all seasons when comparing the OSCAT with ECMWF Data. Bathimetry -200 which differ the grid region into open ocean and coastal. Open Ocean i.e. less than -200 Bathymetry where in coastal with greater than -200 Bathymetry. In spring season the RMS difference for U and V components are 0.89 and 1.03 for AS region and 0.88 for U and 0.83 for V in BOB region and 0.40 for U and 0.55 for V in EQ Region. In Summer Season the RMS difference for U and V is 1.08 and 1.10 in AS region and 1.05 for U and 1.06 for V in BOB region and 0.49 for U and 0.69for V in EQ regions respectively. At last during Autumn Season RMS error for U and V are 1.22 and 1.56 in AS region and 2.50 and 1.08 in BOB and 0.62 and 0.68 in EQ regions respectively.
Figure 6: Stationary components (H0) and amplitudes of annual and semi-annual cycles of wind speed based on OSCAT (upper panels) and ECMWF (lower panels) data sets. The left column represents stationary component, middle column represent semi-annual cycle, and right
The harmonic analysis time series data of Three years (2011,2012 and 2013) daily winds has been carried out for entire North Indian Ocean(NIO) and shown in figure 6. The pattern of stationary component was similar while the annual and semi annual has seen large differences in the coastal areas. The anlysis suggests that both OSCAT and ECMWF data have the semi-annual and annual oscillations as the dominant components. These two components together constitute seasonal characteristics of the time series and their contributions were estimated from respective data sets using the least square procedure. The residual (original time series minus the seasonal cycle) known as non-seasonal variability, which is further segregated into intra-annual and inter-annual variability. Amplitude of semi-annual cycle of OSCAT winds in the coastal domain is 30% larger than the ECMWF winds while the amplitude of annual cycle of OSCAT winds is 20% smaller than the ECMWF winds. On the open ocean domains the magnitude of their semi-annual cycles are similar and amplitude of annual cycle of OSCAT wind is 20% smaller than the ECMWF winds. There exists large difference between their spatial pattern of non-seasonal and intra-annual variability on the coastal domains.
3.3 Analysis of Modelled circulation outputs
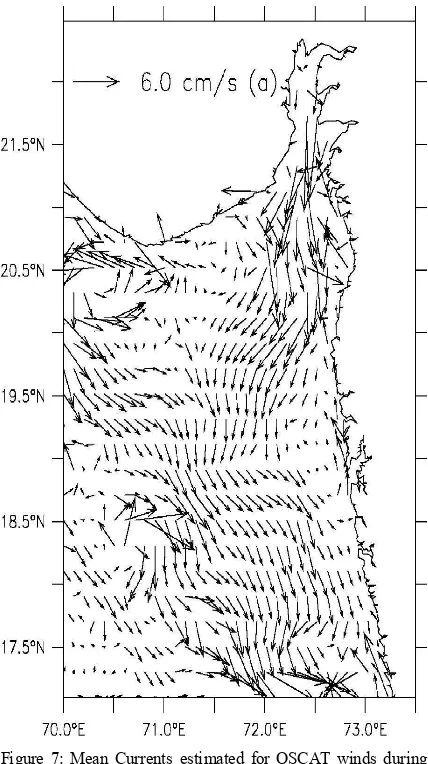
Numerical simulation of ocean currents on the west coast of India has been carried out with two different winds, with high resolution Oscat winds and the ecmwf reanalysis product. The Figure 7 represents the simulated mean current estimated after removing tidal oscillatory components on Aug 2011 of OSCAT. In both the experiments the other forcing terms such as tide and boundary conditions kept same and only the winds were switched between OSCAT and ECMWF. The estimated mean circulation from both the sources were followed the same pattern. The correlation between them was 0.72. The spatial average of mean current for OSCAT driven simulation was 2.75 cm/sec while that of ECMWF was 2.45 cm/sec. It is observed that the mean seasonal circulations from both the simulations are identical spatial pattern however the magnitude of simulated currents based on OSCAT winds are much stronger than ECMWF wind forcing.
Figure 7: Mean Currents estimated for OSCAT winds during the month of august.
Figure 8 represents the scatter plots between the zonal currents of OSCAT and ECMWF driven currents in upper panel and the lower panel represents the same but between the Meridional currents. The both currents zonal and meridional are better correlated with the correlation coefficient of 0.71 and 0.76 respectively. These currents used in a lagrangian tracer transport code to model the oil-spill events occurred in this region. It revealed that OSCAT based ocean
currents has performed better in simulating the trajectory than the ECMWF wind driven currents.
Figure 8: Scatter plot between OSCAT and ECMWF driven Ocean currents.
4. CONCLUSIONS
The daily composite of high resolution 12.5 Km winds has been generated using DIVA. The validity and consistency of the product were examined against the in situ observations and ECMWF re-analysis at different time scales. Wind driven currents over the western continental shelf of India were simulated by forcing OSCAT and ECMWF winds to a coastal circulation model. It is observed that the mean seasonal circulations from both the simulations are identical spatial pattern however the magnitude of simulated currents based on OSCAT winds are much stronger than ECMWF wind forcing. The International Archives of the Photogrammetry, Remote Sensing and Spatial Information Sciences, Volume XL-8, 2014
ACKNOWLEDGEMENTS
We are thankful to Podaac team for providing 12.5 Km OSCAT winds, also to the INCOIS and ECMWF for providing Moored buoy data and Reanalysis winds respectively.
REFERENCES
Abhisek Chakraborty, Sanjib K. Deb, Rajesh Shikakolli, Gohil B. S., Raj Kumar, 2013. Intercomparison of OSCAT Winds With Numerical-Model-Generated Winds. IEEE Geosci. Remote Sensing Lett. Vol. 10 No. 2 pp 260-262
Blumberg, A. F., Mellor, G. L., 1987. A escription of a three-dimensional coastal ocean circulation model. Three-Dimensional Coastal Ocean Models, N. S. Heaps (Ed.), 1-16, American Geophysical Union, Washington, DC.
Brasseur, P., J. M. Beckers, J. M. Brankart, and R. Schoenauen. 1996. “Seasonal Temperature and Salinity Fields in the Mediterranean Sea: Climatological Analyses of a Historical Data Set.” Deep Sea Research Part I: Oceanographic Research Papers 43: 159–192. doi:10.1016/0967-0637(96)00012-X.
Sudha, A. K. and Rao, C. V. K. P., 2013. Comparison of Oceansat-2 scatterometer winds with buoy observations over the Indian Ocean and the Pacific Ocean, vol 4, Iss. 2.
Troupin, C., F. Machín, M. Ouberdous, D. Sirjacobs, A. Barth, and J. M. Beckers. 2010. “High-Resolution Climatology of the Northeast Atlantic using Data-Interpolating Variational Analysis (DIVA).” Journal of Geophysical Research 115: C08005. doi:. doi:10.1029/2009JC005512.
Vogelzang, J., A. Stoffelen, A. Verhoef and J. Figa-Saldana, 2011. On the quality of high-resolution scatterometer winds. J. Geophys. Res. 116, C10033, doi:10.1029/2010jC006640.