Introduction
Changes in human lifestyle, mainly due to industrial-ization, induced developments in food consumption, nu-trition and health areas. Generally, sedentary lifestyle and factors like malnutrition, smoking, stress and city life ne-cessitate a more healthy diet. Although the common trend is to reduce or limit the consumption of fried foods, their consumption level is gradually increasing owing to their properties such as being tasty, easily prepared and micro-biologically safe (1). In order to minimize the negative ef-fects and/or to maximize the positive health eff ects and to maintain the quality of the fried products, new techniques have been developed in recent years. Many researchers have suggested diff erent techniques such as oil dilution, frying under modifi ed atmosphere, hermetic frying, fi l-tration, adsorbent treatment and addition of antioxidant additives into oil for the aforementioned purposes (2–5).
Antioxidants are chemical compounds that can be used to improve the oxidative stability of fats and oils by interrupting the free-radical mechanism of autoxidation. Synthetic antioxidants can readily retard lipid oxidation at room temperature, but they are easily degradable and can lose their activities at higher temperatures (5). Recent-ly, phenolic extracts obtained from organic sources have gained popularity as natural food antioxidant supple-ments. In our previous study, we investigated the effi cacy of phenolic extracts obtained from olive leaf, hazelnut leaf and hazelnut green leafy cover added into canola oil in actual frying conditions. It was shown that all frying oil samples with extracts had higher total phenolic content and antioxidant activity, and lower trans-fatt y acid levels than those of oil containing no supplements (6).
Some agro-food industry by-products rich in poly-phenols and antioxidant compounds could be preferably used as antioxidants instead of synthetics (7). Koh et al.(8)
ISSN 1330-9862 original scientifi c paper
doi: 10.17113/ft b.54.01.16.4109
Performance of Different Natural Antioxidant Compounds
in Frying Oil
Buket Ayden
ı
z
and Emin Yilmaz*
Department of Food Engineering, Faculty of Engineering, Çanakkale Onsekiz Mart University, TR-17020 Çanakkale, Turkey Received: February 5, 2015 Accepted: October 22, 2015 Summary
In this study, the natural green tea extract, purifi ed lycopene, purifi ed resveratrol and purifi ed γ-oryzanol were added into peanut oil and their antioxidant performances were evaluated during frying. Moreover, the sensory properties of fried dough were evaluated to determine the consumption feasibility. All natural antioxidants led to signifi cant in-crease in the stability of the oil samples. The ranges of measurements in the treatment groups were as follows: free acidity 0.1–2.9 g of oleic acid per 100 g of oil, conjugated di-enes 0.01–0.40 g per 100 g of oil, total polar material 8.8–73.8 g per 100 g of oil, total pheno-lics 0.1–4.2 mg of gallic acid equivalents per 100 g of oil, and antioxidant capacity 0.5–11.0 mM of Trolox equivalents per 100 g of oil. The fatt y acid and sterol compositions indicated that antioxidant supplementation could slow the oxidative degradation of unsaturated fatt y acids and reduce trans-acid formation. Frying oil enriched with purifi ed γ-oryzanol had higher sterol levels than the other enriched oil samples. The obtained quality of oil protection was in descending order: purifi ed γ-oryzanol, green tea extract and purifi ed ly-copene.
Key words: frying oil, peanut oil, green tea extract, lycopene, resveratrol, γ-oryzanol
______________________________
investigated the frying performance of palm-based medi-um- and long-chain triacylglycerol oil supplemented with tertiary butylhydroquinone (TBHQ) and oleoresin sage extract as antioxidants during frying for 5 consecutive days at 180 °C. The authors reported that antioxidant ad-dition enhanced rancimat induction period compared with the oil without the addedsynthetic and natural anti-oxidants. Furthermore, the supplementation did not lead to any negative eff ects on the sensory characteristics (odour, taste, crispiness and overall acceptability) of po-tato chips.
Based on previous studies, we selected some plant ex tracts that contain chemically diff erent antioxidant groups like catechins, stilbenes, carotenoids, phytosteryl ferulate mixtures and compared their activities under frying con-ditions. The plant materials utilized in this study were green tea (Camellia sinensis L.) extract, purifi ed lycopene (Lycopersicon esculentum L.), purifi ed resveratrol (Vitis vi-nifera L.) and purifi ed γ-oryzanol (Oryza sativa L.). The peanut oil was chosen as frying medium because, com-pared to other types of vegetable oil, it has higher smoke point value (229.4 °C), which is an important criterion in the formation of low-fat and crispy surface foods and us-age life of frying oil (9).
The aims of this study are to determine the eff ects of the extract obtained from green tea leaves, purifi ed lyco-pene, which is an acyclic carotenoid found in tomato, pu-rifi ed resveratrol, which is a phytoalexin found in grapes, and purifi ed γ-oryzanol, known as phytosterol ferulate ester mixture isolated from rice bran oil, on the control of thermal oxidation of peanut oil under the frying condi-tions and to compare their eff ects with synthetic antioxi-dant mixture. For this purpose, the antioxiantioxi-dant extracts mentioned above and synthetic antioxidants were added to peanut oil individually and dough samples were fried 5 h per day for seven consecutive days at 180 °C.
Materials and Methods
Materials
Refi ned winterized peanut oil was kindly provided by Helvacızade Food Pharma & Chemicals (Konya, Tur-key). For dough preparation, white wheat fl our (Kepez Flour, Çanakkale, Turkey), instant yeast (Dr. Oetker, İzmir, Turkey), and table salt (Billur salt, İzmir, Turkey) were purchased from local stores. Synthetic antioxidants butylated hydroxyanisole (BHA) and butylated hydroxy-toluene (BHT) used in this study were kindly supplied by Kemin Food Technologies (Herentals, Belgium) and Van-kim Chemical Ltd. (Istanbul, Turkey). Green tea leaves were from Caykur Tea Factory (Rize, Turkey). Purifi ed γ-oryzanol (98 %, white crystalline powder) was provid-ed by Oryza Oil & Fat Chemical Co., Ltd. (Ichinomiya City, Japan). Purifi ed resveratrol (ResVida, 99 % trans-res-veratrol, light grey powder) and purifi ed lycopene (Redi-vivo, 10 % lycopene fi nely dispersed in a matrix of modi-fi ed food starch and glucose syrup with coating of corn starch) were provided by DSM Nutritional Products Ltd. (Basel, Switzerland). All chemicals used for the analyses were of analytical grade and purchased from Merck Co. (Darmstadt, Germany) and Sigma Chem. Co. (St. Louis,
MO, USA). Internal standards used in chromatographic analyses were purchased from Supelco (Bellefonte, PA, USA), Nu-Chek-Prep, Inc. (Elysian, MN, USA) and Sigma Chemical Co.
Preparation and phenolic analysis of green tea extract
Green tea extract was prepared according to Perva- -Uzunalic et al. (10) with minor modifi cations. Green tea leaves were sorted, dried in a vacuum oven for 6 h at 40 °C and ground in a laboratory blender (Waring 7011S; Waring® Lab, Torrington, CT, USA). Then, the ground leaves were mixed with 20:1 (by volume per mass) extrac-tion solvent (methanol/water 80:20, by volume) and ex-tracted in an orbital shaker Unimax 2010 (Heidolph In-struments GmbH&Co. KG, Schwabach, Germany) at 200 rpm and 45 °C for 2 h. Finally, the mixture was centri-fuged in a refrigerated centrifuge (Sigma 2–16 K; Sig-ma Laborzentrifugen GmbH, Osterode am Hartz, GerSig-ma- Germa-ny) at 1615×g and 4 °C for 10 min. The supernatant was collected and the residue was re-extracted with 30 mL of extraction solvent. The solvent was then evaporated with rotary evaporator (Heidolph Instruments GmbH&Co. KG) under vacuum at 45 °C. The crude extract was kept frozen at –18 °C until usage.The phenolic compounds in the green tea extract were determined according to the method described in ISO 14502–2:2005 (11). HPLC system consisting of degas-sing unit (Spectra system SCM 1000; Thermo Finnigan, Thermo Scientifi c, Waltham, MA, USA), gradient pump (Spectra system P4000; Thermo Finnigan), autosampler (Spectra system AS3000; Thermo Finnigan) and diode ar-ray detector (Spectra system UV6000LP; Thermo Fin-nigan), controlled by ChromQuest 4 soft ware (Thermo Finnigan), was used for the phenolic compound analysis of the green tea extract. Separation was performed on a reversed-phase Luna® C18 column (250 mm×4.6 mm, 5 μm). Linear gradient elution programs with two mobile phases were used. The mobile phase A was acetic acid/ acetonitrile/water (3:9:88, by volume) and mobile phase B was acetic acid/acetonitrile/water (3:80:17, by volume), both containing 20 μg/mL of EDTA. The injection volume was 10 μL and fl ow rate 1 mL/min at 35 °C column tem-perature. The phenolic compounds were characterized and quantifi ed by comparing their retention times with those of commercially available standards. The results were expressed in g per 100 g of dry tea leaves.
Measurement of total phenolic content
The phenolics in the frying oil were fi rst extracted with water/methanol (60:40, by volume) at 1:1 ratio for 2 h. The extracts were centrifuged in a refrigerated centri-fuge at 6797×g at 4 °C for 10 min. The methanolic phase was separated and the residue was re-extracted by apply-ing the same procedure. Then, the liquid phase was fi l-tered through a 0.22-μm membrane fi lter. The obtained extracts were used for the determination of total pheno-lics and also for the antioxidant capacity measurements of the frying oil.
The total phenolic content of the frying oil samples was measured with the Folin-Ciocalteu reagent and quan-tifi ed with gallic acid standard curve (R2=0.999) as
de-scribed by Chotimarkorn et al. (12). A volume of 250 μL of phenolic extracts was mixed with 500 μL of 0.2 M Folin- -Ciocalteu reagent and 6 mL of distilled water. Saturated sodium carbonate (2 mL) was added and then vigorously vortexed for 2 min. Finally, the volume was set to 10 mL with distilled water. Aft er incubation at room tempera-ture for 2 h, the absorbance of the solution was measured at 750 nm using an Agilent 8453 UV-Vis spectrophotome-ter(Waldbrann, Germany). The results were expressed in mg of gallic acid equivalents (GAE) per 100 g of oil.
Measurement of antioxidant capacity
The antioxidant capacity values of the synthetic and natural antioxidant extracts and the phenolic extracts ob-tained from the frying oil samples were measured by the Trolox equivalent antioxidant capacity (TEAC)/ABTS˙+ (2,2’-azinobis(3-ethylbenzothiazoline-6-sul fonic acid) di am-monium salt) reference method using potassium persul-fate as an oxidant according to Re et al. (13). The described method is based on the decolourization assay of the ABTS+ free radical cation. The extent of decolourization is calculated as percentage reduction of the free radical cat-ion absorbance at 734 nm and equated relative to the reac-tivity of Trolox as a standard compound, under the same conditions.
Enrichment of peanut oil with the synthetic and
natural antioxidants
According to Codex Alimentarius Commission, syn-thetic antioxidants such as BHT and BHA are permitt ed at total concentrations of up to 200 ppm (individually or combined) in edible fats and oils (1). Diff erent masses of natural antioxidants were added to the peanut oil, calcu-lated based on TEAC value of the oil with added antioxi-dant mixture (300 mg of BHA/BHT=1:1 by mass per 1500 g of oil) in order to reach 313.77 mM of TEAC.
The calculated amounts were carefully weighed and then mixed with 100 g of oil at 100 °C and stirred in a high-performance homogenizer (Ultra Turrax, IKA-Wer-ke GmbH&Co. KG, Staufen, Germany) at 8000 rpm for 7 min. Then, this stock oil was added to the bulk frying oil (1.5 kg) in the fryer. Before frying, 100 mL of oil samples were collected into amber-coloured capped glass bott les and kept frozen until analyses.
Frying process
In order to compare the infl uence of diff erent oil sam-ples on frying, a standard dough sample was prepered with the following ingredients: fl our 62 %, water 37 %, and 0.5 % of each instant yeast and table salt. Principally, every day during the study, all ingredients were mixed until dough was formed. The dough was left to ferment for 30 min at 40 °C (Ecocell Drying Oven, MMM Medcen-ter Einrichtungen GmbH, Planegg, Germany), and then cut and rolled into 28–35 g patt ies. Home-type fryers (Ar-nica Z27A; Ar(Ar-nica, Istanbul, Turkey) were used for frying. The patt ies were fried for seven consecutive days in both control oil and oil samples with added synthetic antioxi-dant mixture (BHA/BHT), green tea extract, purifi ed res-veratrol, lycopene or purifi ed γ-oryzanol. During the day, the oil was heated in open fryers for 5 to 5.5 h at 180 °C.
The fryers were stopped during the night, and restarted the next day without any replenishment of fresh oil. Each day in each oil sample, two dough patt ies were fried for 10 min every half hour until a total of 20 patt ies were ob-tained per day. Aft er each day, 100-mL oil samples were collected from each fryer and frozen in capped amber-co-loured glass bott les until further analyses. The fried dough was placed into refrigerator bags, labelled and kept fro-zen until analyses. All frying treatments were replicated twice.
Chemical characteristics of the oil samples
The free fatt y acid content of the oil samples was de-termined according to AOCS method Ca 5a-40 (14) by ti-trimetric technique with alcoholic potassium hydroxide and phenolphthalein indicator.The conjugated diene con-tent was measured at 233 nm using an UV Mini 1240 spectrophotometer (Shimadzu Co, Tokyo, Japan) and 2,2,4-trimethylpentane (isooctane) as solvent by a method based on AOCS Ti 1a-64 (15). The total polar material was analyzed using a glass column fi lled with silica gel (12.5 g) and sea sand (2 g) in accordance with AOCS method Cd 20-91 (16). The total polar and non-polar compounds in oil were separated using the eluting solvents (petro-leum ether/diethyl ether 87:13, by volume) drained through the column.
Analysis of the fa
tt
y acid composition
The fatt y acid composition of the fresh peanut oil and frying oil samples at the end of the seventh day of frying was determined. The methyl esters of the fatt y acids were prepared according to AOCS method Ce 2-66 (17) using methanolic KOH/MeOH, whereas the fatt y acid composi-tion of the oil samples was determined by the AOCS method Ce 1-62 (18). The quantifi cation of the fatt y acid methyl esters was performed with a Thermo Finnigan Trace™ Ultra gas chromatograph equipped with HP 88 (100 m×0.25 mm, 0.2 μm) capillary column. The carrier gas was helium at a fl ow rate of 20 mL/min and the split ratio was 1:50. The injection volume was 1 μL. The oven temperature was programmed as follows: 150 °C for 2 min, with a programmed increase to 180 °C at a rate of 5 °C/min, then held for 8 min, followed by an increase to 225 °C at 10 °C and held at this temperature for 20 min. The injector and detector temperatures were 250 and 300 °C, respectively. The 37-component FAME mix (C4–C24; Supelco) and CLA standards (Nu-Chek-Prep, Inc.) were used for fatt y acid determination.
Analysis of sterol composition
The phytosterol composition of the oil samples taken on the seventh day of frying was analyzed according to ISO 12228:1999 method (19) and the sterol composition of the fresh oil was also provided. The oil samples were fi rst saponifi ed with a solution of ethanolic potassium hydrox-ide by boiling under refl ux. The residue (unsaponifi able matt er) was dissolved in acetone and again dried under nitrogen. The sterol fractions from the unsaponifi able ma-terial were separated by thin-layer chromatography on silica gel (20 cm×20 cm, 0.25-mm layer thickness) using hexane/diethyl ether (65:35, by volume) as developing
solvent. Extracted fractions were injected by an autosam-pler into a PerkinElmer AutoSystem XL gas chromato-graph (PerkinElmer, Waltham, MA, USA) equipped with fl ame ionization detector and an SE-54 (30 m×0.32 mm, 0.25 μm) column. Hydrogen was used as a carrier gas at a flow rate of 36 cm/s with a 1:20 injector split. Injection vol-ume was 1 μL. The injector and detector temperatures were 320 °C. The column oven initial temperature was 240 °C for 0.5 min, increased at 5 °C per min to 255 °C and held for 4 min, then increased at 5 °C per min to 310 °C and held for 30 min. GC control, data collection and inte-gration were performed by Total Chrom Navigator v. 6.3.1 (PerkinElmer). The phytosterols were characterized by comparison of their retention times (relative to 5α- -cholestane) to those of commercially available standards.
Sensory analysis of the fried pa
tt
ies
The patt ies fried on the fourth, fift h and sixth day in the control and oil samples enriched with extracts were taken and off ered randomly for the consumer acceptance test (20). The sensory evaluation was performed by 100 panellists (48 females and 52 males aged 20–40, selected among food engineering students and academic staff ). All fried patt ies were broken into four pieces, equilibrated to room temperature and then placed onto service plates coded with three-digit numbers. The panellists were pro-vided with water and an expectoration cup to cleanse the palate between sensory evaluations. Samples from the three frying groups were tasted by all panellists. Tasting of each sample was randomly replicated twice by all pan-ellists.
The sensory att ributes (appearance, texture, taste/fl a-vour, odour/aroma) of the fried patt ies were assessed by a fi ve-point hedonic scale with anchor points (1 for ‘dislike extremely’ to 5 for ‘like extremely’). The mean scores of the sensory att ributes collected by the hedonic scale were calculated.
Statistical analyses
The whole frying experiment was replicated twice, and in each of the replicate samples, the analyses were completed at least twice. The statistical package program Minitab v. 16.1.1 (21) was used for all statistical analyses. Signifi cant diff erences among the mean values of the sample measurements were determined by the two-way ANOVA with mean separation by Tukey’s test at a 95 % confi dence level. Non-parametric Kruskal-Wallis test was applied for the consumer acceptance test results to deter-mine the diff erences in the sensory properties of the fried patt ies. Dunn’s test was used for mean separations. All re-sults were presented as mean value±stan dard error or mean value±standard deviation.
Results and Discussion
Free fa
tt
y acid content
As expected, the free fatt y acid content increased dur-ing frydur-ing (Table 1). Free fatt y acid formation is att ri buted to hydrolysis and carboxyl group formation during fry-ing (4). Oil samples supplemented with antioxidants had
bett er stability and lower free fatt y acid content than the control sample (Table 1). Frying experiments showed that when free fatt y acid level exceeded 2 g per 100 g of oil, the fats became unwholesome and the oil required replace-ment (1). It was determined that free fatt y acid content of the oil with added antioxidants remained below the per-mitt ed level at the end of the seventh frying day, but it was not statistically signifi cantly diff erent. Natural anti-oxidants kept the free fatt y acid of the oil samples at simi-lar levels as the synthetic antioxidants (Table 1).
Conjugated dienes in frying oil samples
The conjugated dienes/trienes are primary oxidation products and they serve as reliable indicators for moni-toring the oxidative stability of the frying oil. Their mass fractions in the oil samples throughout the seven consecu-tive frying days are listed in Table 2. As it is seen, the con-jugated diene contents show a patt ern similar to that of the free fatt y acids during 35-hour batch frying. Their mass fractions (0.16–0.30 g per 100 g of oil) in the oil sam-ples supplemented with antioxidants were lower than in the control sample (0.40 g per 100 g of oil) at the end of the seventh day of frying. It was also determined that the lycopene extract was more eff ective than the other plant extracts in controlling the free fatt y acid and conjugated Table 1. Free fatt y acid content in control oil and oil supple-mented with antioxidants
t/day w/(g oleic acid/100 g oil)
Control BHA/BHT GTE
0 (0.1±0.0)bC (0.2±0.0)abC (0.1±0.0)bF
1 (0.2±0.1)aC (0.4±0.1)aC (0.4±0.1)aEF
2 (0.4±0.1)aC (0.5±0.1)aC (0.5±0.1)aDEF
3 (0.7±0.2)aC (0.8±0.2)aBC (0.8±0.2)aDE
4 (1.1±0.2)aBC (1.1±0.2)aABC (0.9±0.02)aCD
5 (1.2±0.1)aBC (1.5±0.2)aAB (1.3±0.1)aBC
6 (1.7±0.3)aB (1.7±0.3)aA (1.5±0.1)aAB
7 (2.9±0.1)aA (1.9±0.3)bA (1.9±0.1)bA
t/day LYE RSV PGO
0 (0.3±0.0)aE (0.2±0.0)abE (0.3±0.0)abD
1 (0.4±0.1)aDE (0.3±0.1)aE (0.4±0.1)aCD
2 (0.6±0.1)aDE (0.4±0.1)aDE (0.5±0.1)aCD
3 (0.8±0.1)aCD (0.7±0.2)aCD (0.9±0.1)aBCD
4 (1.0±0.1)aBC (0.9±0.2)aBC (1.0±0.1)aABCD
5 (1.2±0.1)aBC (1.2±0.2)aB (1.3±0.3)aABC
6 (1.5±0.1)aAB (1.3±0.2)aB (1.5±0.1)aAB
7 (1.7±0.2)bA (1.9±0.3)bA (1.9±0.3)bA
All results are mean value±standard error (S.E.)
Mean values followed by diff erent lowercase lett ers in super-script represent signifi cant diff erences among the measured properties (p≤0.05) in the frying groups
Mean values followed by diff erent capital lett ers in superscript represent signifi cant diff erences among the measured properties on a particular frying day (p≤0.05)
BHA/BHT=butylated hydroxyanisole/butylated hydroxytoluene mixture, GTE=green tea extract, LYE=purifi ed lycopene, RSV=purifi ed resveratrol, PGO=purifi ed γ-oryzanol
diene levels. However, there is no legal arrangement re-lated to the upper limit of conjugated diene/triene content of frying oil. A number of researchers indicated that con-jugated diene and triene contents changed with frying time and temperature, oil composition, etc. (6,22,23). Ab-dulkarim et al. (24) reported that conjugated diene con-tent was markedly aff ected by fatt y acid composition of the oil and that diene and triene levels in the oil increased with increasing level of unsaturated fatt y acids.
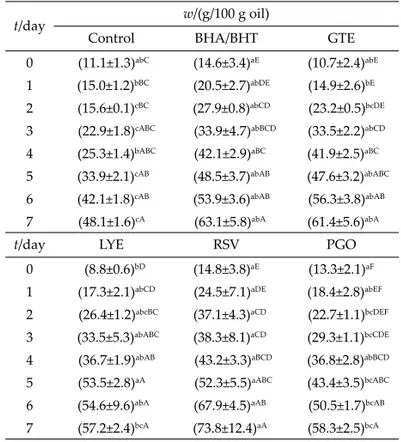
Mass fractions of total polar material
Polar materials are polymerized and oxidized tria-cylglycerol dimers, including a wide class of products of pyro lysis, oxidation, condensation and hydrolysis. The amount of total polar compounds in frying oil is an im-portant factor to measure the oxidative degradation, and to determine the usage life and quality of frying oil. In ad-dition, it aff ects the absorption of fat by fried food prod-ucts. In this study, the total polar material (TPM) values were found to increase steadily in all treatment groups. Interestingly, the oil samples supplemented with natural antioxidant extracts had more TPM (Table 3). The reason for this is possibly due to the natural polar characteristics of the supplemented materials. As observed in Table 3, on the fi rst day of supplementation, which is the day before
the beginning of frying, higher TPM values were measured in the oil with supplements, compared to the control group. Clearly, some compounds with polar characteristics exist in the plant extracts used to enrich the oil, which is con-fi rmed by the data.
The minimum increase of the TPM mass fraction was detected in the oil samples supplemented with lycopene at the end of frying, owing to the nature of lycopene, which is a non-polar compound. Literature reports that frying time and temperature induced the formation of to-tal polar material (5). Lee et al. (25) investigated the eff ect of diff erent mass fractions (5, 15 and 25 %) of spinach powder as a natural antioxidant on soybean oil frying performance. The researchers reported a decrease of con-jugated diene and polar material contents and an increase of the oxidative stability of the oil during 20 h of frying at 160 °C. Kochhar (1) stated that the TPM contents of groundnut oil and palm olein increased with frying time and the oil samples became unusable aft er 20 and 40 h, respectively. According to the Turkish Offi cial Notifi ca-tion of the Control Criteria of Frying Fats/Oils (26), when the TPM content in frying oil exceeds 25 g per 100 g of oil, it should be discarded. In the present study, it was deter-mined that enriched oil samples have higher total polar material content than the control oil sample during frying days. The TPM content of the samples containing green Table 2. Mass fraction of conjugated dienes in control and oil
supplemented with antioxidants
t/day w/(g/100 g oil)
Control BHA/BHT GTE
0 (0.01±0.00)bD (0.01±0.00)bD (0.01±0.00)bD
1 (0.09±0.01)bCD (0.06±0.04)bCD (0.02±0.01)bCD
2 (0.09±0.01)bCD (0.07±0.01)bBCD (0.07±0.03)bBCD
3 (0.12±0.1)abBCD (0.09±0.01)bBCD (0.07±0.01)bBCD
4 (0.15±0.1)abBCD (0.10±0.01)abBCD (0.10±0.01)abABC
5 (0.20±0.1)abBC (0.15±0.02)bBC (0.12±0.01)bAB
6 (0.30±0.2)aAB (0.19±0.02)abAB (0.13±0.01)bAB
7 (0.40±01)aA (0.27±0.02)abA (0.18±0.02)bA
t/day LYE RSV PGO
0 (0.02±0.01)bC (0.02±0.01)bC (0.11±0.04)aC 1 (0.03±0.01)bC (0.04±0.01)bC (0.14±0.01)aBC 2 (0.05±0.02)bBC (0.11±0.03)abBC (0.17±0.001)aBC 3 (0.07±0.04)bBC (0.12±0.02)abBC (0.18±0.03)aBC 4 (0.07±0.02)bBC (0.19±0.03)abAB (0.22±0.04)aAB 5 (0.11±0.02)bB (0.19±0.04)abAB (0.24±0.05)aAB
6 (0.12±0.02)bAB (0.20±0.06)abAB (0.25±0.06)abAB
7 (0.16±0.03)bA (0.27±0.06) abA (0.30±0.07)abA
All results are mean value±standard error (S.E.)
Mean values followed by diff erent lowercase lett ers in super-script represent signifi cant diff erences among the measured properties (p≤0.05) in the frying groups
Mean values followed by diff erent capital lett ers in superscript represent signifi cant diff erences among the measured properties on a particular frying day (p≤0.05)
BHA/BHT=butylated hydroxyanisole/butylated hydroxytoluene mixture, GTE=green tea extract, LYE=purifi ed lycopene, RSV=purifi ed resveratrol, PGO=purifi ed γ-oryzanol
Table 3. Content of total polar material in control and oil sup-plemented with antioxidants
t/day w/(g/100 g oil)
Control BHA/BHT GTE
0 (11.1±1.3)abC (14.6±3.4)aE (10.7±2.4)abE
1 (15.0±1.2)bBC (20.5±2.7)abDE (14.9±2.6)bE
2 (15.6±0.1)cBC (27.9±0.8)abCD (23.2±0.5)bcDE
3 (22.9±1.8)cABC (33.9±4.7)abBCD (33.5±2.2)abCD
4 (25.3±1.4)bABC (42.1±2.9)aBC (41.9±2.5)aBC
5 (33.9±2.1)cAB (48.5±3.7)abAB (47.6±3.2)abABC
6 (42.1±1.8)cAB (53.9±3.6)abAB (56.3±3.8)abAB
7 (48.1±1.6)cA (63.1±5.8)abA (61.4±5.6)abA
t/day LYE RSV PGO
0 (8.8±0.6)bD (14.8±3.8)aE (13.3±2.1)aF
1 (17.3±2.1)abCD (24.5±7.1)aDE (18.4±2.8)abEF
2 (26.4±1.2)abcBC (37.1±4.3)aCD (22.7±1.1)bcDEF
3 (33.5±5.3)abABC (38.3±8.1)aCD (29.3±1.1)bcCDE
4 (36.7±1.9)abAB (43.2±3.3)aBCD (36.8±2.8)abBCD
5 (53.5±2.8)aA (52.3±5.5)aABC (43.4±3.5)bcABC
6 (54.6±9.6)abA (67.9±4.5)aAB (50.5±1.7)bcAB
7 (57.2±2.4)bcA (73.8±12.4)aA (58.3±2.5)bcA
All results are mean value±standard error (S.E.)
Mean values followed by diff erent lowercase lett ers in super-script represent signifi cant diff erences among the measured properties (p≤0.05) in the frying groups
Mean values followed by diff erent capital lett ers in superscript represent signifi cant diff erences among the measured properties on a particular frying day (p≤0.05)
BHA/BHT=butylated hydroxyanisole/butylated hydroxytoluene mixture, GTE=green tea extract, LYE=purifi ed lycopene, RSV=purifi ed resveratrol, PGO=purifi ed γ-oryzanol
tea extract and purifi ed γ-oryzanol exceeded the legal limit aft er the second day of frying (Table 3). Since the added extracts are chemically polar in their nature, the in-crease in TPM might be due to the added compounds, and not the consequence of lipid oxidation.
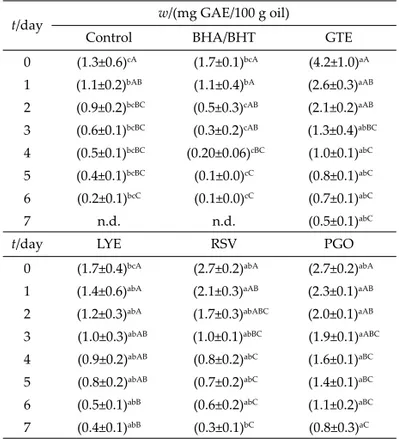
Total phenolic content
The green tea extract contained (in g): epigallocate-chin gallate 7.410, epigallocateepigallocate-chin 3.841, epicateepigallocate-chin gal-late 1.224, epicatechin 0.721, catechin 0.036, caff eine 1.704, theafl avin 0.003, theafl avin digallate 0.002, theafl avin 3-monogallate 0.002, theafl avin 3-monogallate 0.004, gal-lic acid 0.026 per 100 g of dry tea leaves. These results are in agreement with the literature values (27,28).
The total phenolic contents of the frying oil samples are shown in Table 4. Addition of the natural extracts caused a distinctive and statistically signifi cant (p≤0.05) increase in the total phenolic values of the oil samples. The total phenolic content of oil samples decreased at the end of the seventh day of frying in the following order: purifi ed γ-oryzanol>green tea extract>purifi ed lycopene> purifi ed resveratrol, even though it could not be detected in the control and in the samples with added synthetic antioxidants. This variation may be due to the diff erent
solubility (polarity) and stability characteristics of the added extracts. The recovery rates of phenolics from sup-plemented oil samples at the end of the seventh day of frying were calculated as follows (in %): green tea extract 13.1, lycopene 25.9, resveratrol 13.4 and purifi ed γ -oryza-nol 30. The ability of sesame extracts to enhance the oxi-dative stability of common consumption vegetable oil un-der thermal conditions was examined by Konsoula and Liakopoulou-Kyriakides (29). The researchers notifi ed that sesame seed extract plays an important role in the en-hancement of the total phenolic content and antioxidant capacity, as well as in the reduction of peroxide forma-tion.
Antioxidant capacity of supplemented oil
Before frying, the oil samples in all frying groups ex-cept control group were supplemented with the antioxi-dants. The addition levels of these antioxidants (Table 5) were determined based on TEAC value (313.77 mM of TEAC) of the mixture of synthetic antioxidants (BHA/ BHT=1:1, by mass) at 300 mg per 1500 g of oil. It was ob-served that antioxidant capacity values measured in the oil samples on the day zero (before the beginning of fry-ing) were diff erent from each other and this diff erence was statistically signifi cant, although they were supple-mented with equivalent amount of synthetic and natural antioxidants. The diff erence of the antioxidant capacity values on day zero can be explained by the following rea-sons: fi rstly, all antioxidant capacities were measured in the samples with phenolic extracts obtained from peanut oil samples instead of synthetic and natural antioxidant extracts. It must be kept in mind that the added extracts must have diff erent solubility characteristics when added to the oil. Furthermore, all antioxidants must have diff er-ent dissolution in oil, hence diff erent recovery rate by the extraction protocol was applied. This can also explain why their addition caused diff erent chemical reactions that prevent the oxidation of the oil during frying. In ad-dition, it is believed that the recovery rate and the extrac-tion condiextrac-tions may aff ect the antioxidant capacity of pea-nut oil.
Table 4. Total phenolic content in control and oil supplemented with antioxidants
t/day w/(mg GAE/100 g oil)
Control BHA/BHT GTE
0 (1.3±0.6)cA (1.7±0.1)bcA (4.2±1.0)aA 1 (1.1±0.2)bAB (1.1±0.4)bA (2.6±0.3)aAB 2 (0.9±0.2)bcBC (0.5±0.3)cAB (2.1±0.2)aAB 3 (0.6±0.1)bcBC (0.3±0.2)cAB (1.3±0.4)abBC 4 (0.5±0.1)bcBC (0.20±0.06)cBC (1.0±0.1)abC 5 (0.4±0.1)bcBC (0.1±0.0)cC (0.8±0.1)abC 6 (0.2±0.1)bcC (0.1±0.0)cC (0.7±0.1)abC 7 n.d. n.d. (0.5±0.1)abC
t/day LYE RSV PGO
0 (1.7±0.4)bcA (2.7±0.2)abA (2.7±0.2)abA
1 (1.4±0.6)abA (2.1±0.3)aAB (2.3±0.1)aAB
2 (1.2±0.3)abA (1.7±0.3)abABC (2.0±0.1)aAB
3 (1.0±0.3)abAB (1.0±0.1)abBC (1.9±0.1)aABC
4 (0.9±0.2)abAB (0.8±0.2)abC (1.6±0.1)aBC
5 (0.8±0.2)abAB (0.7±0.2)abC (1.4±0.1)aBC
6 (0.5±0.1)abB (0.6±0.2)abC (1.1±0.2)aBC
7 (0.4±0.1)abB (0.3±0.1)bC (0.8±0.3)aC
All results are mean value±standard error (S.E.)
Mean values followed by diff erent lowercase lett ers in super-script represent signifi cant diff erences among the measured properties (p≤0.05) in the frying groups
Mean values followed by diff erent capital lett ers in superscript represent signifi cant diff erences among the measured properties on a particular frying day (p≤0.05)
BHA/BHT=butylated hydroxyanisole/butylated hydroxytoluene mixture, GTE=green tea extract, LYE=purifi ed lycopene, RSV=purifi ed resveratrol, PGO=purifi ed γ-oryzanol, n.d.=not detected
Table 5. The antioxidant capacity and mass of synthetic and natural antioxidants added to oil samples
Antioxidant capacity mM TEAC/g extract m/g (equivalent to 313.77 mM TEAC) BHA/BHT (1:1 by mass) (1045.9±11.2) C 0.30C GTE (1442.2±11.6)B 0.21D LYE (76.3±4.7)D 4.10B RSV (6251.9±14.6)A 0.05E PGO (72.6±3.9)D 4.32A
All results are mean value±standard error (S.E.) Mean values followed by diff erent lett ers in superscript represent signifi cant diff erences among all measured properties (p≤0.05) in the synthetic and natural antioxidant extracts BHA/BHT=butylated hydroxyanisole/butylated hydroxytoluene mixture, GTE=green tea extract, LYE=purifi ed lycopene, RSV=purifi ed resveratrol, PGO=purifi ed γ-oryzanol
Generally, the antioxidant capacity of the oil samples decreased with the increase of frying time (Table 6). Even though the oil samples containing synthetic antioxidants and the control group exhibited similar results, no anti-oxidant activity was detected in both groups aft er the fift h frying day. It is obvious that γ-oryzanol, which has high thermal stability, is the most effi cient antioxidant in frying oil. There was statistically signifi cant diff erence between the oil samples supplemented with γ-oryzanol and other natural antioxidants at the end of the seventh day of fry-ing. Although green tea extract and resveratrol had high-er antioxidant capacity than the othhigh-er extracts in fresh oil, they had lower remaining antioxidant activity than puri-fi ed γ-oryzanol and lycopene at the end of frying (Table 6). It was demonstrated that extracts have diff erent solu-bility and polarity characteristics in oil or water media. Ananingsih et al. (30) reported that catechins present in tea prevent oxidation in lipophilic and emulsion media. In the present study, the highest antioxidant capacity at the end of frying was detected in the oil with purifi ed γ-oryzanol (1.4 mM of TEAC per 100 g of oil) followed by the samples with green tea extract, lycopene and resvera-trol extracts (Table 6).
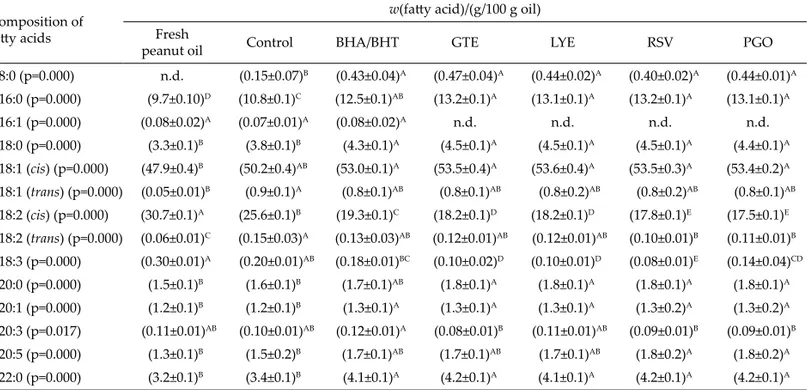
Fa
tt
y acid composition of the oil
Distinct diff erences in fatt y acid composition were detected between the control group and experimental groups supplemented with antioxidants (Table 7). It was found that palmitic acid (C16:0) content increased a litt le during frying, which was confi rmed by other researchers (3,31). In addition, stearic (C18:0), arachidic (C20:0) and behenic (C22:0) acid mass fractions were relatively higher in the oil containing antioxidants than in the control oil. As it was indicated, loss of polyunsaturated fatt y acids during frying was mainly due to oxidation (4). As can be seen in Table 7, oil supplemented with antioxidants had higher content of oleic (C18:1) than linoleic (C18:2) acid. This increase observed in oleic acid could be a rela-tive increase as a result of the loss of linoleic acid. Frying oil and fried food products can be a source of trans-fatt y acids in the daily diet. The formation of trans-fatt y acids increased together with the increase in frying time and temperature (32,33). In this study, generally trans-fatt y acid content of all samples on the seventh day of frying was higher than that of fresh oil. Formation of trans-fatt y acids (g per 100 g of oil) was the highest in the control group. In addition, statistically signifi cant (p≤0.05) de-crease in the levels of linoleic and linolenic (C18:3) acids during frying was observed.
Sterol composition of oil samples
Phytosterols are triterpene compounds and also mi-nor components in vegetable oil. They lose their biologi-cal activity and become oxidized when exposed to air at high temperatures. Phytosterols that contain ethyldiene group at the side chain are capable of delaying polymer-ization at frying temperatures. In addition, high tempera-ture can lead to the degradation of sterols. Researchers reported campesterol and β-sitosterol losses of 32 and 94 %, and 33 and 95 % at 100 and 150 °C, respectively. Inter-estingly, they observed that the losses at 180 °C were low-er than at 150 °C (34,35).In our previous study (36), the eff ect of phytostanol mixture addition (5, 10, 15 and 20g per 100 g of oil) into canola oil during frying (180 °C, 25 h) was investigated. The results indicated that sensory qual-ity of the fried dough was bett er when using oil with 5 % phytostanol; however, samples with added 10 % phyto-stanol had higher contents of free fatt y acids and conju-gated dienes. It was shown (Table 8) that there was sig-nifi cant decrease in the sterol content during frying (compared with the fresh oil) but the highest sterol con-tent was found in the sample containing purifi ed γ-oryzanol, indicating protective eff ect of antioxidants. At the end of frying, there were statistically signifi cant dif-ferences (p≤0.05) between the total sterol content of the oil samples supplemented with antioxidants.
Sensory evaluation
All the sensory characteristics (appearance, texture, taste/fl avour and odour/aroma) of fried dough evaluated in this study (Table 9) were statistically signifi cantly dif-ferent (p≤0.05) among the experimental groups. It is obvi-ous that fried dough in control group and in oil samples supplemented with antioxidants had diff erent scores for appearance and texture. The amount of oil absorbed by fried dough changed between 3.6 and 9.9 g per 100 g of Table 6. Antioxidant capacity of phenolic extracts in oil samples
supplemented with antioxidants
t/day Antioxidant capacity/(mM TEAC/100 g oil)
Control BHA/BHT GTE
0 (3.1±0.1)cA (3.2±0.1)cA (11.0±0.5)aA 1 (1.8±0.1)cB (2.2±0.1)cB (5.5±1.0)abB 2 (1.2±0.1)cBC (1.3±0.2)cBC (3.2±0.4)aBC 3 (0.8±0.1)cCD (0.8±0.1)cCD (2.1±0.3)aC 4 (0.5±0.1)bD (0.7±0.1)cCD (1.9±0.2)aC 5 n.d. (0.5±0.1)bD (1.2±0.1)abD 6 n.d. n.d. (1.1±0.1)bD 7 n.d. n.d. (0.9±0.1)bD
t/day LYE RSV PGO
0 (5.8±0.5)bcA (9.2±0.6)bA (8.7±0.4)bA
1 (4.6±1.6)abAB (3.7±0.2)bcB (6.3±1.6)aAB
2 (2.5±0.5)abBC (2.1±0.3)abBC (3.2±0.5)aBC
3 (1.8±0.5)abBC (1.5±0.1)abCD (2.4±0.3)aC
4 (1.5±0.2)abBC (1.2±0.1)abCD (1.8±0.2)aCD
5 (1.1±0.2)abC (1.0±0.2)bD (1.8±0.1)aCD
6 (1.0±0.1)bC (0.9±0.1)bD (1.7±0.1)aCD
7 (0.9±0.1)bC (0.7±0.1)bD (1.4±0.1)aD
All results are mean value±standard error (S.E.)
Mean values followed by diff erent lowercase lett ers in super-script represent signifi cant diff erences among the measured properties (p≤0.05) in the frying groups
Mean values followed by diff erent capital lett ers in superscript represent signifi cant diff erences among the measured properties on a particular frying day (p≤0.05)
BHA/BHT=butylated hydroxyanisole/butylated hydroxytoluene mixture, GTE=green tea extract, LYE=purifi ed lycopene, RSV=purifi ed resveratrol, PGO=purifi ed γ-oryzanol, n.d.=not detected
Table 8. The sterol composition of the fresh peanut oil and oil samples supplemented with antioxidants obtained on the seventh day of frying
Composition of sterols w/(mg/100 g oil)
Fresh peanut oil GTE LYE RSV PGO
Campesterol (p=0.000) (16.3±0.1)A (2.8±0.1)B (2.1±0.1)BC (1.5±0.1)C (2.4±0.1)BC Stigmasterol (p=0.008) (7.4±0.1)A (1.0±0.1)B (0.7±0.1)C (0.5±0.1)D (0.7±0.1)C β-Sitosterol (p=0.004) (67.6±0.1)A (8.3±0.1)B (7.1±0.1)D (7.8±0.1)C (7.2±0.1)D Sitostanol (p=0.000) (1.3±0.1)A (0.2±0.1)E (0.7±0.1)B (0.4±0.1)D (0.5±0.1)C Δ-7-Avenasterol (p=0.000) (1.9±0.1)A (0.2±0.1)C (0.2±0.1)C (0.2±0.1)C (1.4±0.1)B Δ-5,24-Stigmastadienol (p=0.000) (0.8±0.1)C (0.1±0.0)D (0.1±0.0)D (0.9±0.1)B (1.7±0.1)A Total sterol (95.3±0.6)A (12.6±0.5)BC (10.9±0.5)C (11.3±0.6)C (13.9±0.6)B
All results are mean value±standard deviation (S.D.). Mean values followed by diff erent capital lett ers in superscript represent signifi cant diff erences among the measured properties (p≤0.05) in the frying groups. GTE=green tea extract, LYE=purifi ed lycopene, RSV=purifi ed resveratrol, PGO=purifi ed γ-oryzanol
Table 9. Sensory data collected for the fried dough at the end of the fourth, fift h and sixth frying day by the hedonic scale
Oil sample Appearance (p=0.001) Texture (p=0.001) Taste/fl avour (p=0.001) Odour/aroma (p=0.001)
Control (3.1±0.1)A (2.9±0.1)A (2.5±0.1)B (2.7±0.1)BC
Supplemented with BHA/BHT (2.6±0.1)C (2.0±0.9)B (2.3±0.1)C (2.9±0.4)AB
Supplemented with GTE (3.0±0.1)A (2.0±0.1)B (2.4±0.1)BC (2.5±0.1)C
Supplemented with LYE (2.9±0.1)AB (1.9±0.1)C (2.4±0.1)BC (2.6±0.1)C
Supplemented with RSV (2.8±0.1)BC (2.4±0.1)AB (2.5±0.1)B (2.7±0.1)BC
Supplemented with PGO (3.6±0.1)A (2.9±0.1)A (3.0±0.1)A (3.1±0.1)A
All results are mean value±standard deviation (S.D.). Mean values followed by diff erent capital lett ers in superscript represent signifi cant diff erences among the measured properties (p≤0.05) in the frying groups. The mean scores of sensory att ributes collected by the hedonic scale (N=100 subjects) were calculated: 1=dislike extremely, 2=dislike moderately, 3=neither like nor dislike, 4=like moderately and 5=like extremely. BHA/BHT=butylated hydroxyanisole/butylated hydroxytoluene mixture, GTE=green tea extract, LYE=purifi ed lycopene, RSV=purifi ed resveratrol, PGO=purifi ed γ-oryzanol
Table 7. The fatt y acid composition of the fresh peanut oil, control oil and oil samples supplemented with antioxidants obtained on the seventh day of frying
Composition of fatt y acids
w(fatt y acid)/(g/100 g oil) Fresh
peanut oil Control BHA/BHT GTE LYE RSV PGO
C8:0 (p=0.000) n.d. (0.15±0.07)B (0.43±0.04)A (0.47±0.04)A (0.44±0.02)A (0.40±0.02)A (0.44±0.01)A C16:0 (p=0.000) (9.7±0.10)D (10.8±0.1)C (12.5±0.1)AB (13.2±0.1)A (13.1±0.1)A (13.2±0.1)A (13.1±0.1)A C16:1 (p=0.000) (0.08±0.02)A (0.07±0.01)A (0.08±0.02)A n.d. n.d. n.d. n.d. C18:0 (p=0.000) (3.3±0.1)B (3.8±0.1)B (4.3±0.1)A (4.5±0.1)A (4.5±0.1)A (4.5±0.1)A (4.4±0.1)A C18:1 (cis) (p=0.000) (47.9±0.4)B (50.2±0.4)AB (53.0±0.1)A (53.5±0.4)A (53.6±0.4)A (53.5±0.3)A (53.4±0.2)A C18:1 (trans) (p=0.000) (0.05±0.01)B (0.9±0.1)A (0.8±0.1)AB (0.8±0.1)AB (0.8±0.2)AB (0.8±0.2)AB (0.8±0.1)AB C18:2 (cis) (p=0.000) (30.7±0.1)A (25.6±0.1)B (19.3±0.1)C (18.2±0.1)D (18.2±0.1)D (17.8±0.1)E (17.5±0.1)E C18:2 (trans) (p=0.000) (0.06±0.01)C (0.15±0.03)A (0.13±0.03)AB (0.12±0.01)AB (0.12±0.01)AB (0.10±0.01)B (0.11±0.01)B C18:3 (p=0.000) (0.30±0.01)A (0.20±0.01)AB (0.18±0.01)BC (0.10±0.02)D (0.10±0.01)D (0.08±0.01)E (0.14±0.04)CD C20:0 (p=0.000) (1.5±0.1)B (1.6±0.1)B (1.7±0.1)AB (1.8±0.1)A (1.8±0.1)A (1.8±0.1)A (1.8±0.1)A C20:1 (p=0.000) (1.2±0.1)B (1.2±0.1)B (1.3±0.1)A (1.3±0.1)A (1.3±0.1)A (1.3±0.2)A (1.3±0.2)A C20:3 (p=0.017) (0.11±0.01)AB (0.10±0.01)AB (0.12±0.01)A (0.08±0.01)B (0.11±0.01)AB (0.09±0.01)B (0.09±0.01)B C20:5 (p=0.000) (1.3±0.1)B (1.5±0.2)B (1.7±0.1)AB (1.7±0.1)AB (1.7±0.1)AB (1.8±0.2)A (1.8±0.2)A C22:0 (p=0.000) (3.2±0.1)B (3.4±0.1)B (4.1±0.1)A (4.2±0.1)A (4.1±0.1)A (4.2±0.1)A (4.2±0.1)A
All results are mean value±standard deviation (S.D.). Mean values followed by diff erent capital lett ers in superscript represent signifi cant diff erences among the measured properties (p≤0.05) in the frying groups. BHA/BHT=butylated hydroxyanisole/butylated hydroxytoluene mixture, GTE=green tea extract, LYE=purifi ed lycopene, RSV=purifi ed resveratrol, PGO=purifi ed γ-oryzanol, n.d.=not detected
oil (data not shown); moreover, synthetic and natural an-tioxidant supplementation did not have signifi cant eff ect on the amount of fat absorbed by the fried dough. Suárez et al. (37) investigated the sensory characteristics of coated and uncoated fried dough at selected time and tempera-ture conditions. The optimum frying conditions were de-termined to be 160 °C for 12 min, and there were no dif-ferences in sensory properties (colour, fl avour, texture and overall appearance) among all dough samples. In the present study, the results revealed that the dough fried in oil supplemented with natural antioxidants generally had higher sensory scores than the dough fried in oil contain-ing synthetic antioxidants, except for texture and odour/ aroma properties (Table 9). Hence, it is concluded that the addition of natural antioxidant extracts to frying oil can produce more acceptable products compared to the con-trol group.
Conclusion
Frying oil supplemented with 0.05 to 4.32 g of plant phenolic extracts exhibited preventive eff ects against thermo-oxidative degradation and provided desired sen-sory characteristics to the fried dough. Especially purifi ed γ-oryzanol extract yielded much bett er results. Public health considerations are urging the use of more natural food and food additives. Hence, natural antioxidants can successfully replace synthetic additives in frying oil. Since natural antioxidants gave bett er protection to oil under the investigated frying conditions than the control (oil without antioxidants) and oil containing synthetic anti-oxidants, the mechanism responsible for the benefi cial ef-fects of the natural antioxidants may be elucidated with further studies.
Acknowledgements
This study was funded by the Scientifi c Research Projects Offi ce of Çanakkale Onsekiz Mart University, Çanakkale,Turkey (Project no: BAP-2010/153). The au-thors are grateful to Helvacızade Food Pharma & Chemi-cals (Konya, Turkey) for the refi ned peanut oil gift for this study. All authors declare no confl ict of interest and alone are responsible for the content and writing of this article.
References
1. Kochhar SP. The composition of frying oils. In: Rossell JB, editor. Frying improving quality. Boca Raton, USA: CRC Press; 2001. pp. 87–114.
2. Blumenthal MM. A new look at the chemistry and physics of deep-fat frying. Food Tech. 1991;45:68–71.
3. Romero A, Cuesta C, Sánchez-Muniz FJ. Eff ect of oil replen-ishment during deep-fat frying of frozen foods in sunfl ower oil and high-oleic acid sunfl ower oil. J Am Oil Chem Soc. 1998;75:161–7.
htt p://dx.doi.org/10.1007/s11746-998-0028-5
4. Choe E, Min DB. Chemistry of deep-fat frying oils. J Food Sci. 2007;72:77–84.
htt p://dx.doi.org/10.1111/j.1750-3841.2007.00352.x
5. Aladedunye FA, Przybylski R. Protection of oil during fry-ing: a comparative study. Eur J Lipid Sci Tech. 2009;111:893– 901.
htt p://dx.doi.org/10.1002/ejlt.200900020
6. Aydeniz B, Yılmaz E. Enrichment of frying oils with plant phenolic extracts to extend the usage life. Eur J Lipid Sci Tech. 2012;114:933–41.
htt p://dx.doi.org/10.1002/ejlt.201100228
7. Rababah TM, Feng H, Yang W, Yücel S. Fortifi cation of pota-to chips with natural plant extracts pota-to enhance their sensory properties and storage stability. J Am Oil Chem Soc. 2012;89:1419–25.
htt p://dx.doi.org/10.1007/s11746-012-2037-7
8. Koh SP, Arifi n N, Tan CP, Yusoff MSA, Long K, Lai OM. Deep frying performance of enzymatically synthesized palm-based medium- and long-chain triacylglycerols (MLCT) oil blends. Food Bioprocess Tech. 2008;4:124–35. htt p://dx.doi.org/10.1007/s11947-008-0138-y
9. Sanders TH. Groundnut (peanut) oil. In: Gunstone FD, edi-tor. Vegetable oils in food technology: composition, proper-ties and uses. Hoboken, NY, USA: Wiley Blackwell; 2002. pp. 231–2.
10. Perva-Uzunalic A, Skerget M, Knez Z, Weinreich B, Ott o F, Grüner S. Extraction of active ingredients from green tea (Camellia sinensis): Extraction effi ciency of major catechins and caff eine. Food Chem. 2006;96:597–605.
htt p://dx.doi.org/10.1016/j.foodchem.2005.03.015
11. ISO 14502-2:2005. Determination of substances characteristic of green and black tea – Part 2: Content of catechins in green tea method using high-performance liquid chromatography. Geneva, Switzerland: International Organization for Stan-dardization (ISO); 2006.
12. Chotimarkorn C, Benjakul S, Silalai N. Antioxidative eff ects of rice bran extracts on refi ned tuna oil during storage. Food Res Int. 2008;41:616–22.
htt p://dx.doi.org/10.1016/j.foodres.2008.04.002
13. Re R, Pellegrini N, Proteggente A, Pannala A, Yang M, Rice-Evans C. Antioxidant activity applying an improved ABTS radical cation decolorization assay. Free Radical Biol Med. 1999;26:1231–7.
htt p://dx.doi.org/10.1016/S0891-5849(98)00315-3
14. AOCS Offi cial Method Ca 5a-40. Free fatt y acids. In: Fire-stone D, editor. Offi cial Methods and Recommended Prac-tices of the American Oil Chemists’ Society (AOCS). Cham-paign, IL, USA: AOCS Press; 1998.
15. AOCS Offi cial Method Ti 1a-64. Spectrophotometric deter-mination of conjugated dienoic acid. In: Firestone D, editor. Offi cial Methods and Recommended Practices of the Ameri-can Oil Chemists’ Society (AOCS). Champaign, IL, USA: AOCS Press; 1998.
16. AOCS Offi cial Method Cd 20-91. Determination of polar compounds in frying fats. In: Firestone D. editor. Offi cial Methods and Recommended Practices of the American Oil Chemists’ Society (AOCS). Champaign, IL, USA: AOCS Press; 1998.
17. AOCS Offi cial Method Ce 2-66. Preparation of methyl esters of long-chain fatt y acids from sampling and analysis of com-mercial fats and oils. In: Firestone D, editor. Offi cial Methods and Recommended Practices of the American Oil Chemists’ Society (AOCS). Champaign, IL, USA: AOCS Press; 1998.
18. AOCS method Ce 1-62. Fatt y acid analysis by gas chromato-graph. In: Firestone D, editor. Offi cial Methods and Recom-mended Practices of the American Oil Chemists’ Society (AOCS). Champaign, IL, USA: AOCS Press; 1998.
19. ISO 12228:1999. Animal and vegetable fats and oils – Deter-mination of individual and total sterols contents – gas chro-matographic method. Geneva, Switzerland: International Organization for Standardization (ISO); 1999.
20. ISO 6658:2005. Sensory analysis – Methodology – General guidance. Geneva, Switzerland: International Organization for Standardization (ISO); 2005.
21. MINITAB (Minitab Statistical Soft ware System), v. 16.1.1. Minitab Inc., State College, PA, USA; 2010. Available from: htt p://www.minitab.com.
22. Lolos M, Oreopoulou V, Tzia C. Oxidative stability of potato chips: eff ect of frying oil type, temperature and antioxidants. J Sci Food Agr. 1999;79:1524–8.
htt p://dx.doi.org/10.1002/(SICI)1097-0010(199908)79:11<1524: :AID-JSFA401>3.0.CO;2-H
23. Smith SA, King RE, Min DB. Oxidative and thermal stabili-ties of genetically modifi ed high oleic sunfl ower oil. Food Chem. 2007;102:1208–13.
htt p://dx.doi.org/10.1016/j.foodchem.2006.06.058
24. Abdulkarim SM, Long K, Lai OM, Muhammad SKS, Ghazali HM. Frying quality and stability of high-oleic Moringa oleif-era seed oil in comparison with other vegetable oils. Food Chem. 2007;105:1382–9.
htt p://dx.doi.org/10.1016/j.foodchem.2007.05.013
25. Lee J, Lee S, Lee H, Park K, Choe E. Spinach (Spinacia olera-cea) powder as a natural food-grade antioxidant in deep-fat-fried products. J Agric Food Chem. 2002;50:5664–9.
htt p://dx.doi.org/10.1021/jf011618a
26. Turkish Food Codex No: 2007/41. Offi cial notifi cation of the control criteria of frying Fats/Oils. Ankara, Turkey: Turkish Food Codex; 2007.
27. Chen ZY, Xhu QY, Tsang D, Huang Y. Degradation of green tea catechins in tea drinks. J Agric Food Chem. 2001;49:477–82. htt p://dx.doi.org/10.1021/jf000877h
28. Rusak G, Komes D, Likić S, Horžić D, Kovač M. Phenolic content and antioxidative capacity of green and white tea ex-tracts depending on extraction conditions and the solvent used. Food Chem. 2008;110:852–8.
htt p://dx.doi.org/10.1016/j.foodchem.2008.02.072
29. Konsoula Z, Liakopoulou-Kyriakides M. Eff ect of endoge-nous antioxidants of sesame seeds and sesame oil to the thermal stability of edible vegetable oils. LWT – Food Sci Technol. 2010;43:1379–86.
htt p://dx.doi.org/10.1016/j.lwt.2010.04.016
30. Ananingsih VK, Sharma A, Zhou W. Green tea catechins during food processing and storage: A review on stability and detection. Food Res Int. 2013;50:469–79.
htt p://dx.doi.org/10.1016/j.foodres.2011.03.004
31. Sebedio JL, Bonpunt A, Grandgirard A, Prevost J. Deep fat frying of frozen prefried french fries: Infl uence of the amount of linolenic acid in the frying medium. J Agric Food Chem. 1990;38:1862–7.
htt p://dx.doi.org/10.1021/jf00099a017
32. Ovesen L, Leth T, Hansen K. Fatt y acid composition and contents of trans monounsaturated fatt y acids in frying fats, and in margarines and shortenings marketed in Denmark. J Am Oil Chem Soc. 1998;75:1079–83.
htt p://dx.doi.org/10.1007/s11746-998-0116-6
33. van Poppel G, van Erp-Baart MA, Leth T, Gevers E, Van Amelsvoort J, Lanzmann-Petithory D, et al. Trans fatt y acids in foods in Europe: the transfair study. J Food Compos Anal. 1998;11:112–36.
htt p://dx.doi.org/10.1006/jfca.1998.0568
34. Oehrl LL, Hansen AP, Rohrer CA, Fener GP, Boyd LC. Oxi-dation of phytosterols in a test food system. J Am Oil Chem Soc. 2001;78:1073–8.
htt p://dx.doi.org/10.1007/s11746-001-0391-z
35. Lampi AM, Juntunen L, Toivo J, Piironen V. Determination of thermo-oxidation products of plant sterols. J Chromatogr B. 2002;777:83–92.
htt p://dx.doi.org/10.1016/S1570-0232(02)00094-6
36. Aydeniz B, Yılmaz E. Phytostanol supplementation through frying dough in enriched canola oil. J Am Oil Chem Soc. 2013;90:687–94.
htt p://dx.doi.org/10.1007/s11746-012-2201-0
37. Suárez RB, Campañone LA, García MA, Zaritzky NE. Com-parison of the deep frying process in coated and uncoated dough systems. J Food Eng. 2008;84:383–93.