Produk Domestik Regional Bruto Kabupaten Semarang Menurut Lapangan Usaha
i
PRODUK DOMESTIK REGIONAL BRUTO
MENURUT LAPANGAN USAHA
KABUPATEN SEMARANG TAHUN 2013
GROSS REGIONAL DOMESTIC PRODUCT
BY INDUSTRIAL ORIGIN
OF SEMARANG REGENCY 2013
ii
Produk Domestik Regional Bruto Kabupaten Semarang Menurut Lapangan UsahaPRODUK DOMESTIK REGIONAL BRUTO MENURUT
LAPANGAN USAHA KABUPATEN SEMARANG TAHUN 2013
Gross Regional Domestic Product By Industrial Origin of Semarang Regency Year 2013
No. Katalog/ Catalog Number : 9302003.3322A No. Publikasi/ Publication Number : 33225.13.01 Ukuran Buku/ Book Size : 5,83 inci x 8,27 inci Jumlah Halaman/ Total Pages : 78 halaman / pages
Naskah/ Manuscript :
Seksi Neraca Wilayah dan Analisis Statistik
Region Account and Analysis Statistic Section
Gambar Kulit/ Cover Design :
Seksi Neraca Wilayah dan Analisis Statistik
Region Account and Analysis Statistic Section
Diterbitkan oleh/ Published by :
Badan Pusat Statistik Kabupaten Semarang dan Pemerintah Kabupaten Semarang
BPS – Statistics of Semarang Regency and Goverment of Semarang Regency
Boleh dikutip dengan menyebutkan sumbernya
May be cited with reference to the source
Penyusun : Lucky Kurniati Editor : E. Novaja Martha A.
Produk Domestik Regional Bruto Kabupaten Semarang Menurut Lapangan Usaha
iii
SAMBUTAN
Puji syukur kami panjatkan kehadirat Tuhan Yang Maha Esa, atas limpahan berkah dan rahmat-Nya sehingga Buku Produk Domestik Regional Bruto (PDRB) Tahun 2013 ini dapat diselesaikan.
Penyusunan buku ini terutama bertujuan untuk mengukur sejauh mana hasil-hasil pembangunan daerah secara luas dan nyata serta mampu meningkatkan pertumbuhan ekonomi daerah sekaligus sebagai bahan untuk mengevaluasi pelaksanaan pembangunan dalam satu tahun dan untuk perencanaan pembangunan tahun mendatang.
Buku Produk Domestik Regional Bruto (PDRB) Tahun 2013 ini disusun atas kerjasama antara Badan Perencanaan Pembangunan Daerah Kabupaten Semarang dengan Badan Pusat Statistik Kabupaten Semarang. Kami mengucapkan terima kasih kepada semua pihak yang telah membantu dalam menyusun buku ini sehingga dapat dipublikasikan. Semoga buku ini bermanfaat bagi penyelenggaraan pemerintahan, pelayanan masyarakat, dan peningkatan keberhasilan pembangunan daerah ke depan.
Kami sadar bahwa publikasi ini masih banyak kekurangan dan kesalahan, maka segala kritik dan saran untuk perbaikan dan penyempurnaan publikasi berikutnya sangat kami harapkan.
Ungaran, Oktober 2013 BAPPEDA Kabupaten Semarang
Kepala,
Drs. GUNAWAN WIBISONO, MM Pembina Utama Muda
iv
Produk Domestik Regional Bruto Kabupaten Semarang Menurut Lapangan UsahaGREETING
The sustainable and continuous regional development as an integral part of national development is the commitment of Semarang Regency Government. The aim of Semarang Regency Development is to create the economic growth that geared towards improving the whole of Semarang Regency society welfare.
Gross Regional Domestic Product 2013 book is compiled to measure the result of regional development that realistic increasing the regional economic growth.This book also can be one of indicators to assess the success grade of regional development annually, to evaluate the development in one year and to plan next year.
As this book published, we would like to convey our thanks to all side that have enrollment of this book compiled. Hopefully, this book will be useful to Government, Public Service and Regional Development achievement increasing.
Ungaran, Oktober 2013
Head of Regional Development Planning Board Semarang Regency,
Drs. GUNAWAN WIBISONO, MM Pembina Utama Muda NIP. 19610401 198503 1 018
Produk Domestik Regional Bruto Kabupaten Semarang Menurut Lapangan Usaha
v
KATA PENGANTAR
Berkat rahmat Tuhan Yang Maha Esa, publikasi Buku Produk Domestik Regional Bruto Kabupaten Semarang Tahun 2013 dapat terselesaikan. Adapun tahun ini publikasi tersebut terbit dalam dua buku dengan judul “PDRB Kabupaten Semarang menurut Lapangan Usaha” dan “PDRB Kabupaten Semarang menurut Kecamatan”. Dalam publikasi ini disajikan gambaran secara makro maupun mikro tentang keadaan ekonomi di Kabupaten Semarang.
Dalam publikasi ini dimuat gambaran kinerja pembangunan ekonomi Kabupaten Semarang ,termasuk didalamnya mencakup data dan informasi tentang pertumbuhan ekonomi, pendapatan perkapita, dan struktur ekonomi Kabupaten Semarang.
Pada kesempatan ini kami ucapkan terimakasih kepada Bupati Semarang yang telah memberikan dukungan terhadap penerbitan publikas iini. Ucapan yang sama kami sampaikan juga kepada Badan Perencanaan dan Pembangunan Daerah, instansi-instansi, dan semua pihak yang telah membantu terwujudnya publikasi ini.
Akhirnya, saran dan kritik dari berbagai pihak kami harapkan guna kesempurnaan publikasi ini di masa mendatang. Semoga publikasi ini bermanfaat bagi semua pihak.
Ungaran, Oktober 2013 BADAN PUSAT STATISTIK
KABUPATEN SEMARANG K e p a l a,
R O C H W A N , SE. MM NIP. 19590119 198003 1 001
vi
Produk Domestik Regional Bruto Kabupaten Semarang Menurut Lapangan UsahaP R E F A C E
By the blessing at the One God, the publication of Gross Regional Domestic Product of Semarang Regency 2013 Book can be finished. The publication becoming two book with title that are “GRDP Semarang Regency by Economic Activity”, and “GRDP Semarang Regency by District”. In this publication served in macro and micro about the economic condition in Semarang Regency.
In this publication provides descriptions of performance of economic macro in Semarang Regency, comprising data and information of economic growth, income per capita, and economic structure of Semarang Regency.
I would like to express my gratitude to Regent of Semarang for the support to this publication. We also thanks to Regional Development and Planning Board, and all the public and all parties who contributed to this publication.
Finally, we are expected from user the better critic and advises for this further publication. We hope this publication will be usefull to all users.
Ungaran, Oktober 2013 BADAN PUSAT STATISTIK of
SEMARANG REGENCY
R O C H W A N , SE.MM NIP. 19590119 198003 1 001
Produk Domestik Regional Bruto Kabupaten Semarang Menurut Lapangan Usaha
vii
DAFTAR ISI
Contents
Uraian Hal.
Katalog ii
Kata Sambutan/Foreword iii
Kata Pengantar/Preface v
Daftar Isi/Content vii
Daftar Tabel dan Grafik / Table ang Grafik List ix
DaftarLampiran/ Appendix List xi
I Pendahuluan / Introduction 1
1.1 Umum / General
1.2 Konsep dan Definisi / Concept and Definition
1.3 Penyajian Angka PDRB dan Angka Indeks / Presentation Rate and The GDP Value Indeks
1.4 Kegunaan Masing-Masing Ukuran PDRB / The Benefit of Each Regional Income Indicators
1 2 5 7 II Metode Penghitungan Produk Domestik Regional Bruto /
Calculated Methode of Gross Regional Domestic Product 9 2.1 Metode Penghitungan PDRB Atas Dasar Harga Berlaku/
Calculated Methode of GRDP at Current Price 2.1.1 Metode Langsung / Direct Methode 2.1.2 Metode Tidak Langsung / Indirect Methode
10 10 12 2.2 Metode Penghitungan PDRB Atas Dasar Harga Konstan/
viii
Produk Domestik Regional Bruto Kabupaten Semarang Menurut Lapangan Usaha Uraian Hal. III Ulasan Produk Domestik Regional Bruto Kabupaten SemarangTahun 2012 / A Review Of Economic Growth And Regional Income
Structure of Semarang Regency 2012 15
3.1 Umum / General
3.2 Produk Domestik Regional Bruto kabupaten Semarang Tahun 2012/ Gross Regional Domestic Product of Semarang Regency 2012
3.3 Pertumbuhan Ekonomi / Economic Growth
3.3.1 Pertumbuhan PDRB atas Dasar Harga Berlaku / GDRP Growth in Current Price
3.3.2 Pertumbuhan PDRB atas Dasar Harga Konstan / GDRP Growth in Constant Price
3.4 Struktur PDRB Kabupaten Semarang/ GDRP Structure of Semarang Regency
3.5 Indek Perkembangan PDRB Kabupaten Semarang / GRDP Improvement Index of Semarang Regency
3.6 Indeks Implisit PDRB Kabupaten Semarang / GRDP Implicite Index of Semarang Regency
3.7 Pendapatan Regional Per Kapita Kabupaten Semarang/ Regional Income Per Capita of Semarang Regency
3.8 Distribusi PDRB Menurut Kelompok Sektoral / GRDP Distribution According to Sectoral Groups
3.9 Tingkat Pertumbuhan PDRB Kabupaten Semarang Menurut Kelompok Sektoral/ GRDP Growth of Semarang Regency Based on Sectoral Group
15 18 20 24 28 34 37 39 41 43 3.10 Perkembangan PDRB Menurut Kelompok Sektoral /GRDP
Improvement at Sectoral Group
Produk Domestik Regional Bruto Kabupaten Semarang Menurut Lapangan Usaha
ix
DAFTAR LAMPIRAN
Tabel Uraian Hal. Tabel 1.1. Produk Domestik Regional Bruto Tahun 2008 sampai
dengan 2012 Menurut Sektor/ Sub Sektor Atas Dasar Harga Berlaku / Gross Regional Domestic Product 2008-2012 by sector/subsector at current price in
Semarang Regency 47
Tabel 1.2. Produk Domestik Regional Bruto Tahun 2008 sampai dengan 2012 Menurut Sektor/ Sub Sektor Atas Dasar Harga Konstan 2000 / Gross Regional Domestic Product
2008-2012 by sector/subsector at Constant Price 48 Tabel 1.3. Pendapatan Regional dan Angka Per Kapita Tahun 2008
sampai dengan 2012 Atas Dasar Harga Berlaku / Regional
Income and Per Capita Value 2008-2012 at Current Price 49 Tabel 1.4. Pendapatan Regional dan Angka Per Kapita Tahun 2008
sampai dengan 2012 Atas Dasar Harga Konstan 2000 / Regional Income and Per Capita Value 2008-2012 at
Constant 50
Tabel 1.5. Distribusi Persentase Produk Domestik Regional Bruto Tahun 2008 sampai dengan 2012 Menurut Sektor/ Sub Sektor Atas Dasar Harga Berlaku /GRDP Persentage Distribution 2008-2012 by Sector/sub sector at Current Price in Semarang Regency
51 Tabel 1.6. Distribusi Persentase Produk Domestik Regional Bruto
Tahun 2008 sampai dengan 2012 Menurut Sektor/ Sub Sektor Atas Dasar Harga Konstan 2000 /
GRDP Persentage Distribution 2008-2012 by Sector/sub
x
Produk Domestik Regional Bruto Kabupaten Semarang Menurut Lapangan Usaha Tabel Uraian Hal. Tabel 1.7. Indek Berantai Produk Domestik Regional BrutoTahun2008 sampai dengan 2012 Menurut Sektor/ Sub Sektor Atas Dasar Harga Berlaku /GRDP Growth Rate 2008-2012 by sector/sub sector at Current Price 53 Tabel 1.8. Indek Berantai Produk Domestik Regional BrutoTahun
2008 sampai dengan 2012 Menurut Sektor/ Sub Sektor Atas Dasar Harga Konstan 2000 / GRDP Growth Rate 2008-2012 by sector/sub sector at Constant Price 54 Tabel 1.9. Indek Perkembangan Produk Domestik Regional Bruto
Tahun 2008 sampai dengan 2012 Menurut Sektor/ Sub Sektor Atas Dasar Harga Berlaku /GRDP Improvement Index 2008-2012 by sector/subsector at Current Price 55 Tabel 1.10. Indek Perkembangan Produk Domestik Regional Bruto
Tahun 2008 sampai dengan 2012 Menurut Sektor/ Sub Sektor Atas Dasar Harga Konstan 2000 / GRDP Improvement Index 2008-2012 by sector/subsector at
Constant Price 56
Tabel 1.11. Indek Implisit Produk Domestik Regional Bruto Tahun 2008 sampai dengan 2012 Menurut Sektor/ Sub Sektor /
GRDPImplicite Index 2008-2012 57
Tabel 1.12. Indek Berantai Pendapatan Regional dan Angka Per Kapita Tahun 2008 sampai dengan 2012 Atas Dasar Harga Berlaku / Regional Income Growth and Per Capita
Value 2008-2012 at Current Price 58
Tabel 1.13. Indek Berantai Pendapatan Regional danAngka Per KapitaTahun 2008 sampai dengan 2012 AtasDasarHargaKonstan 2000 / Regional Income Growth and Per Capita Value 2008-2012 at Constant Price 59
Produk Domestik Regional Bruto Kabupaten Semarang Menurut Lapangan Usaha
xi
Tabel Uraian Hal. Tabel 1.14. Indek Perkembangan Pendapatan Regional dan AngkaPer Kapita Tahun 2008 sampai dengan 2012 Atas Dasar Harga Berlaku / Regional Income Improvement Index and Per Capita Value 2008-2012 at Current Price
60 Tabel 1.15. Indek Perkembangan Pendapatan Regional danA ngka
Per Kapita Tahun 2008 sampai dengan 2012 Atas Dasar Harga Konstan 2000 / Regional Income Improvement Index and Per Capita Value 2008-2012 at Constant
Price 61
Tabel 1.16. Produk Domestik Regional Bruto Tahun 2008 sampai dengan 2012 Menurut Kelompok Sektoral Atas Dasar Harga Berlaku / Gross Regional Domestic Product 2008-2012 in sectoral Group at current price 62 Tabel 1.17. Produk Domestik Regional Bruto Tahun 2008 sampai
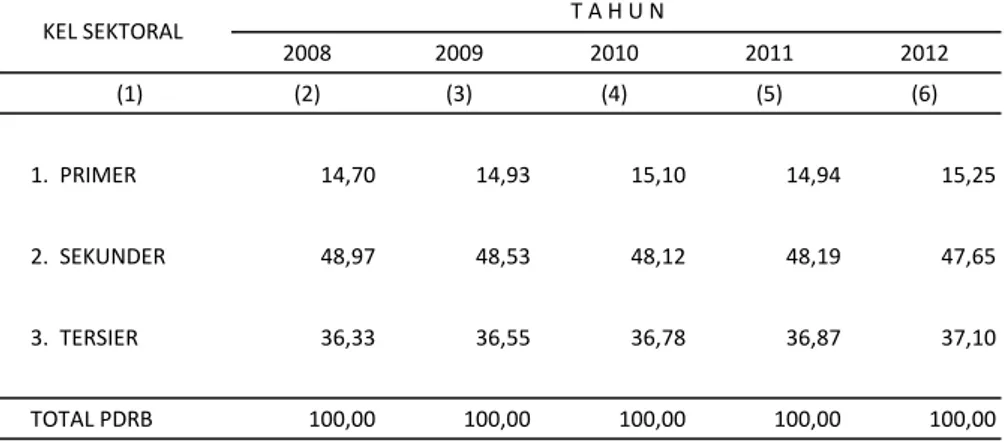
dengan 2012 Menurut Kelompok Sektoral Atas Dasar Harga Konstan 2000 /Gross Regional Domestic Product 2008-2012 in sectoral Group at Constant price 62 Tabel 1.18. Distribusi Persentase PDRB Tahun 2008 sampai dengan
2012 Menurut Kelompok Sektoral Atas Dasar Harga Berlaku / GRDP Persentage Distribution 2008-2012 in
Sectoral Group at Current Price 63
Tabel 1.19. Distribusi Persentase PDRB Tahun 2008 sampai dengan 2012 Menurut Kelompok Sektoral Atas Dasar Harga Konstan 2000/ GRDP Persentage Distribution 2008-2012
xii
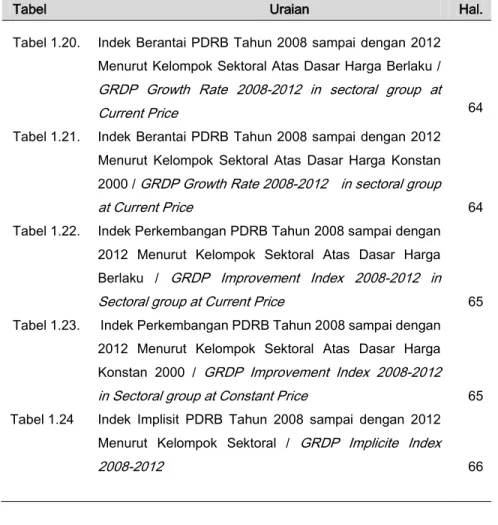
Produk Domestik Regional Bruto Kabupaten Semarang Menurut Lapangan Usaha Tabel Uraian Hal. Tabel 1.20. Indek Berantai PDRB Tahun 2008 sampai dengan 2012Menurut Kelompok Sektoral Atas Dasar Harga Berlaku / GRDP Growth Rate 2008-2012 in sectoral group at
Current Price 64
Tabel 1.21. Indek Berantai PDRB Tahun 2008 sampai dengan 2012 Menurut Kelompok Sektoral Atas Dasar Harga Konstan 2000 / GRDP Growth Rate 2008-2012 in sectoral group
at Current Price 64
Tabel 1.22. Indek Perkembangan PDRB Tahun 2008 sampai dengan 2012 Menurut Kelompok Sektoral Atas Dasar Harga Berlaku / GRDP Improvement Index 2008-2012 in
Sectoral group at Current Price 65
Tabel 1.23. Indek Perkembangan PDRB Tahun 2008 sampai dengan 2012 Menurut Kelompok Sektoral Atas Dasar Harga Konstan 2000 / GRDP Improvement Index 2008-2012
in Sectoral group at Constant Price 65
Tabel 1.24 Indek Implisit PDRB Tahun 2008 sampai dengan 2012 Menurut Kelompok Sektoral / GRDP Implicite Index
Produk Domestik Regional Bruto Kabupaten Semarang Menurut Lapangan Usaha
1
BAB I
PENDAHULUAN
INTRODUCTION
1.1. UMUM
Pembangunan ekonomi sebagai salah satu rangkaian pembangunan nasional mempunyai pengertian sebagai suatu perubahan yang terjadi secara terus menerus melalui serangkaian proses demi peningkatan pendapatan perkapita dalam jangka waktu yang panjang. Peningkatan pertumbuhan ekonomi daerah merupakan serangkaian usaha dan kebijaksanaan ekonomi yang bertujuan untuk meningkatkan kesejahteraan hidup masyarakat, memperluas kesempatan kerja, meratakan distribusi pendapatan, meningkatkan hubungan ekonomi antar wilayah di dalam suatu daerah maupun antar daerah, dan mengembangkan ekonomi secara sektoral maupun lintas sektor yang lebih menguntungkan dikatikan dan didukung dengan strategi peningkatan sumber daya manusia Indonesia.
Dalam perencanaan pembangunan ekonomi diperlukan berbagai macam data statistik sebagai dasar penentuan strategi dan kebijaksanaan agar tujuan pembangunan dapat tercapai. Untuk
1.1. GENERAL
Economic development as one of a series of national development has the sense of a change that occurs continuously through a series of process to increase per capita income in long term. Economic Growth increase in a region/area is a series of efforts and economic policies that aim to improve welfare of people, expanding employment
opportunities, flatten the income distribution, improve economic relations between area within region or between regions, and to develop economic sector ally and cross-sectoral more profitable supported by a strategy to enhance human resources in Indonesia.
In the planning of economic development required variety of statistical data as a basis for
determining strategies and
discretion in order to achieve development goals. To know the
2
Produk Domestik Regional Bruto Kabupaten Semarang Menurut Lapangan Usahamengetahui keberhasilan pembangunan suatu daerah juga diperlukan data statistik. Salah satu data statistik yang dapat dijadikan sebagai bahan analisis tentang pembangunan ekonomi suatu daerah adalah Produk Domestik Regional Bruto (PDRB).
Produks Domestik Regional Bruto (PDRB) Kabupaten Semarang disajikan secara series sehingga bisa memberikan gambaran kinerja ekonomi dari waktu ke waktu sehingga arah perekonomian regional akan lebih jelas. Bagi pengguna data akan lebih memberikan manfaat untuk berbagai kepentingan, seperti untuk perencanaan pembangunan, evaluasi maupun kajian.
1.2. KONSEP DAN DEFINISI
Semua barang dan jasa sebagai hasil dari kegiatan-kegiatan ekonomi yang beroperasi di wilayah domestik, tanpa memperhatikan apakah faktor produksi yang digunakan berasal dari atau dimiliki penduduk daerah tersebut merupakan produk domestik daerah tersebut. Pendapatan yang timbul oleh karena adanya kegiatan tersebut merupakan pendapatan domestik.
Pada kenyataannya, sebagian dari faktor produksi yang digunakan dalam proses produksi di suatu daerah berasal dari daerah lain atau luar negeri, demikian juga sebaliknya
successful development of a region also required statistical data. One of the statistical data that can be used as an ingredient analysis of the economic development of a region is Gross Regional Domestic Product (GRDP).
Gross Regional Domestic Product (GRDP) of Semarang Regency served in series so it can gives the description of economic performance over time so that the regional economy will be more obvious. For the user data will be more beneficial for various purposes, such as development planning, evaluation, and assessment.
1.2. CONCEPT AND DEFINITION
All goods and services as a result of economic activities that operated in domestic area, regardless of whether the factors used are from owned people or the ownership by local people of that region called domestic product from that region. Income that arises because of that activity is domestic income.
In fact, part of productive factors used in production process in a region from other region or abroad and also productive factors which owned by resident of a region
Produk Domestik Regional Bruto Kabupaten Semarang Menurut Lapangan Usaha
3
faktor produksi yang dimiliki oleh penduduk daerah tersebut ikut serta dalam proses produksi di daerah lain atau luar negeri. Hal ini menyebabkan nilai produk domestik yang timbul di suatu daerah tidak sama dengan pendapatan yang diterima penduduk daerah tersebut. Dengan adanya arus pendapatan yang mengalir antar daerah (termasuk juga dari dan ke luar negeri) yang pada umumnya berupa upah/gaji, bunga, deviden, dan keuntungan maka timbul perbedaan antara produks domestik dan Produk Regional.
Produk Regional adalah produk domestik ditambah dengan pendapatan yang diterima dari luar daerah/luar negeri dikurangi dengan pendapatan yang dibayarkan keluar daerah/luar negeri tersebut. Akan tetapi untuk mendapatkan angka-angka pendapatan yang mengalir keluar dan masuk ke suatu daerah masih sangat sulit untuk saat ini, sehingga produk regional belum bisa dihitung. Jadi untuk pendekatannya kita pakai Produk Domestik Regional Neto (PDRN) atas dasar biaya faktor.
1.2.1. Produk Domestik Regional Bruto (PDRB) atas dasar Harga Pasar
Angka PDRB atas dasar harga pasar diperoleh dengan menjumlahkan nilai tambah bruto (Gross Value Added) yang timbul dari seluruh sektor ekonomi di wilayah tersebut. Nilai Tambah Bruto adalah
participates in the production process in other region or abroad. This causes the value of domestic products that arisee in a region not equal with income which receives by people in that area. With the income flows between region (included from and to abroad) are generally in form of wages/salaries, interest, devidends, and profits then arise differences between domestic products and regional products.
Regional products are domestic products combined with income receive from other region or abroad minus income paid to other region or other country. However, to get income values which flows out and into a region still very difficult for the moment, so that regional products cannot be calculated. For the aproach we used Net Regional Domestic Products (NRDP) at factor prices.
1.2.1. Gross Regional Domestic Products (GRDP) at Market Price
GRDP value at market price is obtained by adding gross value added from all economic sectors in that region. Gross value added is value that arises after production process or production value minus
4
Produk Domestik Regional Bruto Kabupaten Semarang Menurut Lapangan Usahanilai yang timbul setelah melalui proses produksi atau nilai produksi (output) dikurangi biaya antara. Nilai tambah bruto disini mencakup komponen-komponen faktor pendapatan (upah dan gaji, bunga, sewa tanah, dan keuntungan), penyusutan, dan pajak tak langsung Neto. Dengan menghitung nilai tambah bruto dari masing-masing sektor dan menjumlahkan nilai tambah bruto dari seluruh sektor akan diperoleh Produk Domestik Regional Bruto atas dasar harga pasar
1.2.2. Produk Domestik Regional Neto (PDRN) atas dasar harga pasar
Produk Domestik Regional Bruto atas dasar harga pasar dikurangi penyusutan akan diperoleh Produk Domestik Regional Neto atas dasar harga pasar. Penyusutan yang dimaksud adalah nilai susut (aus) barang-barang modal yang ikut serta dalam proses produksi.
1.2.3. Produk Domestik Regional Neto (PDRN) atas dasar Biaya Faktor
Perbedaan antara konsep biaya faktor dan harga pasar adalah karena adanya pajak tak langsung yang dipungut pemerintah dan subsidi yang diberikan oleh pemerintah kepada unit-unit produksi. Pajak tidak langsung berpengaruh menaikkan harga, sedangkan subsidi menurunkan harga. Pajak tidak langsung Neto diperoleh dari pajak
overhead costs. Gross value added covers revenue component or productive factors (wage and salary, interest, land rent, and profits), depreciation, and net indirect tax. By counting gross value added from each sector and calculated gross value added from all sector obtained Gross Regional Domestic Product at market prices.
1.2.2. Net Regional Domestic Products (NRDP) at market price
Gross Regional Domestic Product at market price subtracted by depreciation obtained Net Regional Domestic Product at market prices. Depreciation here means the value of depreciation (wearing out) of capital goods during the production process.
1.2.3. Net Regional Domestic Product (NRDP) at factor cost
The difference between factor price and market price is in the indirect tax that picked by the government and subsidies granted by the government to production units. Effect of indirect tax is to raise price, while the subsidies reduce prices. Net indirect tax derived from indirect tax minus subsidies.
Produk Domestik Regional Bruto Kabupaten Semarang Menurut Lapangan Usaha
5
tak langsung dikurangi subsidi. Produk Domestik Regional Neto atas dasar harga pasar dikurangi pajak tak langsung Neto didapat hasil Produk Domestik Regional Neto atas dasar biaya faktor.
1.2.4. Pendapatan Regional
Pendapatan regional diperoleh dengan mengurangkan produk domestik regional Neto atas dasar biaya faktor dengan pendapatan yang mengalir keluar ditambah dengan pendapatan yang mengalir ke dalam daerah tersebut. Pendapatan regional inilah yang benar-benar diperoleh dan dinikmati oleh penduduk yang tinggal di wilayah tersebut.
1.2.5. Pendapatan Regional
Perkapita
Bila pendapatan regional dibagi dengan jumlah penduduk pada pertengahan tahun akan dihasilkan pendapatan regional perkapita. Pendapatan regional perkapita adalah rata-rata pendapatan yang diperoleh oleh satu orang di wilayah tersebut.
1.3. PENYAJIAN ANGKA PDRB DAN ANGKA INDEKS
Publikasi Produk Domestik Regional Bruto disajikan dalam dua penghitungan, yaitu atas dasar harga berlaku dan atas dasar harga konstan.
Net Regional Domestic Product at market price subtracted by Net indirect tax obtained Net Regional Domestic Products (NRDP) at factor cost.
1.2.4. Regional Income
Regional income is obtained by subtracting Net regional domestic product at factor cost with income flowing out plus income that flows into region. This regional income is actually earned and enjoyed by people in that region.
1.2.5. Regional Income per capita
If regional income divided by midyear population will obtained regional income per capita. Regional income per capita is the average income earned by one person in the region.
1.3. PRESENTATION OF GRDP VALUE AND INDEX RATE
Publication of Gross Regional Domestic Product is present in two counts, at current price and at constant price. On GRDP at current
6
Produk Domestik Regional Bruto Kabupaten Semarang Menurut Lapangan UsahaPada PDRB atas dasar harga berlaku, semua agregrat pendapatan dinilai atas dasar harga yang berlaku pada tahun bersangkutan, baik pada saat menilai nilai produksi maupun biaya antara. Pada penyajian PDRB atas dasar harga konstan, semua agregrat pendapatan dinilai berdasarkan harga pada tahun dasar.
Pada penghitungan PDRB atas dasar harga konstan, tahun dasar yang digunakan adalah tahun 2000. Dalam penghitungan ini setiap perubahan agregrat pendapatan yang terjadi dari tahun ke tahun semata-mata karena perkembangan aktifitas riil, bukan karena perubahan harga.
Selain agregrat pendapatan, dalam publikasi ini juga ditampilkan angka indeks-angka indeks.
1. Distribusi persentase
Distribusi persentase menunjukkan kontribusi atau andil tiap-tiap sektor terhadap pembentukan nilai PDRB. Angka distribusi persentase diperoleh dengan membagi nilai pada masing-masing sektor dengan nilai total PDRB dikalikan 100. 2. Indeks Berantai
Indeks berantai menunjukkan perkembangan nilai PDRB dari tahun ke tahun terhadap tahun sebelumnya. Angka ini diperoleh dengan membagi nilai pada masing-masing sektor dan total PDRB dengan nilai pada tahun
price, all aggregate income assessed at current price in that year, either at the time of assessing the production value and intermediate cost. In GRDP at constant price, all aggregate income assessed at price in base year.
In the calculation of GRDP at constant price, used price in 2000 as the base year. In this calculation every aggregate income changes that occur from year to year because of development of real activities, not for price changes.
Besides aggregate income, is also featured in publication of index numbers.
1. Percentage distribution
Percentage distribution shows the contribution of each sector to the GRDP value. This figures obtained by dividing value in each sector with total value of GRDP multiplied by 100
2. Link Index
Link index shows the
development value of GRDP from year to year against the previous year. This figure is obtained by dividing the value of each sector and total GRDP with the previous year
Produk Domestik Regional Bruto Kabupaten Semarang Menurut Lapangan Usaha
7
sebelumnya dikalikan 100. Nilai indeks berantai ini yang akan menghasilkan angka pertumbuhan ekonomi baik atas dasar harga berlaku maupun atas dasar harga konstan dengan cara menghilangkan indeksnya. 3. Indeks Perkembangan
Indeks perkembangan menunjukkan tingkat perkembangan agregrat dari tahun ke tahun terhadap tahun dasarnya. Angka ini diperoleh dengan membagi nilai pada masing-masing tahun dengan nilai pada tahun dasar dikalikan 100. 4. Indeks Implisit
Indeks implisit menunjukkan tingkat perkembangan harga dari agregrat pendapatan terhadap harga pada tahun dasarnya. Angka ini diperoleh denga membagi nilai PDRB atas dasar harga berlaku dengan nilai PDRB atas dasar harga konstan untuk masing-masing dikalikan 100. Selanjutnya, bila indeks implisit dibust indeks berantainya akan terlihat tingkat perkembangan harga setiap tahun terhadap tahun sebelumnya.
1.4. KEGUNAAN MASING-MASING UKURAN PDRB
Manfaat yang dapat diperoleh dari Statistik Pendapatan Regional antara lain:
1. PDRB atas dasar harga berlaku
multiplied by 100. This chain index that will obtained economic growth well above current price and constant price by eliminating the index
3. Development Index
Development index shows the
level of development
aggregate from year to year against the base year. This figure is obtained by dividing the value at each year with a value in the base year multiplied by 100.
4. Implicit Index
Implicit index shows price growth rate of income aggregate on prices in the base year. This figure is obtained by dividing the value of GRDP at current price with the value of GRDP at constant price for each sector multiplied by 100. Furthermore, if the implicitly index created chain index will be seen the level of price growth every year for the previous year
1.4. BENEFIT OF EACH GRDP MEASURE
Benefits of Regional Income Statistics are:
8
Produk Domestik Regional Bruto Kabupaten Semarang Menurut Lapangan Usahamenunjukkan kemampuan sumber daya ekonomi yang dihasilkan oleh suatu daerah. Nilai PDRB yang besar menunjukkan kemampuan sumber daya ekonomi yang besar
2. PDRB atas dasar harga berlaku menunjukkan pendapatan yang memungkinkan dapat dinikmati oleh penduduk suatu daerah
3. PDRB atas dasar harga konstan digunakan untuk menunjukkan laju pertumbuhan ekonomi secara keseluruhan maupun setiap sektor dari tahun ke tahun
4. Distribusi PDRB atas dasar harga berlaku menurut sektor menunjukkan besarnya struktur perekonomian dan peranan tiap sektor ekonomi dalam suatu wilayah. Sektor ekonomi yang mempunyai peranan besar menunjukkan basis perekonomian di suatu wilayah
5. PDRB perkapita atas dasar harga berlaku menunjukkan nilai PDRB per kepala atau persatu orang penduduk 6. PDRB perkapita atas dasar
harga konstan berguna untuk mengetahui pertumbuhan nyata ekonomi perkapita
shows the capability of economic resources to produce products in a region. A large value of GRDP shows a strong economic capability
2. GRDP at current prices shows income that can be enjoyed by resident of a region
3. GRDP at constant prices give a figure for economic growth rate for the whole or specific sector annually
4. Distribution of GRDP at current prices by sector shows the role of economic structure and economic sectors within a region. A big share of economic sector indicate a potential of region’s economy
5. GRDP per capita at current price indicates the value of GRDP by one person
6. GRDP per capita at
constant price if useful to know the real economic growth per capita
Produk Domestik Regional Bruto Kabupaten Semarang Menurut Lapangan Usaha
9
BAB. IIMETODE PENGHITUNGAN PRODUK DOMESTIK REGIONAL BRUTO
CALCULATED METHOD OF GROSS REGIONAL DOMESTIC PRODUCT
2.1. METODE PENGHITUNGAN PDRB ATAS DASAR HARGA BERLAKU
PDRB atas dasar harga berlaku dapat dihitung dengan dua metode, yaitu metode langsung dan metode tidak langsung.
2.1.1. Metode Langsung
Metode langsung adalah metode penghitungan dengan menggunakan data yang bersumber dari daerah. Dengan penghitungan dengan metode langsung akan dapat memperlihatkan karakteristik sosial ekonomi setiap daerah. Metode ini dapat menggunakan 3 pendekatan, yaitu pendekatan produksi, pendekatan pengeluaran, dan pendekatan pendapatan.
1. Pendekatan Produksi
Penghitungan nilai PDRB dengan pendekatan produksi adalah dengan menghitung nilai tambah dari barang dan jasa yang diproduksi oleh seluruh kegiatan ekonomi dengan cara mengurangkan biaya antara dari masing-masing nilai produksi bruto tiap-tiap sektor atau sub sektor. Pendekatan ini biasa juga disebut dengan pendekatan nilai tambah. Nilai tambah merupakan
2.1. CALCULATED METHOD OF GRDP AT CURRENT PRICES
GRDP at current price can be estimated in two methods, namely direct and indirect method.
2.1.1. Direct Method
Direct method is an estimated method using data source from the region. By calculating with direct method will be seen social economic characteristics of each region. This method can use three
approaches, namely the
production approach, expenditure approach, and income approach.
1. Production Approch
Production approach
estimates the value added of goods and services produced by all economic activities by subtracting overhead cost for each gross production value of every sector or sub sector. This approach is also called value added approach. Value added is a value which added to goods and services used by production unit
10
Produk Domestik Regional Bruto Kabupaten Semarang Menurut Lapangan Usahanilai yang ditambahkan pada barang dan jasa yang dipakai oleh unit produksi dalam proses produksi sebagai input antara. Nilai yang ditambahkan ini merupakan balas jasa faktor produksi atas ikut sertanya dalam proses produksi.
Barang dan jasa yang dihasilkan dinilai dengan harga produsen, yaitu harga yang belum termasuk biaya transport dan keuntungan pemasaran. Penggunaan harga produsen ini adalah untuk mengetahui nilai tambah yang benar-benar diterima oleh para produsen.Sedangkan biaya transport akan dihitung pada sektor angkutan dan keuntungan pemasaran akan dihitung sebagai nilai tambah pada sektor perdagangan.
Kegiatan produksi dalam pendekatan ini dikelompokkan menjadi 9 sektor atau lapangan usaha yaitu : 1. Pertanian; 2. Pertambangan dan Penggalian; 3. Industri Pengolahan; 4. Listrik, Gas, dan Air Bersih; 5. Konstruksi; 6. Perdagangan, Hotel dan Restoran; 7. Angkutan dan Komunikasi; 8. Keuangan, Persewaan, dan jasa perusahaan; dan 9. Jasa-jasa
2. Pendekatan Pendapatan
Nilai tambah dari kegiatan ekonomi dalam penghitungan dengan pendekatan pendapatan adalah dengan menjumlahkan
in its process as intermediate input. This value added is the rewards of production factors on the participation in production process.
The product of goods and services will be counted with producer’s price, that is the price excluded transportation and marketing profit cost. The use of this producer’s price is to know the real value added which accepted by producer. Meanwhile the transportation cost will be counted as a value added on the transportation and marketing profit will be counted as a value added on trade sector.
Production activity in this approach are group in nine sectors, there are: 1. Agriculture; 2. Mining and quarrying; 3. Industry; 4. Electricity, gas, and water supply; 5. Construction; 6. Trade, hotels, and restaurants; 7.
Transportation and
communication; 8. Finance, leasing, and business services; and 9. Services.
2. Income Approach
Value added from all economic activities is estimated by calculating all return value of productive factors. The return
Produk Domestik Regional Bruto Kabupaten Semarang Menurut Lapangan Usaha
11
semua balas jasa faktor produksi. Balas jasa faktor produksi tersebut adalah:
a. Upah/gaji (balas jasa faktor produksi tenaga kerja) b. Sewa tanah (balas jasa faktor
produksi tanah)
c. Bunga modal (balas jasa faktor produksi modal) d. Keuntungan (balas jasa faktor
produksi wiraswasta/skill) Hasil penjumlahan seluruh balas jasa faktor produksi yang dibayarkan oleh unit-unit ekonomi yang beroperasi di suatu wilayah disebut nilai tambah neto atas dasar biaya faktor.
Untuk mendapatkan nilai tambah bruto atau produk domestik bruto atas dasar harga pasar maka harus ditambah dengan nilai penyusutan yang terjadi dan pajak tak langsung neto.
3. Pendekatan Pengeluaran
Penghitungan dengan metode ini adalah dengan cara menjumlahkan nilai permintaan akhir dari seluruh barang dan jasa, yaitu:
a. Yang dikonsumsi oleh rumah tangga, lembaga swasta nirlaba, dan pemerintah b. Yang digunakan untuk
pembentukan modal tetap bruto
c. Sebagai stok dan ekspor neto
value of productive factors are: a. Wage/salary (recompense
of labour fource production factor)
b. Land rent (recompense of land production factor) c. Capital finance interest
(recompense of capital finance production factor) d. Profit (recompense of
enterpreneur / skill production factor)
The adding result of all the recompenses paid by economic units which operate in a region is called Net value added based on factor cost.
To get gross value added or Gross domestik product at market price should be added by depreciation and Net indirect tax.
3. Expenditure Approach
By this method, regional income estimated by adding all last demand value for all goods and services, there are:
a. Consumed by household, nonprofit institutions, and government
b. Used to make gross fixed capital formation
c. Used as stock and Net export
12
Produk Domestik Regional Bruto Kabupaten Semarang Menurut Lapangan UsahaEkspor neto adalah nilai barang yang diekspor dikurangi dengan nilai barang yang diimpor. Dengan menjumlahkan komponen-komponen konsumsi, pembentukan modal tetap bruto, stok, dan ekspor neto akan diperoleh Produk Domestik Regional Bruto atas dasar harga pasar.
2.1.2. Metode Tidak Langsung
Yang dimaksud dengan metode tidak langsung adalah metode alokasi, yaitu yang penghitungannya dengan cara mengalokasikan pendapatan dengan menggunakan alokator-alokator tertentu. Cara ini ditempuh karena data yang tersedia atau tidak mencukupi.
Alokator yang digunakan dapat didasarkan atas:
1. Nilai produksi bruto atau neto
2. Jumlah produksi fisik 3. Jumlah Tenaga kerja 4. Jumlah penduduk
5. Alokator lain yang dianggap cocok untuk daerah tersebut.
Dengan menggunakan salah satu atau kombinasi dari alokator tersebut dapat diperhitungkan prosentase bagian masing-masing kecamatan terhadap nilai tambah setiap sektor atau sub sektor.
Net export is export goods value minus import goods value. By adding the consumption components, gross fixed capital formation, stocks, and Net export will be obtained gross regional domestic product based on market price.
2.1.2. Indirect Method
The meaning of indirect method is allocation method, which is the estimation by alocating income by using specific alocators. This method is adopted becaouse the data is not sufficient.
The kinds of allocators which can be used are:
1. Gross or Net value of production
2. Number of physical production
3. Number of workers 4. Population
5. Another alocator which are consider appropriate for the region
By using one or a
combination of these alocators can be estimated percentage of each district of the value added of each sector or sub sector.
Produk Domestik Regional Bruto Kabupaten Semarang Menurut Lapangan Usaha
13
2.2. METODE PENGHITUNGAN PDRBATAS DASAR HARGA KONSTAN
Perkembangan nilai PDRB atas dasar harga berlaku dari tahun ke tahun menggambarkan perkembangan yang disebabkan oleh adanya perubahan dalam volume barang dan jasa yang dihasilkan dan perubahan harga. Oleh karena itu, untuk mengukur perkembangan volume produksi atau perkembangan produktivitas secara nyata, pengaruh dari perubahan harga dari tahun ke tahun perlu dihilangkan dengan cara menghitung nilai PDRB atas dasar harga konstan.
Penghitungan nilai PDRB atas dasar harga konstan ini berguna antara lain untuk perencanaan ekonomi, proyeksi, dan menilai pertumbuhan ekonomi secara keseluruhan maupun sektoral. Nilai atas dasar harga konstan juga mencerminkan kuantum produksi pada tahun berjalan yang dinilai atas dasar harga pada tahun dasar.
Pada dasarnya dikenal tiga cara penghitungan nilai tambah sektoral atas dasar harga konstan, yaitu:
1. Revaluasi
Penghitungan dengan cara revaluasi adalah mengalikan kuantum pada tahun berjalan dengan harga pada tahun dasar. Hasilnya adalah nilai atas dasar harga konstan
2.2. CALCULATED METHOD OF GRDP AT CONSTANT PRICE
The development of GRDP value in years described the development coused by change the volume of goods and services produced ang the price changes. Therefore, to measure the
production volume or
development of real productivity, the effect of price change need to be eliminated by estimate GRDP value base on constant prices.
Calculating GRDP value at constant price usefull for economic planning, projection, and asses overall and economic growth. Values at constant price also reflect quantum of production in current year counting by price in the base year.
There are three methods to calculating sectoral value added at constan price, there are
1. Revaluation
Calculation by revaluation is multiplying quantum in current year with prices in the base year. The result is the value at constant prices.
14
Produk Domestik Regional Bruto Kabupaten Semarang Menurut Lapangan Usaha2. Ekstrapolasi
Penghitungan dengan cara ekstrapolasi adalah dengan cara mengalikan nilai tahun dasar dengan suatu indeks kuantum dibagi 100.
Yang perlu diperhatikan dalam cara ini adalah ekstrapolatornya. Kuantitas produksi dari masing-masing sektor/ sub sektor merupakan ekstrapolator terbaik, namun apabila angka-angka tersebut tidak diperoleh maka dapat pula dipakai keterangan-keterangan lain yang erat kaitannya dengan produktivitas seperti tenaga kerja, kapasitas produksi (mesin, kendaraan, dan sebagainya)
3. Deflasi
Penghitungan dengan cara deflasi adalah dengan cara membagi nilai tambah atas dasar harga berlaku dengan indeks harga dari barang yang bersangkutan. Indeks harga disini dapat berupa indeks harga perdagangan besar, indeks harga produsen, dan indeks harga konsumen. Indeks harga yang dipakai sebagai deflator harus disesuaikan tahun dasarnya.
2. Ekstrapolation
Calculation by
ekstrapolation is calculated by multiplying value in the base year with quantum index devided by 100.
That need attention in this way is the ekstrapolators. Production quantity of each sector or sub sector are best ekstrapolator, but if the values are not obtained it can use other descriptions such as labor, and production capacity (machinery, vehicles, etc.).
3. Deflation
This calculations is by dividing the value added at current prices by the price index. This index can be wholesale price index, producer price index, and consumer price index. Price index used as deflator should be adjusted in base year.
Produk Domestik Regional Bruto Kabupaten Semarang Menurut Lapangan Usaha
15
BAB IIIULASAN PRODUK DOMESTIK REGIONAL BRUTO KABUPATEN SEMARANG TAHUN 2012
A REVIEW OF ECONOMIC GROWTH AND REGIONAL INCOME STRUCTURE OF SEMARANG REGENCY 2012
3.1 Umum
Pertumbuhan ekonomi adalah proses perubahan kondisi perekonomian suatu negara atau wilayah secara berkesinambungan menuju keadaan yang lebih baik selama periode tertentu. Pertumbuhan ekonomi dapat diartikan juga sebagai proses kenaikan kapasitas produksi suatu perekonomian yang diwujudkan dalam bentuk kenaikan pendapatan nasional.
Pertumbuhan ekonomi dapat digunakan sebagai indikasi keberhasilan pembangunan ekonomi. Pertumbuhan ekonomi juga digunakan sebagai salah satu indikator untuk mengukur hasil pembangunan. Gambaran ekonomi dan pertumbuhannya di Kabupaten Semarang dapat dilihat dari penyajian data Produk Domestik Regional Bruto (PDRB) yang disajikan secara series dari tahun ke tahun.
Produk Domestik Regional Bruto Kabupaten Semarang Tahun 2011 sebesar 12 335,45 milyar rupiah. Nilai tersebut mengalami peningkatan di Tahun 2012 menjadi
3.1. General
Economic growth is the changing process of economic condition of a country or an area which is continous towards on the better condition in certain period. It can be defined also as an increase of the production capacity of an economy that is realized in the form of an increase in national income.
Economic growth can be used as a success indication of economic development. It is also used as an indicator to measure development outcomes. Economic outlook and growth in Semarang Regency can be seen from the data of Gross Regional Domestic Product (GRDP) that are presented in series annualy.
Gross Regional Domestic Product of Semarang Regency in 2011 amounted to 12,335.45 billion rupiahs. It was increasing in 2012 as 13,845.496 billion rupiahs. The
16
Produk Domestik Regional Bruto Kabupaten Semarang Menurut Lapangan Usaha13 845, 496 milyar rupiah. Pertumbuhan ekonomi juga mengalami peningkatan dari 5,56 persen di Tahun 2011 menjadi 6,02 persen di Tahun 2012. Pertumbuhan dalam nilai PDRB maupun dalam pertumbuhan ekonomi menunjukkan kondisi perekonomian yang sudah semakin membaik. Nilai PDRB di Tahun 2012 masih merupakan angka sementara karena bisa berubah di tahun berikutnya jika ada perbaikan dan atau perubahan data pokok.
Perbandingan pertumbuhan ekonomi dengan daerah sekitar juga diperlukan untuk melihat pencapaian keberhasilan pembangunan daerah. Nilai PDRB Kabupaten Semarang menempati urutan keenam di Jawa Tengah di bawah Kabupaten Klaten, dan menyumbang 7 persen nilai PDRB Jawa Tengah. Pertumbuhan ekonomi Jawa Tengah Tahun 2012 lebih tinggi dibandingkan pertumbuhan ekonomi Kabupaten Semarang, yaitu sebesar 6,34 persen. Daerah di sekitar Kabupaten Semarang yang mempunyai pertumbuhan ekonomi lebih tinggi dibandingkan Jawa Tengah adalah Kota Semarang, dengan pertumbuhan ekonomi 6,42 persen.
Economic growth is also increased, from 5.56 percent in 2011 to 6.02 percent in 2012. Escalating of GRDP value and economic growth indicates that economy has getting better.
Comparing the economic growth with the surrounding area of Semarang Regency is necessary in order to look the achievements of regional development results. The GRDP value of Semarang Regency ranks sixth in Central Java Province area under the Klaten Regency, and contributed as 7 percent to GRDP of Central Java Province. Economic growth of Semarang Regency is lower than of Central Java Province that calculated as 6.34 percent. Semarang city, an area surrounding
of Semarang Regency has
economic growth higher than Central Java Province. It is 6.42 percent, the economic growth of Semarang City.
Produk Domestik Regional Bruto Kabupaten Semarang Menurut Lapangan Usaha
17
Tabel 3.1.Pertumbuhan Ekonomi Daerah Sekitar Kabupaten Semarang dan Jawa Tengah Tahun 201 2
Economic Growth in Four Regency in Jawa Tengah 201 2
Tahun/
Year
Pertumbuhan Ekonomi (persen)/
Economic Growth (percent)
(1) (2) Kabupaten Boyolali Kota Semarang Kabupaten Demak Kabupaten Semarang Kabupaten Kendal Propinsi jawa Tengah
5,66 6,42 4,64 6,02 5,54 6,34 Grafik 3.1.
Pertumbuhan Ekonomi Lima Kabupaten Di Jawa Tengah Tahun 2012
Economic Growth in Five Regency in Central Java 2012
5,66 4,64
6,02 5,54 6,42
18
Produk Domestik Regional Bruto Kabupaten Semarang Menurut Lapangan Usaha3.2.
Produk Domestik Regional BrutoKabupaten Semarang Tahun 2012
Produk Domestik Regional Bruto Kabupaten Semarang pada Tahun 2012 atas dasar harga berlaku sebesar 13.845,50 milyar rupiah, dan atas dasar harga konstan sebesar 6.223,19 milyar rupiah (lampiran tabel 1.1 dan 1.2). Nilai tersebut lebih tinggi dibandingkan tahun sebelumnya dimana nilai PDRB atas dasar harga berlaku sebesar 12.335,45 milyar rupiah dan PDRB atas dasar harga konstan sebesar 5.869,95 milyar rupiah. Untuk melihat perkembangan nilai PDRB dari tahun ke tahun dapat dilihat dari indeks perkembangannya. Indeks perkembangan merupakan nilai PDRB tahun ini diband ingkan dengan tahun dasar yaitu Tahun 2000. Dengan indeks perkembangan dapat dilihat peningkatan nilai PDRB sejak Tahun 2000. Untuk lebih jelasnya dapat dilihat tabel berikut:
3.2.Gross Regional Domestic Product of Semarang Regency 2012
Gross Regional Domestic Product (GRDP) of Semarang Regency in 2012 at current prices amounted to 13,845.50 billion rupiahs, and at constant price to 6,223.19 billion rupiahs (appendix tables 1.1 and 1.2). That value is higher than last year, that was in 2011 GRDP value at current price is 12,335.45 billion rupiahs and GRDP at constant price is 5,869.95 billion rupiahs. In order to see the development of GRDP value every year can be used
from development index.
Development index is GRDP value in this year compare with GRDP value in based year, in 2000. With this index can be seen the development of GRDP since 2000. For more clearly can be seen in this table below:
Produk Domestik Regional Bruto Kabupaten Semarang Menurut Lapangan Usaha
19
Tabel 3.2.Produk Domestik Regional Bruto Kabupaten Semarang Tahun 2008-2012
Gross Domestic Regional Product of Semarang Regency 2008-2012
Tahun / Year
PDRB Atas Dasar Harga Berlaku/ GDRP at Current Price
PDRB Atas Dasar Harga Konstan / GDRP at Constant Price 2000 Jumlah (Juta Rp)/ Total (Million Rp) Perkembangan/ Progress (%) Jumlah (Juta Rp)/ Total (Million Rp) Perkembangan/ Progress (%) (1) (2) (3) (4) (5) 2008 9 284 507,6 249,30 5 079 003,7 136,38 2009 10 066 845,5 270,30 5 300 723,4 142,33 2010 11 071 609,3 297,28 5 560 551,9 149,31 2011 12 335 446,5 331,22 5 877 190,9 157,81 2012 13 845 496,2 371,76 6 223 188,3 167,10
Dari tabel tersebut dapat dilihat indeks perkembangan nilai PDRB atas dasar harga berlaku sebesar 371,76 persen dibandingkan tahun 2000. Hal ini berarti bahwa seluruh potensi di Kabupaten Semarang telah menghasilkan uang 3,72 kali lebih besar dibandingkan tahun 2000. Sedangkan untuk PDRB atas dasar harga konstan 2000, perkembangannnya mencapai 167,10 persen Hal ini berarti kegiatan perekonomian di Kabupaten Semarang telah meningkatkan produksi barang dan jasa 1,67 kali dibandingkan tahun 2000.
From this table we can see the development index of GRDP at current prices amounted to 371.76 percent compared to 2000. This means that all the potential in Semarang district has been making money 3.72 times greater than in 2000. As for GRDP at constant prices of 2000, the improve reached 167,10 percent. This means that economic activities in Semarang regency has increased the production of goods and services 1,67 times compared to year 2000.
20
Produk Domestik Regional Bruto Kabupaten Semarang Menurut Lapangan UsahaPerbedaan laju perkembangan PDRB atas dasar harga berlaku dan PDRB atas dasar harga konstan terjadi karena adanya perubahan harga yang terjadi di pasar.
3.3. Pertumbuhan Ekonomi
3.3.2 Pertumbuhan PDRB atas dasar harga berlaku
Pertumbuhan PDRB adalah perbandingan antara nilai PDRB tahun yang bersangkutan dengan nilai PDRB tahun sebelumnya. Nilai ini didapat dari menghitung indeks berantai PDRB yaitu dengan cara membagi nilai PDRB tahun ini dengan PDRB tahun sebelumnya dikali 100 persen. Untuk melihat hasil penghitungan indeks berantai bisa dilihat pada lampiran tabel 1.7 untuk indeks atas dasar harga berlaku dan tabel 1.8 untuk indeks atas dasar harga konstan. Angka pertumbuhan PDRB tiap tahunnya didapat dengan cara mengurangkan angka indeks dengan angka 100.
Pertumbuhan PDRB atas dasar harga berlaku sebenarnya belum bisa menggambarkan pertumbuhan yang sebenarnya karena masih dipengaruhi oleh perubahan harga yang naik turun. Maka untuk mengetahui petumbuhan PDRB atau
Differences in rates of GRDP growth at current prices and GRDP at constant prices is due to the price change that occurred in the market.
3.3. Economic Growth
3.3.2. GDRP Growth in Current Price
GRDP growth is the ratio between GRDP values for the year to the value of GRDP in the previous year. This value is obtained from calculating the GRDP chain index by dividing GRDP value this year with GRDP value of the previous year multiplied by 100 percent. To see the value results of chain index can be seen in attachment in Table 1.7 for the index based on current prices and Table 1.8 for the index at constant prices.
Annual GRDP growth rate
obtained by subtracting the index numbers with the numbers 100.
GRDP growth at current prices cannot really describe the real growth because it is still influenced by price changes. So to know the GRDP growth or economic growth in an area used GRDP growth based on constant price.
Produk Domestik Regional Bruto Kabupaten Semarang Menurut Lapangan Usaha
21
Pertumbuhan ekonomi di suatu daerah dipakai pertumbuhan PDRB Atas Dasar Harga Konstan.
Pertumbuhan PDRB atas dasar harga berlaku Tahun 201 2 sebesar 12,24 persen. Angka ini menunjukkan adanya peningkatan pertumbuhan jika dibandingkan dengan pertumbuhan Tahun 2011 yang mempunyai pertumbuhan sebesar 11,42 persen. Pada pertumbuhan atas dasar harga berlaku, kenaikan nilai PDRB selain dipengaruhi oleh tumbuhnya produktifitas sektor -sektor ekonomi, juga didorong oleh kenaikan harga barang dan jasa. Hal ini terlihat dari besarnya inflasi PDRB yang mencapai 5,87 persen.
Pertumbuhan PDRB atas dasar harga berlaku terbesar terjadi di sektor jasa -jasa yang tumbuh sebesar 15,63 persen, disusul sektor pertanian yang tumbuh 14,69 persen, sektor perdagangan, rumah makan, dan jasa akomodasi yang tumbuh 12,53 persen, dan sektor konstruksi 12,22 persen. Pertumbuhan terkecil terjadi di sektor penggalian yang tumbuh 3,00 persen dan sektor listrik, gas, dan air yang tumbuh sebesar 5,21 persen. Secara berurutan pertumbuhan sektor -sektor dapat dilihat sebagai berikut:
The growth of GRDP at current prices in 2012 amounted to 12.24 percent. This figure shows that the growth is higher than the growth in 2011 which reached 11.42 percent. On growth at current price, the increase of GRDP besides influenced by growth of economic sectors productivity also influence boosted by price increase of goods and services. It is seen from the GRDP inflation that reached 5.87 percent.
Sector which has largest growth is services sector with growth 15,63 percent, followed by agriculture sector which grew 14.69 percent, trade, restaurants and accomodation services with 12.53 percent growth, and construction sector which has 12.2 percent growth. The lowest growth is quarrying sector whish increase 3.00 percent over the previous year and the electricity, gas and water supply with 5.21 percent. Sequentially growth sectors can be seen as follows:
22
Produk Domestik Regional Bruto Kabupaten Semarang Menurut Lapangan Usaha Tabel 3.3.1Pertumbuhan Tiap Sektor Ekonomi atas Dasar Harga Berlaku di Kabupaten Semarang Tahun 2010-2012 (%)
Economic Growth by Sectoral at Current Price in Semarang Regency 2010-2012(%)
Sektor Ekonomi Pertumbuhan
2010 2011 2012
(1) (2) (3) (4)
Pertanian / Agriculture 11,22 10,23 14,69
Penggalian / Quarrying 15,91 9,70 3,00
Industri / Industri 8,64 11,26 11,04
Listrik, Gas, dan Air Bersih/ Electricity, Gas
& Water Supply 11,75 17,88 5,21
Bangunan / Construction 12,79 13,00 12,22
Perdagangan, rumah makan, dan js.
Akomd / Trade, Reataurant & Hotel 10,39 11,02 12,53
Angkutan dan Komunikasi / Transport &
Communication 7,93 18,32 09,07
Lemb. Keuangan dan Jasa Perusahaan /
Financial Inst, Ownership & Bussiness Serv 10,46 11,46 11,62
Jasa-Jasa/ Services 12,27 11,38 15,63 14,69 3 11,04 5,21 12,22 12,53 9,07 11,62 15,63 Grafik 3.3.1
Pertumbuhan Ekonomi Per Sektor Adh Berlaku di Kabupaten Semarang Tahun 2012 (%)
Ecoomic Growth by Sectoral in Semarang Regency 2012
Produk Domestik Regional Bruto Kabupaten Semarang Menurut Lapangan Usaha
23
Untuk sektor pertanian pertumbuhan PDRB atas dasar harga berlaku sebesar 14,69 persen, lebih tinggi dibandingkan pertumbuhan tahun sebelumnya yang sebesar 10,23 persen. Untuk sektor pertanian, pertumbuhan tertinggi terjadi di subsektor kehutanan yang tumbuh sebesar 41,87 persen dan sub sektor perikanan yang tumbuh 25,86 persen. Namu n pertumbuhan dikedua sub sektor tersebut tidak memberikan kontribusi yang signifikan terhadap pertumbuhan sektor pertanian karena kontribusi kedua sebsektor tersebut kecil dibandingkan sub sektor yang lainnya.
GRDP growth for agriculture sector at current price is 14.69 percent, higher than previous year which has 10.23 percent. In this sector, the highest growth occured in forestry with 41.87 percent growth and fisheries grew 25.86 percent. However, growth in both subsector do not contribute significantly to the agriculture sector becouse of the contribution of both subsector are small than other subsector.
Tabel : 3.3.2
Pertumbuhan Sub Sektor Pertanian di Kabupaten Semarang Tahun 2012
Economic Growth by Agriculture Sub Sectoral in Semarang Regency 2012 Sub Sektor Pertumbuhan (persen) /
Growth (percent) (1) (2) Tanaman Pangan Perkebunan Peternakan Kehutanan Perikanan 14,30 11,72 10,21 41,87 25,86
24
Produk Domestik Regional Bruto Kabupaten Semarang Menurut Lapangan Usaha 3.3.2 Pertumbuhan PDRB atasdasar harga konstan
Pertumbuhan PDRB atas dasar harga konstan lebih bisa menggambarkan pertumbuhan yang sebenarnya jika dibandingkan dengan pertumbuhan PDRB atas dasar harga berlaku. Dalam penghitungan atas dasar harga konstan yang dihitung adalah hasil produksinya, tanpa mel ihat adanya perubahan harga yang terjadi. Harga yang digunakan adalah harga pada tahun dasar, yaitu dalam hal ini adalah harga di Tahun 2000. Dengan begitu pertumbuhan yang dihasilkan adalah pertumbuhan riil produktifitas sektor-sektor ekonomi yang ada di Kabupaten Semarang.
Laju pertumbuhan ekonomi Kabupaten Semarang empat tahun terakhir sudah menunjukkan angka yang cukup bagus, dimana laju pertumbuhan ekonomi mencapai kisaran angka di atas 4 persen, bahkan di Tahun 2012 pertumbuhannya sudah mencapai angka di atas 6 persen. Pertumbuhan ekonomi Kabupaten Semarang dalam 5 tahun terakhir dapat dilihat pada tabel dan grafik berikut:
3.3.2. GDRP Growth in Constant Price
Growth in GDRP at constant prices describes the actual growth compared with GDRP growth at current prices. This is because the GDRP at constant prices using a price fixed from year to year so that price changes do not affect the calculation. In the counting growth at current price, that is price in 2000, it just counts the value of the product without prices in every year. This growth shown the real growth of economic sectors in Semarang Regency.
The rate of economic growth in Semarang regency last four years have shown a fairly good rate, which climbed to an average rate of economic growth rates above 4 percent and in 2012 economic growth reach 6 percent. Economic growth of Semarang Regency in last 5 year can be seen in table and graphic below:
Produk Domestik Regional Bruto Kabupaten Semarang Menurut Lapangan Usaha
25
Tabel : 3.3.3Pertumbuhan Ekonomi Kabupaten Semarang Tahun 2008-2012
Economic Growth of Semarang Regency 2008-2012 Tahun/
Year
Pertumbuhan Ekonomi (persen) /
Economic Growth (percent)
(1) (2) 2008 2009 2010 2011 2012 4,26 4,37 4,90 5,56 6,02 Grafik : 3.3.2
Pertumbuhan Ekonomi Kabupaten Semarang Tahun 2008-2012
Economic Growth Of Semarang Regency 2008-2012
Pertumbuhan tertinggi persektor terjadi pada Sektor Jasa-jasa yang tumbuh sebesar 10,57 persen, disusul Sektor Pertanian yang tumbuh 8,28 persen, dan Sektor Konstruksi yang tumbuh sebesar 7,20
If the observed percentage of growth per sector at constant prices in 2010, all sectors have growth rate below 10 percent. The largest growth occurred in the sector of construction amounted to 9,31 percent, and
4,26 4,37 4,9 5,56 6,02 0 1 2 3 4 5 6 7 2008 2009 2010 2011 2012