PERFORMANCE EVALUATION OF THREE DIFFERENT HIGH RESOLUTION
SATELLITE IMAGES IN SEMI-AUTOMATIC URBAN ILLEGAL BUILDING
DETECTION
N. Khalilimoghadam a, M. R. Delavar b, *, P. Hanachi c
a MSc. Graduate, GIS Dept., School of Surveying and Geospatial Eng., College of Eng., University of Tehran, Tehran, Iran - [email protected]
b Centre of Excellence in Geomatic Eng. in Disaster Management, School of Surveying and Geospatial Eng., College of Eng., University of Tehran, Tehran, Iran - [email protected]
c School of Architecture, College of Fine Arts, University of Tehran, Tehran, Iran - [email protected]
Commission IV, WG IV/3
KEY WORDS: Semi-automatic Urban Illegal Building Detection, GeoEye-1, IRS-P5, QuickBird, Pixelwise Fuzzy XOR Operator, Performance Evaluation
ABSTRACT:
The problem of overcrowding of mega cities has been bolded in recent years. To meet the need of housing this increased population, which is of great importance in mega cities, a huge number of buildings are constructed annually. With the ever-increasing trend of building constructions, we are faced with the growing trend of building infractions and illegal buildings (IBs). Acquiring multi-temporal satellite images and using change detection techniques is one of the proper methods of IB monitoring. Using the type of satellite images with different spatial and spectral resolutions has always been an issue in efficient detection of the building changes. In this research, three bi-temporal high-resolution satellite images of IRS-P5, GeoEye-1 and QuickBird sensors acquired from the west of metropolitan area of Tehran, capital of Iran, in addition to city maps and municipality property database were used to detect the under construction buildings with improved performance and accuracy. Furthermore, determining the employed bi-temporal satellite images to provide better performance and accuracy in the case of IB detection is the other purpose of this research. The Kappa coefficients of 70%, 64%, and 68% were obtained for producing change image maps using GeoEye-1, IRS-P5, and QuickBird satellite images, respectively. In addition, the overall accuracies of 100%, 66%, and 83% were achieved for IB detection using the satellite images, respectively. These accuracies substantiate the fact that the GeoEye-1 satellite images had the best performance among the employed images in producing change image map and detecting the IBs.
* Corresponding author
1. INTRODUCTION
The Illegal Building (IB) detection and monitoring has been in the spotlight in the recent decades due to the increase of construction in mega cities. The currently used method of IB monitoring is mainly based on the presence of human operator and searching all over the city randomly (Saremizadeh, 2012). Obviously, this method is cost, time, man power and petrol consuming and may be ended in untimely detection of IBs or collusion between municipality inspectors and constructors in order not to report the building infractions. This is despite the fact that the IB detection should be accurate and timely to prevent the continuation of these kinds of building constructions in the shortest possible time (Saremizadeh, 2012).
Another method of IB detection, which has been taken into consideration in the recent years, is based on using high-resolution satellite images, automatic changed detection methods, and image processing techniques (Khalili Moghadam et al., 2015). Less intervention of the human operator (municipality inspectors), time saving, and cost effectiveness are the main advantages of this method. This semi-automatic method of IB detection has been developed to cover the problems of previous methods of IB monitoring. However, using the type of satellite images in IB detection process in order to achieve higher accuracies has long been an important
question in semi-automatic IB detection projects. Since the spatial and spectral resolution of satellite images affect the IB detection accuracy, it was decided to implement three IB detection processes with three different bi-temporal satellite images in an urban area in this research to compare the obtained accuracies of the IB detection processes. Therefore, this paper intends to investigate the satellite images, which may provide better results in the IB detection process by comparing the obtained accuracies of the three bi-temporal satellite images.
developed an adaptive strategy for seed location and regional growth to accomplish the course detection of buildings.
Zhu et al. (2015) presented a feature line based method for building detection and reconstruction from oblique airborne imagery. They concluded that low quality model can be refined by the accuracy improvement of mesh feature lines and rectification with feature lines of multi-view images. Karantzalos et al. (2015) developed a model based on building detection technique, which was able to extract and reconstruct buildings from Unmanned Aerial Vehicles (UAV) aerial imagery and low-cost imaging sensors. Singhal and Radhika (2014) proposed a method for detecting the buildings from high-resolution colour aerial images using colour invariance property and canny edge detection technique. Pang et al. (2014) proposed an automatic method that applies object-based analysis to multi-temporal point cloud data to detect building changes. Their aim was to identify areas that have changed and to obtain from-to-information.
Yu et al. (2014) proposed a method based on corner detectors in detecting shadow and buildings. They also employed Harris corner detector in region-based detection, despite that Harris detector traditionally used to select pixels as final results. Aytekin et al. (2012) developed a generic algorithm for automatic extraction of buildings and roads from complex urban environments in high-resolution satellite images where the extraction of both object types at the same time enhances the performance. Qin et al. (2015) investigated the possibility of using high-temporal stereo Very High Resolution (VHR) images to enhance remote-sensing image interpretation under the context of building detection. Their research demonstrated that spatio-temporal inference filtering largely improves the accuracy of the building probability map while facilitating building extraction in snow-covered images.
Khurana and Wadhwa (2009) used modified grab cut partitioning algorithm to detect buildings in satellite images. They also used bio-inspired optimization, which will find a global optimal solution for maximum energy better than minimum-maximum algorithm. Stasolla and Gamba (2007) detected the human settlement using SPOT data in arid environments with stress on informal settlement analysis. They showed that a proper use of spatial patterns may improve the delineation of the extent of these areas and the discrimination between formal and informal settlements. Bayburt et al. (2008) detected the IBs around the Istanbul water catchments using pansharpened IKONOS images with 3 months repetition rate in the Greater Istanbul municipality area.
Asmat et al. (2012) presented the results of legal and illegal settlement extraction in Pulau Gaya, Sabah using high resolution QuickBird and SPOT-5 multi-spectral imageries using automated house detection technique. The technique developed is spatial-based using tree counting approach. Shekhar (2012) detected the slums of Pune city by describing typical characteristics of these settlements by using eCognition software from QuickBird data based on an object-oriented approach. They were able to classify and separate the slums from the non-slum places with more than 80% accuracy. Khalili Moghadam et al. (2015) proposed a new pixel-based method of IB detection using the unsupervised K-means clustering technique, the city maps, and the municipal property data base. They were able to detect some of the IBs and buildings, which were under construction in the urban area of west of Tehran.
In this research, three different bi-temporal high resolution satellite images of GeoEye-1, IRS-P5, and QuickBird sensors from a metropolitan part of west of Tehran were used to detect the buildings which are under construction and IBs. In addition, the city maps at the scale of 1:2000 and an up to date municipal property data base that contains the existing buildings of the study area were used to detect the IBs using a conflation of pixelwise fuzzy XOR1 operator in change detection (Ilsever and Unsalan, 2012) and some GIS analyses. It is also assumed that the municipality database during the acquisition time of satellite images is complete and up to date.
In section 2, the methodology of the research is presented. Section 3 illustrates three case studies undertaken in the same area in a part of west of Tehran using three different bi-temporal satellite images with different spatial and spectral resolutions. Finally, section 4 concludes the paper.
2. METHODOLOGY
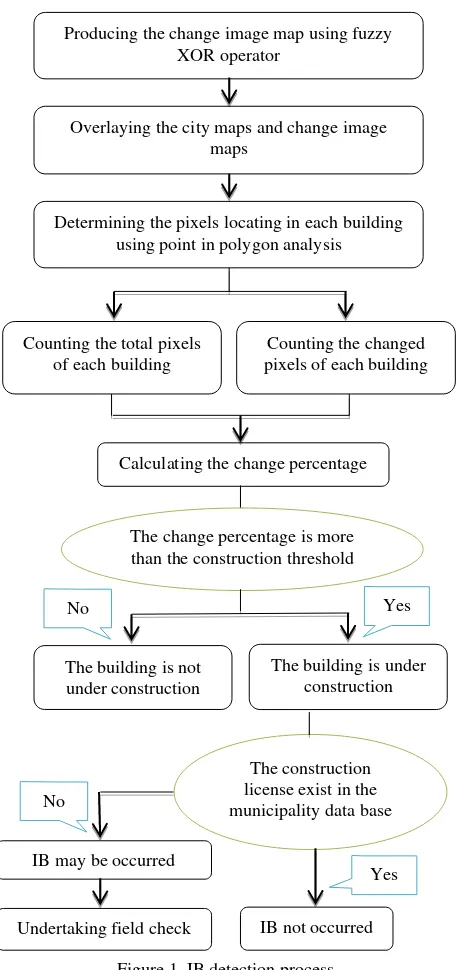
In this paper a process of detection of IBs and under construction buildings based on the integration of fuzzy change detection technique (using pixelwise fuzzy XOR in satellite images change detection (Ilsever and Unsalan, 2012)) and GIS2 spatial analyses (point in polygon analysis and overlaying the map and images) is proposed. Figure 1 represents the flowchart of IB detection, which is used in this research.
As it can be seen in Figure 1, firstly, the change image map is produced using fuzzy XOR operator. Consequently, changed and unchanged labels are allocated to all pixels. In the next step, the city maps and the produced change image map are overlaid. Afterward, the pixels locating in each building are determined using point in polygon analysis (Worboys and Duckham, 2004). Therefore, all pixels locating in each building in addition to the total number of changed pixels of each building can be counted. In the next step, the change percentage for each building is computed separately by calculating the ratio of changed pixels to total number of pixels of each building. On the other hand, with the consideration of the permitted building density percentage of the total building area based on the municipality rules of the study area, a change threshold should be introduced to the software to detect the buildings, which are under construction (Khalili Moghadam et al., 2015). Finally, the buildings, which are under construction are detected by the comparison of the mentioned percentage with the defined threshold. That means, if the computed percentage is more than the standard permitted change threshold, the building is considered as under construction. Finally, the unique identification numbers (IDs) of the detected buildings should be searched in the up to date municipal spatial property database in order to find out whether those building had the construction license or not. If the construction license is not granted in the data base, the building is categorized as a suspected IB. Afterward, a field check should be undertaken to investigate whether the suspected IBS were truly detected or not.
There are a number of change detection techniques that can be applied in order to produce change image map. Pixelwise fuzzy XOR operator is one of the accurate fuzzy methods of change detection that can be used in producing change image map of satellite images which is used in this research. High accuracy
1 Fuzzy exclusive or
and speed in detecting the changed areas in the bi-temporal satellite images are the main advantages of the pixelwise fuzzy XOR operator method (Ilsever and Unsalan, 2012). On the other hand, since speed and accuracy are the most important factors in IB detection projects, using the mentioned method will help to achieve the goals of municipalities in detecting the IBs on time.
Figure 1. IB detection process
Satellite images are composed of pixels with values p(x, y) in a certain range (mostly [0, 255]) in one band (panchromatic) or several bands (multi-spectral). Normalizing these values and mapping them to the range [0, 1] effectively translates the image into a fuzzy set. Therefore, the pixel gray values should be divided to 255 in order to normalize the pixel gray levels, whose elements (pixels) have membership grades in proportion
to their “whiteness” (Ilsever and Unsalan, 2012). The
membership grade g(x, y) of each pixel p(x, y) in the grayscale
image G is thus defined by the fuzzy membership function μG (Ilsever and Unsalan, 2012):
(1)
where G = grayscale image
μG(x,y) = fuzzy membership function of p(x,y) in image G
According to Equation (1), if the fuzzy membership function of a pixel is exactly equal to one, that pixel is entirely white. On the other hand, if a pixel fuzzy membership function is equal to zero, that pixel is totally black. Furthermore, the fuzzy membership function values from one to zero, are highlighted from white to black, respectively.
It should be noted that the complement of a fuzzy set is denoted by and is formulated using Equation (2) (Zadeh, 1965):
(2)
In addition, the intersection of two fuzzy sets is calculated using the algebraic product of these two membership values as (Zadeh, 1965): benchmark. Its fuzzy version is used for change detection. The measure of change between two pixels p1 and p2 is given by
the degree of truth of the following statement: either “p1 is lighter AND p2 is darker” OR “p1 is darker AND p2 is lighter”; which can be rephrased as, either “p1 has a high membership
grade AND p2 has a low membership grade” OR “p1 has a low membership grade AND p2 has a high membership grade.”
Consequently, the above fuzzy rule can be formulated as (Ilsever and Unsalan, 2012):
(4)
where = fuzzy change membership function of p(x,y) = fuzzy membership function of p(x,y) in
Producing the change image map using fuzzy XOR operator
Overlaying the city maps and change image maps
take values between [0, 1]. The decision of a significant change can be made by means of applying an appropriate threshold and converting C(x, y) to a crisp YES/NO value. Experiments have shown that, the results from the two fuzzy AND operations are distributed in a way that automatically indicates an appropriate threshold for defuzzification (Ilsever and Unsalan, 2012). More explicitly, threshold values are obtained for both fuzzy AND operations from equation (5) (Ilsever and Unsalan, 2012).
(5)
where Ha = histogram of the corresponding fuzzy AND operation
σa = standard deviation of the corresponding fuzzy AND operation
= defuzzification threshold
If the calculated C(x, y) become more than the calculated threshold, that pixel will be categorized as a changed pixel. Otherwise, the pixel is classified as an unchanged one.
3. CASE STUDY
In this research, three bi-temporal high resolution satellite images of GeoEye-1, IRS-P5, and QuickBird sensors acquired from the same part of west of Tehran metropolitan area which covers approximately 32.054 hectares located between 516967 E, 517407 E and 3954472.5 N, 3955201 N, UTM3 Zone 39 were used in order to detect the IBs.
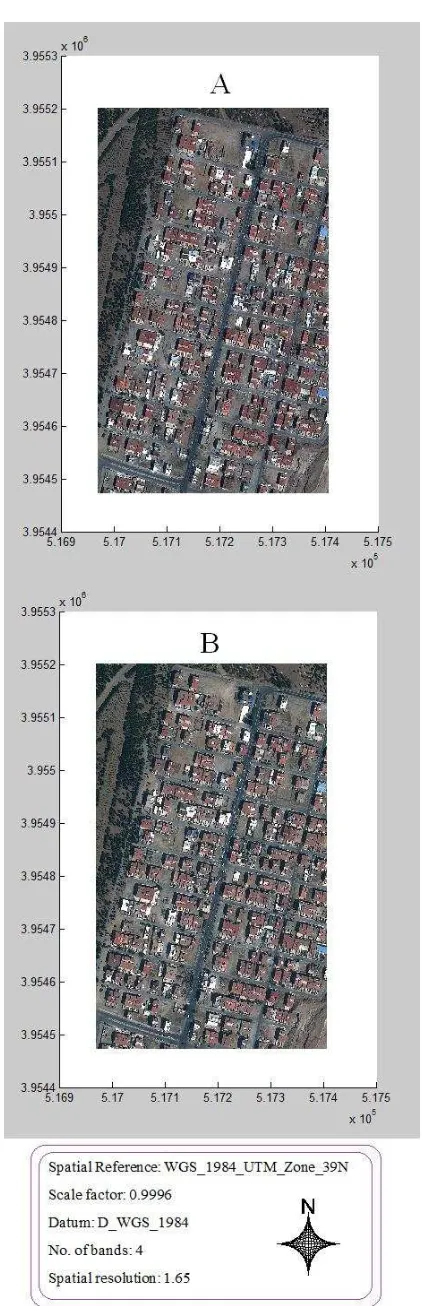
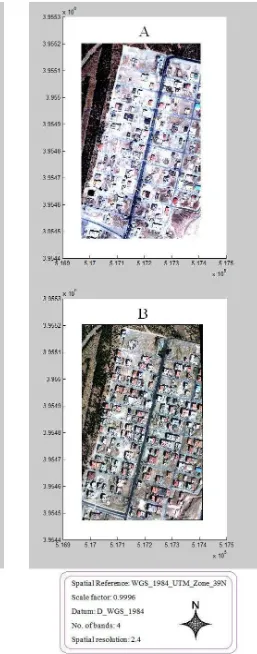
The GeoEye-1 satellite images which were used as one of bi-temporal satellite images in this research are composed of four bands (blue, green, red, and near IR) with the spatial resolution of 1.65 meters acquired from the study area at March 25, 2013 and October 16, 2013, respectively. In addition, the IRS-P5 satellite images are composed of only one band4 with the spatial resolution of 2.5 meters, which were acquired at June 3, 2010 and October 3, 2010, respectively. Finally, the QuickBird satellite images are composed of four bands (blue, green, red, and near IR) with the spatial resolution of 2.4 meters acquired at February 4, 2007 and March 11, 2011 respectively from the study area. The bi-temporal satellite images of GeoEye-1, IRS-P5, and QuickBird sensors are shown in Figures 2, 3, and 4, respectively. Furthermore, the city maps at a scale of 1:2000 and an up to date spatial database that contains the existing buildings of the study area were used to develop a geospatial information system in order to detect the IBs. The city map is shown in Figure 5.
In the pre-processing step, the images were radiometrically corrected in two steps. Firstly, atmospheric corrections were applied, followed by topographic normalization. To eliminate the effects of the atmosphere such as scattering and haze, and to define the extent of clouds and cloud shades, the ENVI software package was used (even though the satellite images were covered approximately with less than 5% cloud). On the other hand, for the topographic normalization, the developed method by Zaksek et al. (2015) was used.
3 Universal Transvers Mercator 4 Panchromatic
Figure 2. The first satellite image of GeoEye-1 acquired at March 25, 2013 (A), and the second satellite image of
Figure 3. The first satellite image of IRS-P5 acquired at June 3, 2010 (A), and the second satellite image of IRS-P5 acquired at
October 3, 2010 (B)
Figure 4. The first satellite image of QuickBird acquired at February 4, 2007 (A), and the second satellite image of
Figure 5. The city map
In order to correct the images geometrically using the empirical method, the ENVI software was used. The first satellite image of GeoEye-1 was geo-referenced to the city maps with the RMS error of 0.40 pixel size (calculated in ENVI software) using 25 Ground Control Points5 evenly distributed in the image, undertaking a nearest neighbour resampling method. Then, the second satellite image of GeoEye-1 was geo-referenced to the first one using the mentioned method with the RMS error of 0.36 pixel size. In addition, the IRS-P5 satellite images were geo-referenced using the same method with the RMS errors of 0.83 and 0.55 pixel size (calculated in ENVI software) for the first and second images, respectively. Moreover, the QuickBird satellite images were geo-referenced using the mentioned method with the RMS errors of 0.53 and 0.49 pixel size (calculated in ENVI software) for the first and second images, respectively.
It should be noted that a generic approach was applied to extract the best set of GCPs from the set of original GCPs to improve the accuracy of geometric correction model (Nguyen, 2015). Furthermore, to maintain the geometry of the captured image, the images were transformed by an ortho-rectification process. Ortho-rectification, converts an image obtained at an arbitrary roll-pitch-yaw of the camera to one as if obtained when roll, pitch, and yaw were all zero (Dave et al., 2015). Ortho-rectified images are easier to register and analyse because these are not geometrically distorted (Dave et al., 2015). On the other hand, in the IB detection process using satellite images and image processing techniques, orthorectified images
5 Ground Control Points (GCPs)
will end in better results, since the satellite images and the city maps are overlaid more accurately and the shadow effect has less impact on determining the changed areas in the images.
Therefore, to reach the mentioned goals and to decrease the shadow effects, all of the bi-temporal satellite images were orthorectified in the pre-processing step.
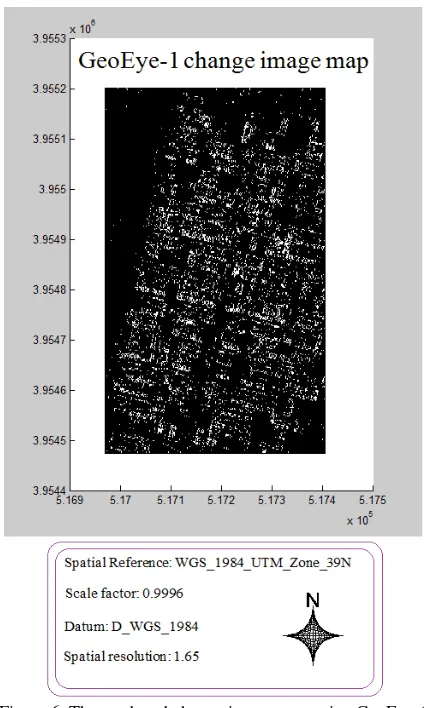
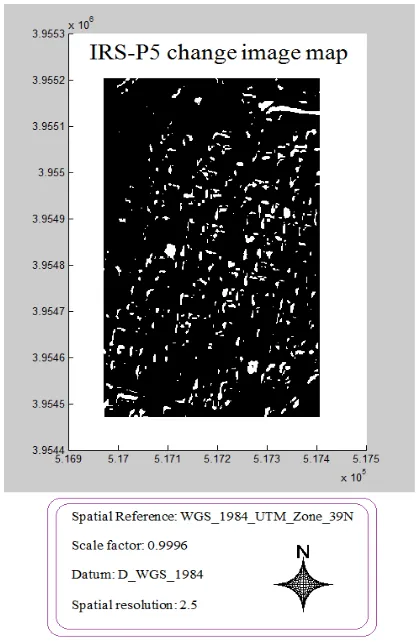
The pixelwise fuzzy XOR operator method of automatic change detection was coded in MATLAB software to produce the change image maps. Three bi-temporal satellite images in addition to city maps were imported to the software to produce three different change image maps using the implemented method. The produced change image maps using GeoEye-1, IRS-P5, and QuickBird bi-temporal satellite images are shown in Figures 6, 7, and 8, respectively. In these Figures, the changed and unchanged pixels are shown with white and black colours, respectively.
Figure 6. The produced change image map using GeoEye-1 satellite images
Figure 7. The produced change image map using IRS-P5 satellite images
Figure 8. The produced change image map using QuickBird satellite images
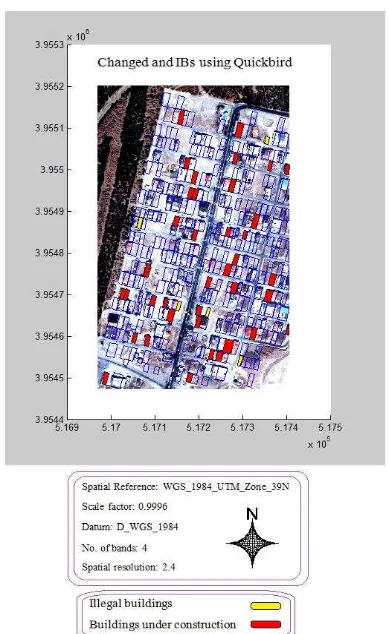
According to the municipality rules of the study area, it was permitted to construct 60% building density of the total area of the houses. This 60% allowable density of construction, restricts the constructors not to build over this percentage, which means that 40% density of the total area of any house should be yard. Construction over 60% or in the yard is forbidden. Therefore, the threshold of 40% was considered as the construction change threshold to detect the buildings which are under construction in this research. Consideration of the change threshold lower that 40%, experimentally does not act correctly since the changes lower that 40% of total area of any house, might have occurred because of unimportant changes such as changes in the positions of cars in the yard of the houses. On the other hand, consideration of change threshold more than 40% experimentally is not reasonable, too; as some of the IBs might be undetected using the mentioned threshold. With consideration of this threshold (40%), the under construction buildings were detected. Then, the unlicensed buildings were detected undertaking a query from the municipality property data base in order to detect the IBs. Finally, a field check was undertaken to determine whether the suspected buildings, which were detected as IBs were truly detected as IBs or not. The under construction buildings and the IBs, which were detected using GeoEye-1, IRS-P5, and QuickBird bi-temporal satellite images are shown in Figures 9, 10, and 11, respectively. In these Figures, the under construction and illegal buildings are shown with red and yellow polygons, respectively.
Figure 10. The detected under construction buildings and IBs using IRS-P5 satellite images
Figure 11. The detected under construction buildings and IBs using QuickBird satellite images
The overall accuracy is the mean of classification accuracy (Njoku, 2014). It is the ratio of correctly classified elements to total number of elements. Whereas, the kappa coefficient calculates the clustering accuracy compared to a totally random clustering (Congalton, 1991). The results of the proposed method in this research were compared with the ground truth data and accordingly the overall accuracies and kappa coefficients of the produced change image maps were computed. Furthermore, the overall accuracies of detecting the IBs and under construction buildings were computed. Some information about the detection of IBs, detection of buildings which were under construction, and the production of change image maps using the pixelwise fuzzy XOR operator method are represented in Table 12.
Statistics \ Satellite images GeoEye-1 IRS-P5
Quick Bird Overall accuracy of producing
change image map (%)
99 92 97
Kappa coefficient of producing change image map (%)
70 64 68
Total no. of buildings located in the image
338 338 338
No. of detected buildings as under construction (licensed and unlicensed buildings)
16 21 41
No. of under construction buildings according to the DB
during the research time
14 24 45
Accuracy of under construction building detection (%)
93 83 89
No. of detected IBs 2 2 5
No. of unlicensed buildings according to the DB during the
image acquisition time
2 3 6
Accuracy of IB detection according to municipality DB
(%)
100 66 83
Table 12. The research statistics
4. CONCLUSION
A conflation of GIS data layers (city maps), satellite images and image processing techniques were used to detect the IBs. Using each of bi-temporal satellite images (GeoEye-1, IRS-P5, and QuickBird) in the three change detection processes, three different change image maps were produced. A conflation of pixelwise fuzzy XOR operator change detection method and GIS analyses (including point in polygon and overlaying analyses) were used to detect buildings changes and IBs in the study area.
According to the results, the GeoEye-1 satellite images had the best performance among all bi-temporal satellite images in producing change image map for detecting under construction buildings and IBs. On the other hand, the IRS-P5 images had the worst performance among other satellite images in three afore-mentioned fields. These statistics verify the fact that using satellite images with better spatial and spectral resolutions can lead to in more accurate production of change image map and detection of IBs.
It should be noted that a number of parameters will affect the final results. As an example, the errors in geometric corrections will have a negative impact on the final results which was inevitable in this research. On the other hand, different conditions of satellite images in the acquisition time will cause different conditions of illumination in the images. In such situations, the positions of shadows will be different. Therefore, using satellite images with the same acquisition time and conditions will increase the final accuracies that were taken into consideration in this research since the bi-temporal satellite images were acquired approximately at same time during the day.
ACKNOWLEDGEMENTS
The support of National Geographical Organization (NGO) for providing the bi-temporal panchromatic satellite images of IRS-P5 and Tehran municipality for providing two bi-temporal satellite images of GeoEye-1 and QuickBird, the statistics of building construction, and the city maps are highly appreciated. The authors would like to acknowledge the financial support of Department for research, University of Tehran under Grant No. 8103002/6/49.
REFERENCES
Asmat, A., Zamzami, S. Z., and Mansur, S., 2012. The use of multi-sensor for illegal human settlement detection. Asian Journal of Environment-Behavior Studies, 3 (10), pp. 71-80.
Aytekin, O., Erener, A., and Ulusoy, I., 2012. Unsupervised building detection in complex urban environments from multispectral satellite imagery. International Journal of Remote Sensing, 33 (7), pp. 2152-2177.
Bayburt, S., Buyuksalih, G., and Baz, I., 2008. Detection of changes in Istanbul area with medium and high resolution space images. The International Archives of the Photogrammetry, Remote Sensing and Spatial Information Science, 17, pp. 1607-1612.
Chen, D., Shang, S., and Wu, C., 2014. Shadow-based building detection and segmentation in high resolution remote sensing images. Journal of Multimedia, 9 (1), pp. 181-188.
Congalton, R.G., 1991. A review of assessing the accuracy of classifications of remotely sensed data. Remote sensing of environment,37(1), pp.35-46.
Dave, C. P., Joshi, R., and Srivastava, S. S., 2015. A survey on geometric correction of satellite imagery. The International Journal of Computer Applications, 16 (12), pp. 24-27.
Ilsever, M. and Unsalan, C., 2012. Two Dimensional Change Detection Methods. Remote Sensing Applications, Springer London Heidelberg New York Dordrecht.
Ioannidis, C., Psaltis, C., and Potsiou, C., 2009. Towards a strategy for control of suburban informal buildings through automatic change detection. Journal of Computers, Environment and Urban Systems, 33 (1), pp. 64-74.
Karantzalos, K., Koutsourakis, P., Kalisperakis, I., and Grammatikopoulos, L., 2015. Model-based building detection from aerial low-cost optical sensors on-board unmanned aerial vehicles. The International Archives of the Photogrammetry, Remote Sensing and Spatial Information Science, XL-1/W4, pp. 293-297.
Khalili Moghadam, N., Delavar, M. R., and Hanachi, P., 2015. Automatic urban illegal building detection using multi-temporal satellite images and geospatial information systems. The International Archives of the Photogrammetry, Remote Sensing and Spatial Information Sciences, XL-1/W5, Kish Island, Iran, Nov. 23-25, 2015, pp. 387-393.
Khurana M. and Wadhwa, V., 2015. Automatic building detection using modified grab cut algorithm from high resolution satellite image. International Journal of Advanced Research in Computer and Communication Engineering, 4 (8), pp. 158-164.
Li, Y., Wu, H., An, R., Xu, H., He, Q., and Xu, J., 2013. An improved building boundary extraction algorithm based on fusión of optical imagery and LIDAR data. International Journal for Light and Electron Optics, 124, pp. 5357-5362.
Nguyen, T., 2015. Optimal ground control points for geometric correction using genetic algorithm with global accuracy. European Journal of Remote Sensing, 48, pp. 101-120.
Njoku, E. G., 2014. Encyclopaedia of Remote Sensing. Springer-Verlag New York Inc., 939 p.
Pang, S., Hu, X., Wang, Z., and Lu, Y., 2014. Object-based analysis of airborne LIDAR data for building change detection. International Journal of Remote Sensing, 6 (11), pp. 10733-10749.
Qin, R., Tian, J., and Reinartz, P., 2015. Spatiotemporal inferences for use in building detection using series of very-high-resolution space-borne stereo images. International Journal of Remote Sensing, 37 (15), pp. 3455-3476.
Saremizadeh, M. F., 2012. Complete sets of rules and regulations relating to the municipality (in Persia). Municipality of Shiraz. Shiraz, Iran. 512 p.
Shekhar, S., 2012. Detecting slums from QuickBird data in Pune using an object oriented approach. International Archives of the Photogrammetry, Remote Sensing and Spatial Information Sciences, XXXIX-B8, Melbourne, Australia, 25 August – 01 September, 2012, pp. 519-524.
canny edge detection. International Journal of Engineering Trends and Technology, 11 (8), pp. 393-396.
Stasolla, M. and Gamba, P., 2007. Exploiting spatial patterns for informal settlement detection in arid environments using optical space born data, The International Archives of the Photogrammetry, Remote Sensing and Spatial Information Sciences, 3/W49A, Munich, Germany, Sept. 19-21, pp. 31-36.
Worboys, M. F. and Duckham, M., 2004. GIS: A Computing Perspective. 2nd Eddition, CRC Press, 448 p.
Yu, B., Wang, L., and Niu, Z., 2014. A novel algorithm in building/shadow detection based on Harris detector. International Journal for Light and Electron Optics, 125 (2), pp. 741-744.
Zadeh, L.A., 1965. Fuzzy sets. Information and Control, 8 (3), pp. 338-35.
Zaksek, K., Cotar, K., Veljanovski, T., Pehani, P. and Ostir, K., 2015. Topographic correction module at STORM (TC@ STORM). The International Archives of Photogrammetry, Remote Sensing and Spatial Information Sciences, 40(7), p.721.