QoE-Based Energy Reduction by Controlling the 3G
Cellular Data Traffic on the Smartphone
Selim Ickin
School of Computing Blekinge Institute of Technology
Karlskrona, SWEDEN Email: [email protected]
Katarzyna Wac
Institute of Services Science University of Geneva Geneva, SWITZERLAND Email: [email protected]
Markus Fiedler
School of Computing Blekinge Institute of Technology
Karlskrona, SWEDEN Email: [email protected]
Abstract—One of the most influencing factors on the overall end-user perceived quality from applications and services, i.e., QoE, running on the smartphones is their limited battery life. Particular cloud-based applications/services on the smartphone with a constrained battery life might consume high energy even when the smartphone is in screen-OFF state. The cellular radio module of the smartphone is one of the most power-consuming components, which depends on the running applications’ informa-tion polling characteristics that eventually cause the radio module to toggle occasionally between the cellular data energy states even during a sleep state.
In this paper, we investigate the energy consumption of a set of applications that tend to retain up-to-date information via aggressive polling patterns. We show that limiting the network traffic and increasing the resource utilization efficiency amongst the applications and services can highly reduce the total energy consumption. We control the network activity of a smartphone with different cellular data-enabled anddata-disabled durations at the screen-OFF state. First, we run controlled-lab energy measurements to have a ground truth on the power consumption patterns of a set of cloud-based popular applications/services; and next we conduct a subjective study with our proposed solution (ExpCO2), to understand first the user behaviour on the smartphone and then present how the reduced polling intervals of applications and notifications influence the end-user perceived quality. We indicate that ExpCO2 has a potential to save energy.
I. INTRODUCTION
The user perceived quality of the mobile applications de-pends on the total energy consumption of the mobile handheld terminals, as the duration of user service time depends on the lifetime of the capacity-limited batteries [1]. There are huge efforts in industry and in academia dedicated to improve the battery life, however those efforts remain isolated on specific
particular domains,e.g., software, hardware, and radio network
without consideration of the other domains [2]. The software domain needs responsibility in energy-efficient application and service development, otherwise might cause lower end-user
perceived quality,e.g., Quality of Experience (QoE), resulting
in users giving up using particular apps [4]. An energy-efficient app is described in [2] as an app that is adopted to the characteristics of the cellular network, while minimizing the number of required connections and reducing the total con-nection duration to the network. The effectiveness of a system is achieved when there is an appropriate balance between the functionality [9] (a set of actions/services offered to the users [8]), and the usability (degree by which the system can be used efficiently and properly performing goals [8]). In order for
the application/service to lead to a high user-perceived quality, the cloud-based application developers need to reconsider their designs to minimize energy consumption and maximize QoE. As the radio cellular data module is one of the most power-consuming components of the smartphone [11], minimizing the energy consumption can be achieved through controlling directly the cellular data interface.
The cloud-based mobile applications rely on the Internet connectivity in order to keep their contents up-to-date and present them to the users through notifications. Therefore, the cloud-based applications require toggling the cellular radio module to the active state occasionally to transmit/receive data during the update intervals. In order to reduce the number of oscillations between the states, the radio module preserves its state for a certain amount of duration after being toggled ON, even if the flow of packets in a user session is completed [2]. Therefore, upon activation, the radio module consumes power at least for a constant period of time. As it is common to run a high number of cloud-based applications in the background simultaneously, high number of requests for toggling the radio
module to the full active (i.e., the most power-consuming)
state asynchronously would toggle the radio interface ON and OFF at different times, which in sum might increase the total energy consumption. However, a mechanism that can control the cellular network interface of the smartphone in a way to toggle the cellular data interface ON and OFF at particular periodicity with various durations would let all the applications’ network activities to be accomplished at fixed and predefined time intervals. In other words, this would shift small bursts that are spaced out with some intervals into rather fewer number of large bursts [2]. We hypothesize that this might reduce the total energy consumption; we build the study in this paper on this basis. As a drawback, this proposal might in parallel reduce the end-user perceived QoE as the end-users are notified by the updated information with some latency.
Controlling, i.e., in the sense of enabling / disabling,
the cellular data interface might reduce the overall perceived quality due to the increased burst size of data and latency during the polling of the content, given that the users are using these apps interactively. However, this might be pos-sible when the users are not interacting actively with the
smartphone, i.e., basically when the smartphone screen is in
emails, even as an addiction [12], while some other users do it less often. Indeed, bombardment of notifications to users can keep people busy checking them, while preventing them to accomplish more important tasks, and eventually reducing their productivity. Therefore, reducing the number of interruptions caused by occasional notifications as a result of occasional
network activities, e.g., pull and push functionalities, would
possibly increase the focus on the task at hand and productivity. Dawidow in [15] claims that the users should control tools to accomplish tasks rather than letting the tools control the users, and our research contributes to that.
Our main goal in this study is to reduce the total energy consumption of a smartphone during its screen-OFF state, while investigating its influence on information polling latency on the end-user perceived QoE. We hypothesize that the background running applications information update intervals do not highly influence the user experience when the screen is in OFF state. The research contribution of this paper is as follows. In contrast with the previous related studies, we propose a power saving software that can save energy by controlling the cellular data interface in screen-OFF state, while keeping the end-user perceived quality unchanged. The proposed software does not require any major changes in the network stack or in the OS, and can be easily installed to most of the Android OS based smartphones.
The paper is structured as follows. The background in-formation on the energy states of cellular radio module of the smartphone is reviewed in Section II. The related work regarding earlier proposed solutions to control the energy states of the radio module as well as the work done to reveal the disadvantages of notifying users with interruptions are is discussed in Section III. The measurement data and the experiment methodology are given in Section IV. We introduce our two applications that are used to understand the power consumption characteristics of a set of network activities; and to understand the end-user perceived quality on the reduced network activities. The results of the in-lab ground truth energy ExpCO2 measurements are given in Section V. Next, the details of the latter subjective study is presented in Section VI. Section VII confers the subjective study results. We discuss on the overall results and present the limitations of the study in Section VIII. The paper is concluded and future work is presented in Section IX.
II. 3G CELLULARRADIOPOWERCONSUMPTION
The cellular radio is designed to minimize the energy consumption such that it transits between the most power-consuming state to a less power-power-consuming state depending on the network traffic activity. Radio Resource Control (RRC) Protocol in Universal Mobile Telecommunications System (UMTS) [3] has a state machine with three states that has different power consumptions, and these states depend on the data rate and the uplink/downlink queue sizes [17]. The
Idle state is assumed when no radio resource is allocated, no
connection between User Equipment (UE), e.g., smartphone,
and Radio Network Controller (RNC) is established, and the
UE cannot transfer any data. TheDCHstate is assumed when
UE-to-RNC connection is established, and the UE is allocated
with the dedicatedDCHtransport channels for both downlink
and uplink with the highest bandwidth and power. TheFACH
is the state for very low data throughput rate application
requirements, and inFACH, the RRC connection is established
but no channel is associated. The power consumption decreases
in the order of DCH, FACH, and Idle[2]. The cellular radio
module transits fromDCHtoIdlestate first by transiting into
an intermediate state (FACH) depending on the tail time (can
last up to 15 seconds [2]), which depends on the network
provider, the traffic volume, or the smartphone manufacturer. The amount of the web content to be polled and the connection speed are important factors for the energy consumption during the polling periods. In addition, there exists a delay between the energy state transitions, which are due to the high number of control messages being transmitted and received between UE and the RRC.
III. RELATEDWORK
The power consumption of smartphones have been an-alyzed many times in previous works [19]. Some important work so far are related to leveraging the 3rd Generation Part-nership Project (3GPP) standards by proposing fast-dormancy.
This is basically forcing the transitions such asDCH to Idle
or FACH to Idle without waiting for the inactivity timeout
periods. Tail Optimization Protocol (TOP) is proposed by
Qian et al [5] to minimize the timeout periods, i.e., inactivity
times, between the states by invoking the fast dormancy support. On the other hand, according to a research done
by AT&T [2], for particular apps, reducing the tail timer by
three seconds reduce the resource usage by40 %, but increase
the number of state promotions by 31 %. In order to reduce
the initial latencies, it is claimed by Gerber et al [2] that pipelined Hypertext Transfer Protocol (HTTP) requests into a single Transport Control Protocol (TCP) connection rather
than sequential HTTP requests. AT&T diagnosed the problem
via app profiler, bundled the scatter-burst transmission of small
packets into a single transmission, and achieved40 % energy
saving. The missing part in the research is how the suggested solution influences the end-user perceived QoE.
Fig. 1. Example of the power consumption of different states of the cellular radio module for a single Ping execution with RTT= 1429ms.
0 200 400 600 800 1000 1200 1400 1600 10ï2
10ï1
Power Consumption (mW)
C
C
D
F
www.bbc.com www.cnn.com www.slashdot.org www.csv.com PING (dedicated server IP)
Idle FACH DCH
Fig. 2. Power consumption patterns for a set of applications. Black solid line shows the approximate trend.
source) patterns of users through an app [10], and suggest solutions to reduce waste of energy during overcharging pe-riods, and also to reduce the damage the battery can get via overheating/overvoltage. The most important difference between the related work and ours is that we developed a
power saving toolkit,ExpCo2, conducted ground truth power
performance measures, and employed a subjective study in
order to assess the efficiency of the tool. ExpCO2 reduces
the total number of network activities by extending the Idle
periods. This prevents the user to be interrupted with push/poll notifications of cloud-based apps, and also aims at minimizing the total energy consumption and the network utilization.
IV. METHODOLOGY ANDMEASUREMENTDATA
We have developed two different apps for the purpose of this paper. The first app developed for the work presented in
this paper is used as a test softwareto understand the energy
states of the cellular radio module through ground truth mea-surements via the Monsoon Mobile Power Monitoring Tool (MPMT) [6] during the screen-OFF state of the smartphone. Our aim is to obtain background knowledge on the power consumption changes amongst different cellular radio states.
As the second app, the ExpCO2 software is developed and
used in a subjective study to record a set of QoE metrics on the users’ own smartphones.
A. Test Software and the MPMT-based Measurements
We developed a test software that initiates a set of
com-mands, such aspingorweb page download. By using MPMT,
we conducted in-lab energy measurements with the Samsung Galaxy S with Lithium-ion battery. During the smartphone’s
sleep state, i.e., screen-OFF state, a set of echo request
messages with 30 seconds inter-departing time, are sent to
a dedicated server located at the BTH University campus in
Karlskrona, Sweden. The reason for 30s inter-departing time
was a repeatability,i.e., waiting for the cellular radio to transit
back to Idle state, as each complete experiment repetition
initiates and ends at the Idle state. During the experiments,
the screen (backlight display), WiFi, GPS, Bluetooth, Audio, Camera, and unrelated apps were OFF. This way, we prevent additional power consumption caused by other components, which made it possible to focus exclusively on the cellular radio’s power consumption. During the experiments, we inves-tigate the transition latency between the energy states and the inactivity timeout periods amongst the three energy states of
the cellular radio module of the smartphone. Thetest software
recorded the Round Trip Time (RTT); and MPMT recorded the average power consumption during the ping execution to an IP address of a computer at BTH campus (to avoid any extra DNS
resolution latency). MPMT provided3.7V to the smartphone
and measures the average power consumption with a default
sampling rate of5kHz
A transmission of only one echo request packet can wake up the radio module during the sleep state of the smartphone. It is possible to understand the minimum duration of a radio module in the active state, knowing via “tcpdump” that there is no further traffic after the reply message being received back. As a representative example from one test run (see Fig. 1),
even during one RTT, e.g., 1429ms (high value due to the
first packet effect) of a 64 Bytes ICMP packet, the duration
when the radio module state is notIdle, is roughly more than
10 seconds. Observe that the solid black line is the Simple
Moving Average (SMA) [23] with window size of 0.5s,i.e.,
smoothing over2500power data samples. Thereby, the energy
is wasted during the remaining duration,e.g.,Idle-To-DCHand
FACH-To-Idle periods. In addition, not all the time spent at
the DCHstates are due to the data activity, rather due to the
inactivity timeout periods.
We further investigate the energy consumption during
web page download for a set of website URL’s. This
time, the test software is instructed to send GET messages to popular website URL’s and then downloads the con-tents of the websites: cnn.com (news); (ii) bbc.com (news); (iii) slashdot.org (RSS feed); (iv) cvs.com (retail). The test soft-ware records the total amount of download time and MPMT records the power consumption similar to the ping exper-iments. We repeated these experiments in the lab every
45seconds, i.e., a time period so that the radio module is
switched completely to theIdlestate, before the next network
activity starts. In total, a minimum35iterations with 45
sec-onds time gap were conducted and each iteration consisted of more than eight million power data points as the power metric
is recorded at a sample rate of 5KHz. The Complementary
Cumulative Distribution Function (CCDF) plots for the power consumption for the mentioned experiments are depicted in Fig. 2. We classified the three energy states intuitively and showed with a black solid line.
B. ExpCO2 Software and Power Measurements
The main purpose of ExpCO2 is to save smartphone energy, when it is not interactively used by the user, par-ticularly in screen-OFF state. Upon particular events, Ex-pCO2 logs various parameters: screen state (ON, OFF); cellular data state (ON, OFF); the connected network type (3G, WiFi); unique smartphone device ID; remaining battery level percent; battery state (plugged, unplugged to/from power source); the received application notifications (only corresponding package name); user feedback (free text); and the five-scale Mean
Opin-ion Score (MOS) (1isbadand5isexcellent) [22] together with
the impairment (1isvery annoyingand5isimperceptible). The
ExpCO2 services, which collect the metrics, are running in the background.
Together with the ExpCO2’s metric recording functionality, we added the feature that toggles the data state of the cellular radio module between ON and OFF states with different time intervals during screen-OFF state. ExpCO2’s aim is to limit the occasional network traffic activities of all applications on user smartphones, in a way that they will be activated at once for a particular period of time, and to assess its influence on the end-user perceived quality. Our proposal is that the occasional network activities can be reduced and grouped in a particular time window, which will minimize the number of toggling between the states by different running applications and services. Reducing the total number of network activities will reduce the total number of cellular data state transitions, the amount of inactivity timeout periods of the cellular radio, and eventually the total energy consumption of the smartphone. ExpCO2 does this preliminarily by disabling and enabling the cellular data module completely for specific period of
time. We refer to TDataON and TDataOFF to DataON
(data-enabled) and DataOFF (data-disabled) durations, respectively. Towards this aim, we launched a set of cloud-based applica-tions such as Facebook, Twitter, LinkedIn, Instagram, GMail, GTalk, Google Services, WhatsApp from a dedicated user application account. We also launched one Swedish news application (AftonBladet [21]) that also has polling function-ality. During the execution of the app, the ExpCO2’s extra power consumption characteristics are investigated as well. We first verify the power consumption of ExpCO2 with in-lab measurements as a ground truth. Next, we conduct a subjective study on users’ daily life natural environments; we employed ExpCO2 on the users personal smartphones.
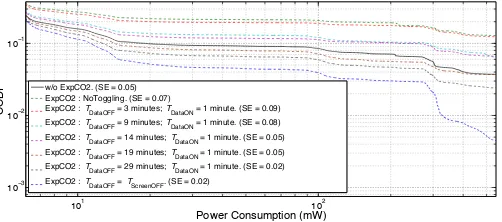
For the verification of power consumption of ExpCO2, we conducted a set of ground truth energy measurements
in the lab with different scenarios via MPMT during the
screen-OFF state: (1)TDataOFF = 3min; (2)TDataOFF =
9min; (3)TDataOFF = 14min; (4)TDataOFF = 19min;
(5)TDataOFF = 29min; (6) OFF, TDataOFF = TScreenOFF,
i.e., data-disabled period is equal to the screen-OFF period
as parameterized by user; (7)NoToggling, i.e., with ExpCO2
but without toggling cellular data interface; (8)w/o ExpCO2,
i.e., without listening on sensors, without writing metrics to
the smartphone’s local storage, and without toggling cellular data interface to obtain the base-line power consumption. We collected samples for the eight different scenarios to such extent that each scenario has a Standard Error (SE) of the mean
values less than 1 %. The Standard Error (SE) of the sample
mean for each scenario is calculated as: the standard deviation
101 102 ExpCO2 : NoToggling. (SE = 0.07)
ExpCO2 : TDataOFF = 3 minutes; TDataON = 1 minute. (SE = 0.09)
Fig. 3. Power consumption patterns for different available cellular data durations in Screen-OFF state.
of the sample data divided by the square root of the number of the samples. The CCDF plots are presented together with the Standard Errors for each scenario in Fig. 3. In addition, we
calculate the Gain Factors for each scenario (over 10million
samples each), while taking thew/o ExpCO2scenario as
base-line and is calculated in Eq. 1. P¯
w/o ExpCO2 is the average
power consumption without ExpCO2; and P¯
Scenario is the average power consumption of any of the eight scenarios. Therefore, the larger the gain factor, the higher the saved energy.
The Gain Factors obtained through in-lab measurements
for different DataOFF durations is presented in Table I. The
TABLE I. THEGAINFACTORS FOR DIFFERENT SCENARIOS.
w/o ExpCO2 NoToggling 3 m OFF 9 m OFF 14 m OFF 19 m OFF 29 m OFF OFF
1 0.34 0.35 0.54 0.63 0.83 1.34 2.57
Gain Factor is less than1for the scenarios where theTDataOFF
duration is set to less than 29min. One reason is ExpCO2’s
itself extra power consumption, which is likely caused by the
logging (listening and writing) process,i.e., without the latter,
the energy consumption is expected to decrease. Based on the
in-lab experiments,TDataOFF = 29min andTDataON= 1min
combination has a Gain Factor of 1.34, and expected to be
even more when the energy consuming logging process is disabled. By taking the results obtained from this part as basis, we conducted a user study to identify the influence of the
(29min DataOFF,1min DataON) combination on the end-user
perceived quality during the smartphone’s screen-OFF state.
VI. USERSTUDY WITHEXPCO2
TheExpCO2has two main phases in the user study: (i)
In-troduction Period (min.2 days), (ii) Actual User Study Period.
The Introduction Period is important for us to construct a base-line on the end-user’s interaction with the smartphone in real
life,e.g., user feedback, screen state changes, received
smartphones. During the Actual Study Period, the functionality of ExpCO2 has changed such that the cellular data is enabled as long as the screen is ON. Once the screen is turned OFF, the cellular data is disabled automatically. ExpCO2 applied
TDataOFF to29min, and theTDataONto1min, which means
the data is enabled again after 29min screen-OFF duration
and then enabled again only for one minute; next the data
is disabled again for another 29min. This cycle continues
until the user turns ON the screen manually. When screen is ON, the user is able to submit a user feedback or MOS on spot anytime via Experience Sampling Method (ESM) [16]. We provided a user-friendly ESM interface for the subjects along experience from pervious studies [1]. The participants, who own Android smartphones, are chosen through an online survey. Once the user reads consent and confirms participation
via the online form, the user is allowed to install ExpCO2
on their smartphones. We asked users to submit MOS, user feedback, and any impairment during the study period, as soon as they appear. We deliberately did not tell the users about the network traffic change of the ExpCO2, or about the battery life of their smartphone to prevent bias. After the study, in the final interview with the users, we obtained more detailed knowledge on their experiences. We asked to the users questions regarding the battery life and the overall user perceived quality of the smartphone. This interview and the feedback obtained through ESM helped us to address the question “Do the users really need to receive the notifications when the smartphone is not used interactively?” If not, we may conclude that maximizing the data-disabled duration can save energy without influencing end-user QoE. The data analysis relies on the user feedback, and the battery levels. The battery discharge curve depends on factors such as the battery age and temperature [18]; however we assumed that this did not change significantly during the subjective study.
VII. USERSTUDYRESULTS
As we have conducted the user study with five users and three phone types so far, we did not run any statistical significance tests, however, the results obtained are highly indicative. The subjects were reluctant to give MOS ratings, and when they were asked the reason they claimed that they did not experience any difference, and it was perceived by the users that the smartphone was functioning as in daily life. Therefore, we focused on the qualitative feedback rather than the quantitative ones. The data collected during the Introduction Period and the Actual Study Period are presented
as different sections for each subject,S, in Table II. All5users
in the study have used GMail, GTalk, WhatsApp, and Viber. Additional user apps are presented in Table II. The median data- OFF/ON duration during screen-OFF were close to the
nominal (29min/1min) values:29min/1min;29min/1.25min;
26min/2.2min; 25min/1min for the subjects S1-to-S4,
re-spectively. All of the users replied “No” to the question:
“Have you realized any change, e.g., regarding the
notifica-tions, when your smartphone screen was OFF?”. When asked to the users: “Can you prioritize the cloud-based apps that
you really want to be notified?”, S2 replied: “WhatsApp,
LinkedIn, Email, Facebook, Twitter”. Based on the ExpCO2
logs, and the prioritization of the apps,S2has used WhatsApp
frequently (received422WhatsApp notifications in119hours),
but the subject did not complain about any notification latency.
TABLE II. USERSTUDYRESULTS
S1 - Samsung Galaxy Note2 Introduction Period (without manipulating the cellular data)
T
Study = 116hrs Mean Median Std. Size (Detected Events) Model R2
TScreenOFF(min) 22 4.2 64.4 279 Exp. 0.93
TScreenON(min) 2.6 0.5 5.5 279 Exp. 0.96
Battery Level (%) 48 47 26 7621 -
-Used Apps CloudMe, Verisure, Skype, LinkedIn, Shoutcast
S1 - Samsung Galaxy Note2 Actual Study Period (with manipulating the cellular data)
TStudy = 75hrs Mean Median Std. Size (Detected Events) Model R2
TDataON(min) 36.2 1 106 37 -
-TDataOFF(min) 58 29 164.5 36 -
-Battery Level (%) 74 79 20 5363 -
-Total WiFi Duration (hours) 1.45
DeviceOFF Duration (hours) 0
Feedback “it was normal.” Not realised any difference.
S2 - Samsung Galaxy S3 Introduction Period (without manipulating the cellular data)
TStudy = 119hrs Mean Median Std. Size (Detected Events) Model R2
TScreenOFF(min) 7.7 1.6 23.5 656 Exp. 0.95
TScreenON(min) 3.2 0.6 18.2 655 Exp. 0.93
Battery Level (%) 42 36 30 15783 -
-Used Apps Facebook, Instagram, LinkedIn, Twitter
S2 - Samsung Galaxy S3 Actual Study Period (with manipulating the cellular data)
TStudy = 75hrs Mean Median Std. Size (Detected Events) Model R2
TDataON(min) 42 1.25 78.5 13 -
-TDataOFF(min) 193 29 444 13 -
-Battery Level (%) 40 32 31 8692 -
-Total WiFi Duration (hours) 2.6
DeviceOFF Duration (hours) 21
Feedback Not realized any difference
S3 - Sony Xperia Introduction Period (without manipulating the cellular data)
TStudy = 50hrs Mean Median Std. Size (Detected Events) Model R2
TScreenOFF(min) 10.5 1.7 36 235 Exp. 0.92
TScreenON(min) 2.3 0.5 12.7 234 Exp. 0.96
Battery Level (%) 46 46 24 3730 -
-Used Apps LinkedIn, Skype, Facebook, Facebook Messenger, Twitter, News/Sports app S3 - Sony Xperia Actual Study Period (with manipulating the cellular data)
TStudy = 43hrs Mean Median Std. Size (Detected Events) Model R2
TDataON(min) 38 2.2 91.5 37 -
-TDataOFF(min) 32 26 49 37 -
-Battery Level (%) 55 54 27 1582 -
-Total WiFi Duration (hours) 0.16
DeviceOFF Duration (hours) 9
Feedback Not realised any difference.
S4 - Samsung Galaxy S3 Introduction Period (without manipulating the cellular data)
TStudy = 110hrs Mean Median Std. Size (Detected Events) Model R2
TScreenOFF(min) 32 4.9 84 177 Exp. 0.92
TScreenON(min) 5.43 0.25 29.3 176 Exp. 0.89
Battery Level (%) 48 47 29 5737 -
-Used Apps Anydo, Facebook, Facebook Messenger, Twitter, Skype
S4 - Samsung Galaxy S3 Actual Study Period (with manipulating the cellular data)
TStudy = 30hrs Mean Median Std. Size (Detected Events) Model R2
TDataON(min) 51 1 214 18 -
-TDataOFF(min) 18 25 13 19 -
-Battery Level (%) 60 71 26 1596 -
-Total WiFi Duration (hours) 0
DeviceOFF Duration (hours) 10
Feedback Not realised any difference.
S5 - Samsung Galaxy S3 Introduction Period (without manipulating the cellular data) Skipped for this user due to technical issues
S5 - Samsung Galaxy S3 Actual Study Period (with manipulating the cellular data)
Used Apps Using Facebook through the browser
T
Study = 62hrs Mean Median Std. Size (Detected Events) Model R2
TScreenOFF(min) 7.9 1.2 22.4 391 Exp. 0.93
TScreenON(min) 1.6 0.3 3.3 391 Exp. 0.91
TDataON(min) 138 0.4 421 12 -
-TDataOFF(min) 144 0.3 421 12 -
-Total WiFi Duration (hours) 0
DeviceOFF Duration (hours) 0
Feedback “I do not want to get notifications. Notifications for example for Facebook would probably stress the life out of me
and are absolutely switched off on my phone”
This might be due to the fact that the user expectation to receive a notification decreases when the user turns the screen-OFF, which needs to be investigated in more detail with more subjects. Some users interact with their smartphones frequently, while some do it less often such as the difference
in the number of screen-ON/OFF toggles forS1(279times in
116hours) andS2(656times in119hours). We assumed that
the probability distribution of screen- ON and OFF durations
is memoryless, i.e., user’s current screen- ON/OFF duration
does not depend on the users’ previous screen- ON/OFF durations. Thereby, we fit the screen- ON/OFF durations to an
exponential curve. We show that, for the subjects S1-S5, the
the Introduction Period (R2
(Coefficient of Determination) ≥
0.91) with median durations 0.5min/4.2min,0.6min/1.6min,
0.5min/1.7min, 0.25min/4.9min, 0.3min/1.2min,
respec-tively. While the smartphone was running as being discon-nected from the power source, the mean battery levels have
increased by54 %,20 %, and26 %, forS1,S3, andS4,
respec-tively during the Actual Study as compared to the Introduction
Period.S2has used2.6hours of WiFi and the smartphone was
completely OFF for21 hours, therefore the results belong to
S2are not indicative to understand the improvement in energy
levels for this particular user. Thereby, we focus on qualitative analysis based on any possible perceived quality degradation. Although, we cannot claim statistical significant conclusions due to rather high standard error values, the results are highly indicative.
VIII. DISCUSSION ANDLIMITATIONS
ExpCO2’s power saving depends on human
user-smartphone interaction. We recommendExpCO2for the users
who check emails less frequent than every 29min to save
energy. In addition, ExpCO2 might change user behaviour, particularly for those users who receive too many notifications and being interrupted by them often in daily life. For those users, ExpCO2 provides an extra benefit such as reduced
interruption by notifications ofe.g., cloud-based apps. Another
drawback of frequent interruption during screen-OFF state is that, each interruption possibly causes users to turn the screen ON each time, which also increases the power consumption
re-lated to other components,e.g., backlight display. As ExpCO2
merely controls cellular data only during screen-OFF state, it is suggested for particular users whose smartphone interaction is based on the received app notifications; ExpCO2 might help them change their user smartphone interaction in a good way, being less interrupted (save time), and in parallel save energy.
During the Actual User Study, subject S1 wasn’t able to
listen to Internet radio while driving. Therefore, we added an extra feature to ExpCO2 so that the radio was kept ON even when the screen is OFF based on the user preference. But, we asked the user to disable that feature after driving. In
addition, the battery saving forS5 is unknown, as there were
technical problems during the Introduction Period. Based on
the qualitative results of S5, the subject has not realized any
degradation in the perceived quality on the cloud-based apps during the Actual Study Period.
IX. CONCLUSIONS ANDFUTUREWORK
In this paper, we present the power consumption patterns of Samsung Galaxy S smartphone during a set of data network activities on the cellular radio, and then developed ExpCO2 that enables or disables the cellular data at predefined
inter-vals, while extending the non-Idle periods. ExpCO2 reduced
asynchronous network activities of individual cloud-based apps and let them start network activities simultaneously during
the 1min DataON period. We showed that the energy gain
of such solution (called ExpCO2) increases with the dura-tion of DataOFF periods during screen-OFF state. Based on the obtained quantitative results through in-lab experiments,
a DataON/DataOFF cycle with 29min DataOFF, and 1min
DataON duration during screen-OFF state indicated a 34%
energy gain. We confirmed with the qualitative subjective study
that the user perceived quality is not degragaded with this DataON/DataOFF duration combination.
The indicative results acquired in this paper have poten-tial for future work. We will investigate the network traffic, conduct a user study with more users, and tune the DataON and DataOFF durations based on user-smartphone interaction requirements in terms of notification latency. We encourage the cloud-based Android app developers to use the Alarm-Manager [24] in Android API, so that the apps can broadcast the network activity events to the other listening apps, which could let all the apps to synchronize their network activities in an autonomous and reliable manner, and save energy.
REFERENCES
[1] S. Ickin, et al, Factors Influencing Quality of Experience of Commonly-Used Mobile Applications,IEEE Communications Magazine, April 2012. [2] A. Gerber, S. Sen, O. Spatscheck, “A Call for More Energy-Efficient
Apps,” AT&T Labs Research, April, 2011.
[3] F. Qian, et al, “Characterizing radio resource allocation for 3G networks,” inProceedings of IMC’10, USA, pp. 137-150.
[4] A. Dix et al, Human Computer Interaction, Prentice Hall, 2004. [5] F. Qian, et al, “TOP: Tail Optimization Protocol for cellular radio
resource allocation,” inProceedings of ICNP’10, Japan, pp. 285-294. [6] Monsoon Power Monitor. Available from: http://www.msoon.com/
LabEquipment/PowerMonitor/, [Accessed June 2013].
[7] Notification Center. Available from: http://gigaom.com/2011/10/12/ ios-5-notifications-and-notification-center, [Accessed May 2013]. [8] B. Shneiderman, C. Plaisant, Designing the User Interface: Strategies for
Effective Human-Computer Interaction (4th Edition), 2004. [9] J. Nielsen, Usability Inspection Methods, John Wiley&Sons, 1994. [10] D. Ferreira, A. K. Dey, and V. Kostakos, “Understanding
human-smartphone concerns: A study of battery life,” inProceedings of Per-vasive’11, Germany, pp. 19-33.
[11] L. Zhang et al, “Accurate online power estimation and automatic battery behavior based power model generation for smartphones,” inProceedings CODES/ISSS ’10, USA, pp. 105-114.
[12] Shapira et al, Problematic Internet Use: Proposed Classification and Diagnostic Criteria, Depression and Anxiety, 17:201-216, 2003. [13] D. O’Reilly, “How to silence notifications on smartphones and tablets”,
Available from: http://howto.cnet.com/8301-11310 39-57551600-285/ how-to-silence-notifications-on-smartphones-and-tablets/, [Accessed June 2013].
[14] Power Tutor, Available from: http://ziyang.eecs.umich.edu/projects/ powertutor, [Accessed June 2013].
[15] W. H. Davidow, “Our tools are using us,”The Magazine of Technology Insiders IEEE Spectrum, August 2012, pp. 45-48.
[16] J. M. Hektner et al., Experience Sampling Method: Measuring the quality of everyday life, Sage Publications Inc., 2006.
[17] H. Holma, A. Toskala, HSDPA/HSUPA for UMTS: High Speed Radio Access for Mobile Communications, John Wiley&Sons, 2006. [18] Battery and Energy Characteristics, Available from: http://www.
mpoweruk.com/life.htm, [Accessed June 2013].
[19] A. Carroll and G. Heiser. “An analysis of power consumption in a smartphone,” inProceedings of USENIXATC’10, USA, pp. 21-21. [20] AwayFind, Available from: http://www.awayfind.com/, [Accessed June
2013].
[21] AftonBladet, Available from: https://play.google.com/store/apps/details? id=se.aftonbladet.start&hl=en, [Accessed June 2013].
[22] ITU-T Rec. P.800, Methods for subjective determination of transmission quality, 1996.
[23] C. Kirkpatrick, J. R. Dahlquist, Technical Analysis: The Complete Resource for Financial Market Technicians. Pearson Education, Inc., 2011, pp. 276.