Numerical Simulation of Threat-independent Progressive Collapse
Elvira, E.1), Mendis, P.2), and Whittaker, A.3)
Abstract: A threat-independent approach is usually utilized for progressive collapse analysis of buildings. This approach is referenced in the current guidelines such as “Progressive Collapse Analysis and Design Guidelines for New Federal Office Buildings and Major Modernization Projects” by the U.S. General Service Administration and “Design of Buildings to Resist Progressive Collapse” by the U.S. Department of Defence. However, more studies are required to accurately observe the influence of structural parameters to the response of structures in progressive collapse phenomenon. A parametric study was conducted using advanced nonlinear finite element analysis to assess the utility of the procedures in these documents. The results of the numerical simulations show that a variation of the beam dimensions moderately affects the dynamic load factor. The load factor increases as the beam dimensions increase. Other parameters such as the column dimensions, number of storeys and span lengths, have only negligible effects on the value of the dynamic load factor.
Keywords: Progressive collapse, dynamic load factor and clear removal of column
Introduction
Progressive collapse of a building could be triggered by the failure of one or more major structural elements following a blast or impact loading. The failure of major structural elements may overload adjacent elements, creating a chain of events that may result in the total collapse of the building or disproportionately large part of it [1, 2].
Progressive collapse may occur during the construction or service life of a building. Most progressive collapses that have occurred during construction are due to errors in formwork, bracing or erection procedures [1]. Progressive collapse during the service life of a building can be triggered by impact loads such as those from a vehicle, ship, airplane, an explosion, or falling or swinging object during the construction of a neighbouring building. These causes are generally categorized as ‘abnormal loads’ [3]. Progressive collapse during the service live may also be triggered by earthquake shaking [4].
In early strategies to mitigate progressive collapse, attentions were mainly concentrated on a qualitative approach to increase structural integrity.
1 Tanjungpura University, Pontianak, INDONESIA
Email: [email protected]
2 The University of Melbourne, Melbourne, AUSTRALIA 3 University of Buffalo, State University of New York, NY, USA
Note: Discussion is expected before June, 1st 2011, and will be
published in the “Civil Engineering Dimension” volume 13, number 2, September 2011.
Received 1 April 2010; revised 6 July 2010; accepted 30 August 2010.
This approach includes improving redundancy and providing alternate load paths to ensure that the loss of any single element would not lead to a global collapse. Another strategy used to mitigate the likelihood of progressive collapse is improving the local resistance of the critical components.
Recent advancements in numerical analysis, supported by the rapid development of computer hardware, have changed the thinking of the structural engineering community in regard to mitigating progressive collapse. Provisions for a quantitative approach have become available in building codes and guidelines such as the U.S. General Service Administration (GSA) [5] and the U.S. Department of Defence (DoD) [6]. Progressive collapse analysis is conducted by removing load bearing elements such as columns. Analysis can be either static or dynamic.
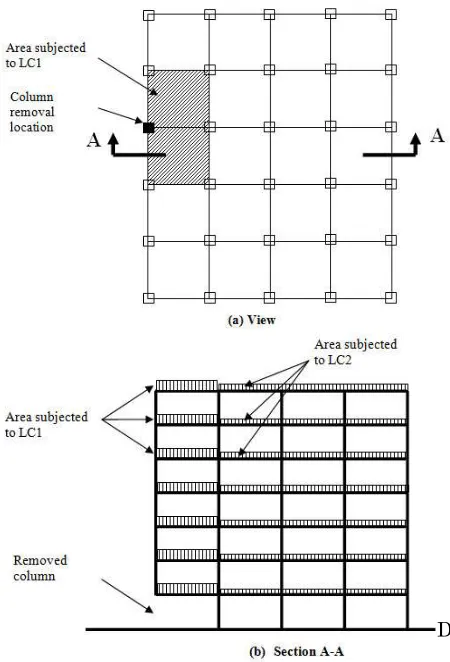
For static analysis, GSA [5] specifies a load combination per Equations 1 and 2, where DL and LL are dead load and live load, respectively. Load combination 1 (LC1) is applied to the area near the lost column and load combination 2 (LC2) elsewhere (Figure 1). The load factor of 2 for LC1 represents the dynamic amplification factor. The value is based on the response of a linear undamped single-degree-of-freedom (SDOF) system.
LC1 = 2(DL + 0.25LL) (1)
Figure 1. Load combinations for static progressive collapse analysis
The load factor of 2 does not capture the complexity of a progressive collapse, and ignores other factors that may affect the dynamic response of a building such as material nonlinearity, geometry of the structure, and damping. Further investigations are required to assess the utility of the simplified design procedures and identify improvements.
Numerical Simulation of Progressive Collapse
The dynamic response of a structure undergoing progressive collapse is usually based on the instantaneous removal of a gravity load bearing element such as a column. The column is removed from an at-rest structure without applying other dynamic forces to the structure. The column removal may be represented by forces that have the same magnitude but opposite sign to the reactions on the upper end of the removed column. As forces can not be applied instantaneously, finite (but short) rise-time is used to model the removal.
The comparison between the effect of dynamic and static loading on the response of a structure can be described using Dynamic Load Factor (DLF). The factor is defined as the ratio of the maximum
dynamic displacement of a linear SDOF system to the static displacement. It can equally be defined as the static force required to deflect the structure by the same amount as the maximum dynamic displacement, divided by maximum dynamic force. The first definition of DLF is only applicable to linear systems. However, the second definition is also applicable to nonlinear systems and is used hereafter.
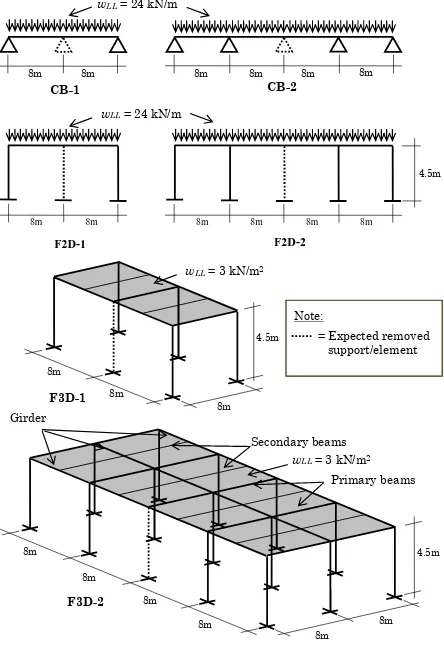
A preliminary study is conducted to observe the trends for the DLF for multy-degree-of-freedom (MDOF) systems. Models of reinforced concrete structures used for this investigation ranges from continuous beams (CB) to 3-D frame structures (F3D), as shown in Figure 2. As the objective of this preliminary study is to obtain high-level information on structural response, only two simple models are selected for each structure. The number of bays for each model is selected by considering the symmetry of the structure when a support or column is removed. One storey of 1x2 bay and 2x4 bay structures are selected for the F3D model namely F3D-1 and F3D-2. The models represent simple 3-D frame structures. The structural dimensions and loading conditions of the CB (CB-1 and CB-2) and F2D (F2D-1 and F2D-2) models are used to represent the response of the middle frame of F3D-2 in the short and long directions. The dimensions of the elements of each model are presented in Table 1. The reinforcement ratio of the columns in Table 1 is the ratio of total longitudinal reinforcement divided by the gross cross-sectional area of column. Eight longitudinal rebars are used in each column. The compressive strength of concrete is 32 MPa with modulus of elasticiy equal to 31 GPa. The yield strength of the reinforcement is 420 MPa and its modulus of elasticity is equal to 200 GPa. Materials are assumed to be linearly elastic. Structural damping is not considered.
Table 1. Dimensions of elements in the models Case Elements Dimensions
(mm)
Reinforcement (%) Top / Bottom CB
F2D F3D
Beams Beams Columns Exterior girders Interior girders Exterior primary beams Interior primary beams Secondary beams Columns Slabs
500×300 500×300 400×400 500×300 500×300 450×250 450×250 450×250 400×400
120
1.25/ 0.75 1.25/ 0.75
2 1.25/ 0.75 1.73/ 1.24 1.48/ 1.10 1.85/ 1.15 1.18/ 0.88
2 0.45/ 0.41
support removal point in each model were compared to estimate the DLF. Static analysis is conducted to obtain the load-displacement relationships based on the GSA guidelines [5]. Although the GSA guidelines do not address continuous beams and two-dimensional framed structures, similar concepts are adopted in these cases. The load-displacement relationship for static analysis is obtained by gradually applying the load combination of
DL+0.25LL to the whole structure until a load factor of 1 is reached. An additional load combination of
DL+0.25LL is then applied to the collapsed area (the same as the area subjected to LC1 shown in Figure 1) until a cumulative load factor of 2 is reached.
8m 8m 8m 8m 8m 8m = Expected removed support/element Note:
Figure 2. MDOF models
There is no clear guidance on how to perform dynamic progressive collapse analysis of a structure. The GSA guidelines only stipulate that dynamic analysis can be conducted by removing a column from the at-rest stucture and that, the time required to remove the column should be less than 10% of the natural period of the structure. DoD [6] recommends an instantaneous removal of the column for dynamic analysis.
The dynamic analysis reported in this paper used a ramped forcing function [7] applied to the structure with initial deformations due to static loads, with either a load factor of 1 or with the load combination
of (DL+0.25LL). Figure 3 provides a schematic description of the dynamic analysis. Force F1 in Figure 3 is the column reaction. The static system shown in Figure 3 changes to a dynamic system if the reaction force F1 is removed dynamically. A ramped forcing function F(t) is used to represent the removal of the reaction force F1 (i.e., removal of a column).
The maximum value of the force F(t) is equal to the reaction of the column to be removed. The three steps for dynamic analysis are as follows:
1. Conduct static analysis for the gravity-load to calculate F1.
2. Remove the failed column from the system and apply F1 in lieu, then conduct static analysis. 3. Conduct dynamic analysis by applying F(t).
The time to remove the column, T, is set to be 10% of the natural period of the structure. Similar procedures are applied to the continuous beams and three-dimensional frame structures.
F1
Figure 3. Schematic explanations of dynamic analysis procedures for progressive collapse
The DLF values calculated for the models are presented in Table 2. For structures that have 2 spans, the value of the DLF is close to 2. For structures having more than 2 spans, the DLF values is as low as 1.7.
Table 2. DLF Values for Linear Elastic Response No Structure Model DLF Values
1
Analysis of Prototype Structures
must also be addressed. The simulations are conducted using nonlinear finite element analysis program, DIANA [8]. The reinforcement in the concrete beams, columns and floor slabs was modeled explicitly. Perfect bond of the reinforcement and the surrounding concrete materials was assumed. Reinforcement strains were computed from the displacement fields of the columns, beams or slabs elements.
Design of Prototype-A Structure
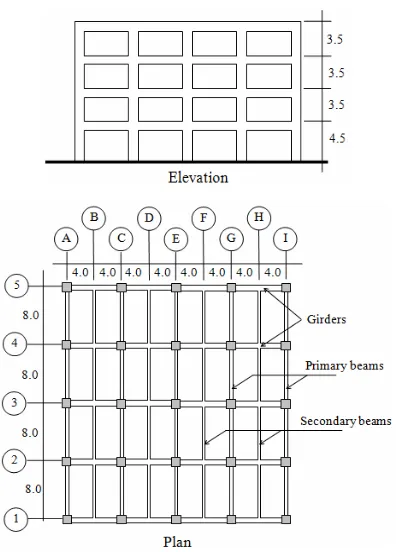
A typical four-storey reinforced concrete (RC) frame structure is utilized for the numerical simulation. The plan and elevation of the RC frame structure (called Prototype-A) is shown in Figure 4. The dimensions of the columns, beams and slabs are presented in Table 3. The Prototype-A structure is designed first based on the load combination (1.2DL+1.5LL) per the Australian/New Zealand Standard AS/NZS 1170.0 [9] for permanent and imposed action. The live load is taken as 3 kPa, based on AS/NZS 1170.1 for office and work areas. The proportion of loads transferred by the slabs to the beams is assumed to be based on the envelope distribution model.
Figure 4. Detail of RC Prototype-A structure
Table 3. Slab, beam and column dimensions
Element Dimension (mm, mm × mm) Slabs
Girders Primary Beams Secondary Beams Columns
120 500 × 300 450 × 250 450 × 250 400 × 400
Table 4. Reinforcement ratios on beams and columns Element Reinforcement Ratio (%) Top/Bottom Column
Exterior Girder Interior Girder
Exterior Primary Beam Interior Primary Beam Secondary Beam
2 1.25/0.75 1.73/1.24 1.48/1.10 1.58/1.15 1.18/0.88
The Prototype-A structure is then redesigned to meet the progressive collapse design criteria using the linear static analysis procedure of the GSA guidelines [5]. Taking advantage of symmetry, nine cases are considered for the linear static analysis. Each analysis considers the loss of a single column. The columns that are assumed to fail are Columns A1 to A3, C1 to C3 and E1 to E3 in the ground storey (Figure 4). The maximum member force in each element from all analyses is selected as the design force.
The GSA guidelines [5] provide acceptance criteria for the primary and secondary structural components in the form of Demand Capacity Ratio (DCR). DCR is acting force (demand) determined in a component or connection/joint (moment, axial force, shear, and possible combined forces) divided by nominal capacity of the component and/or connection/joint (moment, axial force, shear and possible combined forces). Structural elements and connections that have DCRvalues that exceed the allowable values are considered to be either severely damaged or failed. The GSA guidelines allow the use of a DCR of two for a typical reinforced concrete structure. Reinforced cross-sections are sized using design member forces divided by the DCR.
A standardized reinforcement design is presented in Table 4. The reinforcement ratio of columns in Table 4 is the ratio of total longitudinal reinforcement divided by the gross cross-sectional area of column. Total of eight longitudinal reinforcements are used for each column. In the standardized arrangement, the same reinforcement is maintained throughout the beam to simplify the section properties for the DIANA analysis.
Response of Prototype-A Structure
The concrete material model for the simulation is based on the fixed-crack model [8]. The fixed crack model assumes that the crack geometry is fixed once the crack forms. Shear stresses and strains are zero at the crack plane (normal to maximum principal stress direction) at the moment when the crack is formed. However, as loading proceeds, the principal axes of stress and strain rotate. At the same time, a crack that has formed is subject to shear strain because the crack orientation is no longer normal to the current principal stress direction. Therefore, the fixed crack approach should explicitly address shear transfer due to aggregate interlock along the crack interface, making it more complicated. However, this model seems to be more realistic than the rotating crack model.
As in progressive collapse phenomenon, the structures tend to deflect extensively, it is esential to consider the full part of the stress-strain relationsips for concrete (compression and tension) including the ascending and descending parts. Thus, the compressive stress-strain relationship of concrete is modelled based on recommendations by Collins and Poresz [8] and the tensile stress-strain relationship is modelled per Hordijk [11]. Stress-strain relation of reinforcement is modelled to be bi-linear as shown in Figure 5. The post-yield modulus Esh is assumed to be 1.5% of its elastic modulus Es.
Structural damping is not considered in the initial analysis. However, a sensitivity analysis is conducted later with the inclusion of damping. The material properties for the nonlinear analysis are presented in Table 5. The beams and columns are modelled according to Mindlin beam theory [8].
Three column removal scenarios are considered for all the analyses: 1) corner; 2) side; and 3) middle column. The corner, side and middle column removal scenarios correspond to the failure of Column A1, E1 and E3, respectively (Figure 4). The responses of the structure are compared based on the displacements measured at the point at which the column is removed.
Figure 5. Constitutive model for steel reinforcement
Table 5. Material properties for nonlinear static and dynamic analyses
Property (units) Value
Concrete:
- Compressive strength (MPa)
- Density (kg/m3)
- Modulus of elasticity (GPa)
- Poison ratio
- Tensile strength (MPa)
- Crack bandwidth (mm)
- Rayleigh damping (%)
- Fracture energy, Gf1 (N/m) Reinforcing Steel:
- Modulus of elasticity (GPa)
- Plastic modulus (GPa)
- Yield strength (MPa)
32.00
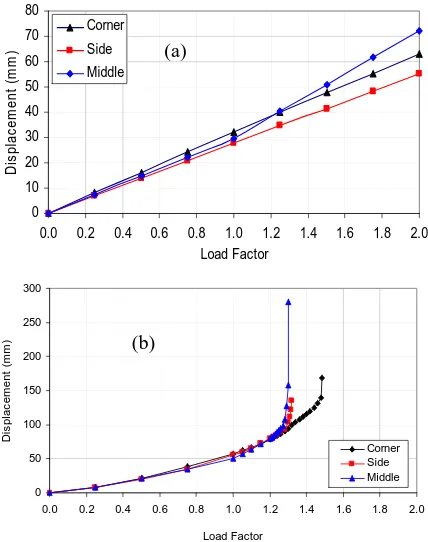
The displacement-load factor relationship calculated from linear and nonlinear static analysis is presented in Figure 6. Figure 6a shows the displacement-load factor relationship for the corner, side and middle column removal scenarios computed by linear static analysis. The displacement-load factor relationship calculated from the nonlinear static analysis is presented in Figure 6b, which shows numerical divergence before the load factor of two is reached but at large vertical displacement. Based on displacement-load factor relationship, it can be inferred that the structure would collapse before a load factor of two is reached. Based on these results, the maximum value of the load factor that could be sustained by the structure is approximately equal to 1.5.
Figure 6. Displacement-load factor relationship calculated from: (a) linear-static analysis, (b) nonlinear-static analysis
(a)
-200
Figure 7. Displacement history at column removal point calculated from nonlinear dynamic analysis
The history of displacement at the column-removal location calculated from nonlinear dynamic analysis is shown in Figure 7. The maximum displacements calculated from nonlinear dynamic analysis are relatively high (more than 120mm). Comparing displacements at the column-removal point calculated from nonlinear static analysis (Figure 6b) and nonlinear dynamic analysis (Figure 7), it can be inferred that the DLF calculated from nonlinear analysis is approximately 1.4 and much smaller than the recommended value of two required per GSA [5] for static analysis.
Influence of Slabs on the Response of the Prototype Structure
The responses of the Prototype-A structure, as described above, are calculated without considering the stiffness and mass of the slabs. The distribution of live loads and the self-weight of the slabs (transferred from the slabs to the beams) are based on the envelope distribution model.
The contribution of the stiffness and mass of the slabs is considered in this section. Slabs are modelled using eight-node curved-shell elements. Top and bottom reinforcement ratios are 0.45% and 0.41%, respectively, in both directions. The reinforcements are designed as per the Australian/New Zealand Standard AS/NZS 1170.0 [9] for permanent and imposed actions. This model is denoted Prototype-B.
The response of Prototype-B, which is measured using displacement at the point at which the column is removed, is computed for the corner, side and middle column removal scenarios by nonlinear static analysis. Results are presented in Figure 8. The load factor-displacement relationships are virtually identical. By comparing the load factor-displacement relationships presented in Figure 6b and 8, it can be concluded that the slabs increase capacity of the structure by approximately 25%.
0
Figure 8. Nonlinear-static response of Prototype-B structure
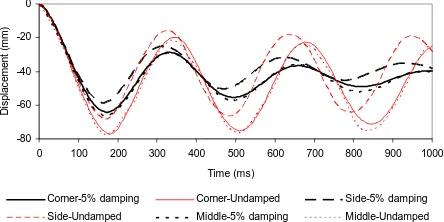
The nonlinear dynamic response of Prototype-B is presented in Figure 9. The displacement in Figure 9 is reported at the location where the column is removed. The influence of damping on the displacement-history is also presented in Figure 9. Including 5% damping can reduce the maximum displacement by approximately 15%.
-80
Corner-5% damping Corner-Undamped Side-5% damping Side-Undamped Middle-5% damping Middle-Undamped
Figure 9. Nonlinear dynamic response of the Prototype-B structure based on a column removal scenario
The value of the DLF calculated by comparing of static and maximum dynamic displacement are approximately 1.6 and 1.5 for the undamped and 5% damped systems, respectively.
Influence of the Geometry of Structure
The influence of structural geometry variables is studied to better understand progressive collapse mechanisms. The variables considered are: 1) beam dimensions, 2) column dimensions, 3) number of storeys and 4) span length.
the reinforcement ratios are not changed will make the girders and beams much stronger. Thus the response of structures will be nearly elastic. It is the other objective of this simulation, to evaluate the response of structure where the elements behave nearly elastic.
To identify the influence of the column dimensions, Prototype-B is revised by increasing the column dimensions from 400×400 mm to 500×500 mm to form Revised-2. The reinforcement ratios in the columns are not changed.
To investigate the influence of the number of storeys, Prototype-B is expanded to a six-storey building to form Revised-3. The reinforcements and dimensions of the girders, beams and slabs are unchanged from Prototype-B. The columns in the first three storeys have dimensions of 500×500mm and a reinforcement ratio of 2%. The other columns have dimensions of 400×400mm and a reinforcement ratio of 2%.
Finally, to identify the influence of span length, the spans are increased to form Revised-4. The procedures used to design Revised-4 are the same as those used to design the Prototype-B.
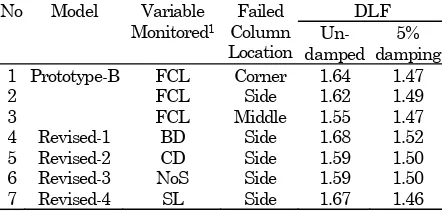
The nonlinear static and dynamic response of Revised-1 through Revised-4 is computed for the side-column-removal scenario. The values of DLF calculated from the numerical simulations are presented in Table 6.
Summary of the findings
The DLF values calculated for undamped systems vary from 1.55 to 1.67. The DLF for the 5% damped systems vary from 1.46 to 1.52 (see Table 6). The inclusion of 5% damping reduces the DLF by approximately 10%.
The changes in beam dimensions and span length affect moderately the DLF: the larger the dimensions of the beam, the higher the DLF values. However, changes in the other variables do not have any significant effects on the DLF.
Table 6. Actual DLF values calculated from the clear removal of column scenario
DLF
No Model Variable
Monitored1
1 FCL=Failed Column Location; BD=Beam Dimension; CD=Column
Dimension; NoS=Number of Storeys; SL=Span Length
Concluding Remarks
A parametric study on the response of a reinforced concrete frame subjected to the instantaneous removal of a column is presented. Finite element analysis incorporating advanced material models are used.
The influence of variations in building component geometry such as beam and column dimensions, number of storeys and span length on the DLF value was inverstigated. Only the variation in beam dimensions and span length affected the DLF significantly. The maximum DLF for a 5% damped structure is 1.5, which is lower than the value of 2 recommended by the GSA [5].
References
1. Taylor, D.A., Progressive Collapse, Canadian
Journal of Civil Engineering, 2, 1975, pp.
517-529.
2. Ellingwood, B.R. and Leyendecker, E.V., Approaches for Design against Progressive Collapse, Journal of the Structural Division, 104(ST3), 1978, pp. 413-423.
3. Allen, D.E. and Schriever, W.R., Progressive Collapse, Abnormal Load, and Building Codes, Structural Failure: Modes, Causes, Responsibilities, Proceedings, American Society of Civil Engineers,
New York, 1972.
4. Wibowo, H. and Lau, D.T., Seismic Progressive Collapse: Qualitative Point of View, Civil Engineering Dimension, Vol.11, No.1, 2009, pp. 8-14.
5. The U.S. General Service Administration (GSA),
Progressive Collapse Analysis and Design Guidelines for New Federal Office Buildings and Major Modernization Projects, 2003.
6. The U.S. Department of Defence (DoD), Design of Buildings to Resist Progressive Collapse, Unified Facilities Criteria (UFC) 4-023-03, 2005.
7. Elvira, E., Mendis, P., Ngo, T., and Lam, N., Development of a Progressive Collapse Analysis Procedure for Concrete Frame Structures,
Proceedings of the 18th Australasian Conference
on the Mechanics of Structures and Materials, 1-3 December 2004, Perth, Australia, 2004, pp. 775-780.
8. de Witte, F.C. and Kikstra, W.P., Eds., DIANA
Finite Element Analysis, User’s Manual: Release
9. Australian/New Zealand Standards, Structural Design Actions: Part 1: Permanent, Imposed and
other Actions, AS/NZS 1170.1:2002, Standards
Australia and Standards New Zealand, 2002.
10.Collins, M.P. and Poresz, A., Shear Strength for High Strength Concrete, Bull. No. 193-Design
Aspects of High Strength Concrete, Comite Euro-International du Beton (CEB), 1989, pp. 75-83.
11.Hordijk, D., Local Approach to Fatigue of
Concrete, PhD Thesis, Delft University of