d,
Chief Editor: Henry Novianus Palit Petra Christian University Indonesia
Editorial Board: Willyanto Anggono Petra Christian University Indonesia
Leopoldo Eduardo C6rdenas-Barr6n Instituto Tecnologico y de Estudios-Superiores de Monterrey Mexico
Chi-Hung Chi CSIRO Australia Julien Dubois
Universite de Bourgogne France
Masashi Emoto
Akikusa Gakuen lunior College lapan
Akihiro Hayakawa Tohoku University lapan
Shiyong Liao
Ch ongq i ng U n i ve rsity of Technology China
Felix Pasila
Petra Christia n University Indonesia
Roberto Rojas-Cessa
New lersey Institute of Technology USA
Dong-Youn Shin
Pu kyong Nati ona I U n iv e rsity South Korea
Yung Ting
Chung Yuan Christian University Repubtic of China (Taiwan)
47
Hanny Hosiana Tumbelaka Petra Christian University Indonesia
I.N.G. Wardana BrawAaya University Indonesia Moeljono Widjaja
Agency for the Assessment and Application of Technology Indonesia
I Gede Agus Widyadana Petra Christia n Un iversity Indonesia
Jonas C.P. Yu
Takming University of Science and Technology
Republic of China (Taiwan)
JOURNAL CONTENT Search
r-tW=
Browse
. &y-.]ssrle
HO!.48 CALL TOR PAPERS AUTHCR GUIDTLIhIES ABOUT LCG IN ARCiJIVTS ANNOUNCTMENTS
lloffie > Vol 3, No 2 {2018}
Inteinational
Journai of
Industrial
Research
and
Applied Engineering
IIRAE is an Op€n Access peer-reviewed international journal
providing a medium for the academic and industrial community to
share cutting-edge research and development in various aspects of
industrial technology and applied engineering. The three-pronged objectives are:
. To encourage research work in the field of industrial technology and applied engineering among scientists, researchers,
engineering practitioners, and industrial experts to improve
efficiency, reduce costs, and generate high-quality products / services;
o To promote the adoption and development of comprehensive and
state-of-the-art technologies for enterprises and industries; . To bridge the.theoretical and practical gap between academia and
industry, and advocate collaboration to address enterprise and industry challenges.
- by the Ch ristian
IIRAE is published semiannually - in April and October
Institute of Research and Community Outreach, Petra University.
Vol3, No z (zor8)
Table of Contents
Articles
Expe.rjlueltaLStu,ly,af e(:&bri$t]4o Fluetj,i,i1fuan-,Be-d1lelion -Usrilq lfi: eylurde!' PIes-s,ule,Eslilne.ti-0,!L.i.[....6,assixre.Ersirc
Mitsuhisa Ichiyanagi, Willyanto Anggono, Edyta Dzieminska, Takashi Suzuki
D-e.vr*Losinerlar On:alar{Parylrop1( Lrl-{iex-!rcdrtlojj Mo.iel for
lrrje-cllsn L$rjr:rs-QJiLfuizatleft- ol-Pi.esc 1...E ii.si]1es
Mitsuhisa Ichiyanagi, Hayao loji, Hiroki Matsui, Emir Yilmaz, Takashi Suzuki
Deveiap.srerlof OnrEod.rd ln::eylrdet Gas llow liodel forlleal-Le s
E:ifl ,al,si-o i lieiEl-Lijgrrre"
Mitsuhisa Ichiyanagi, Kazuki Kojima, Hayao loji, Hiroki Matsui, Takashi Suzuki
Game PupirlaritLlthakL]gjysLcty)
Joseph Alexander Budiarto
Online ISSN: 2407-7259
EEEE viritorr, Vres/-siats
Indexed by:
Pl)t
5 1-60 elrr
br-bu
tDl
69-78
P,DT 79-85
. Sy Author . Bv Title
FONT SIZE
ffiffi
DIAECT*ftY
SF
tlFEl*
AsfrH$s
JSURF*AL$
Supported by:
ffi#
H,
q
..,
tJ,
li
l.p,
, lr.k
-t
'i{Chief Editor: Henry Novianus Palit Petra Christian University Indonesia
Editorial Bcrd:
Willyanto Anggono Petra Christian University Indonesia
Leopoldo Eduardo C6rdenas-Ba116n Instituto Tecnologico y de Estudios Superiores de Monterrey Mexico
Chi-Hung Chi CSIRO Austra lia lulien Dubois
Universite de Bourgogne France
Masashi Emoto
Akikusa Gakuen lunior College lapan
Akihiro Hayakawa Tohoku University lapan
Shiyonq Liao
Chongqi ng U ni ve rsity of Tech nology China
Felix Pasila
Petra Christian University Indonesia
Roberto Rojas-Cessa
New lersey Institute of Technology USA
Dong-Youn Shin
Pu kyong Nati ona I U ni versity South Korea
Yung Ting
Chung Yuan Christian University Republic of China (Taiwan) Hanny Hosiana Tumbelaka Petra Christian University Indonesia
I.N.G. Wardana BrawUaya University Indonesia Moeljono Widjaja
Agency for the Assessment and Appl ication of Technology Indonesia
I Gede Agus Widyadana Petra Ch ristia n U n i v-ersity
Indonesia Jonas C.P Yu
Takming University of Science and Technology
Republic of China (Taiwan)
]OURNAL CONTENT Search
I
m""""-;s,rninBrowse
. _B.gliglLe
i-{0,r1€ > Arehises
Archives
HOi4E CALL FOR PAPEI{S AUTHCR GUIDELINES ABOUT LOG IN ARCHIVTS ANr{OU tiCrHttJ"rS
-zorB
[ulg,
N{ialea$J
!lsl:-,Hs--{zsr8)
20t7
Vgl a, Ng
t{a.}_t*
20t6
Eal-r"-Ng-r{a-0_r6} 1-4of4Items
Online iSSN: 2407-7259
EIEH viritor* view sti]ts
Indexed by:
Wffir
wwrwl:ffiffiryqffi*x
Y*\
{*r*
i%
e
DtRECTfiRY
0F
A
fl&
&f\
'OPENACCESS
w*FW
,#{**,,,.
"}
JfrURNALS
i.
tr
-h"'' Chief Editor:
Henry Novianus Palit Petra Christian University Indonesia
Editorial Board: Willyanto Anggono Petra Christian University Indonesia
Leopoldo Eduardo Cdrdenas-Ba116n Instituto Tecnologico y de Estudios Superiores de Monterrey Mexico
Chi-Hung Chi CSIRO Australia Julien Dubois
Universite de Bourgogne France
Masashi Emoto
Akikusa Gakuen lunior College lapan
Akihiro Hayakawa Tohoku University lapan
Shiyong Liao
Chon gqi ng U n i ve rsity of Tech nology China
Felix Pasila
Petra Christian University Indonesia
Roberto Rojas-Cessa
New lersey Institute of Technology USA
Dong-Youn Shin
Pu kyon g Nati ona I U n i ve rsity South Korea
Yung Ting
Chung Yuan Christian University Republic of China (Taiwan) Hanny Hosiana Tumbelaka Petra Christian University Indonesia
I.N.G. Wardana Brawijaya University Indonesia
Moeljono Widjaja
Agency for the Assessment and Application of Technology Indonesia
I Gede Agus Widyadana Petra Christian University Indonesia
Jonas C.P Yu
Takming University of Science and Technalogy
Republic of China (Taiwan)
JOURNAL CONTENT Search
I
far
-,spssl;:, Browse
. By I5sue
l"iome > AL?{rui the Journa! > .JsurnaN Contact
4.,
Journal Contact
HCMT CALL FOI.1 PAFERS AU'THCR GUIi.1ILINES ASOIJI. LOG Ii\J ARCHIVTS
AN i\,IOU I'JCT Fl EI'I T 5
Mailing
Address
JIRAE office
Institute of Research and Community Outreach Petra Christian University
Siwalankerto 121-131, Surabaya - Indonesia
Principal
Contact
Henry Novianus Palit
Petra Christian University
Institute of Research and Community Outreach Petra Christian University
Siwalankerto 121-131, Surabaya - Indonesia Email : etr!ef:e_qJ.irn|@jij:at.,at:*
Support
Contact
Henry Palit
Email : ehief:edltoroji rEe-0lg
Online ISSN: 2407-7259
EIEE viritorr, ]li.e-w.
ste-t-$-Indexed by:
{*,
{**z
.?',
#
fttftE*T*ffiY
sr
* i:
fii ',r
#
gpru
Af;fis$s
L-*&W#ffi*#
sounNALs
h
!,,
chief Editor: Henry Novianus Palit Petra Christian University Indonesia
Editorial Board: Willyanto Anggono Petra Christian University lndonesia
Leopoldo Eduardo C5rdenas-Ba116n Instituto Tecnologico y de Estudios Superiores de MonterreY Mexico
Chi-Hung Chi CSIRO Australia Julien Dubois
Universite de Bou rgogne France
Masashi Emoto
Akikusa Gakuen Junior College lapan
Akihiro Hayakawa Tohoku University lapan
Shiyong Liao
Chongq ing U n i versity of Tech nol ogy
China Felix Pasila
Petra Christian University Indonesia
Roberto Rojas-Cessa
New Jersey Institute of Technology USA
Dong-Youn Shin
Pu kyong N ation a I U n iversity South Korea
Yung Ting
Chung Yuan Christian University Republic of China (Taiwan) Hanny Hosiana Tumbelaka Petra Christian University Indonesia
I.N.G. Wardana BrawUaya University Indonesia Moeljono Widjaja
Agency for the Assessment and Application of Technology Indonesia
I Gede Agus Widyadana Petra Christian University Indonesia
Jonas C.P. Yu
Takming lJniversity of Science and Technology
Republic of China (Taiwan)
JOURNAL CONTENT Search
I
f^t-"qf,gqtli; Browse
. Eylig-se
HC}MT CALL TOFI PAPERS AU'THOR GUIDTLINES ABOUT LOG IN ARCHIVES
Aiilltll i I.JCEl"'lEl'JTs
Hoirie > Aboui the -lournai > Iditsrial Teaffi ni
Editorial
Team
'Chief Editor
,l ej1ty'N,o-vj,ailI-s-.P-aI i i, Petra Ch ri sti a n U n i ve rsity, I nd o nesia
Editorial Board
lnj ! !.!y-ail!t..A l.gss-,i 0, Petra Ch risti a n U n i ve rsity, I ndon esi a
LeSpgldo fdu;rdo Cili-den , Instituto Tecnologico y de Estudios Superlores de Monterrey, Mexico
Chi-lllrnc C:hi, CSIRO, Australia
,l.uIie n ..D.ti,SO,!S, U n i ve rsite de Bo u rgo g ne, Fra n ce
Maeashi Enilto, Akikusa Gakuen lunior College, lapan Akihila,...Hay-atit"'r,;:,, Tohoku University, lapan
Shivonq Liao, Chongqing University of Technology, China f.e.l.iy...? asjl a, Petra Ch ri sti a n U n iversity, I nd o n esi a
Roberto Rojis-Cessa, New lersey Institute of Technology, United States
P!_!:1g.:y-e.|l*.. 5-l]i!, Pu kyon g Natio na I U n i ve rsity, Sou th Korea
Yunq Ting, Chung Yuan Christian University, Republic of China (Taiwan)
lj.s.n.Lry-.Hqs,!.F-,-]ilfu-I11be1-ak4, Petra Christian University, Indonesia i,S-=q-_wfld?na, Brawijaya University, Indonesia
.!lpellal:]a-.,!yid]aja, Agency for the Assessment and Application of Technology, Indonesia
I Gede Aqus Widvadana, Petra Christian University, lndonesia
.1,p.n.8.s..-g.D )',u-, Takming University of Science and Technology, Republic of China (Taiwan)
Online ISSN: 2407-7259
EME virito.r' Vreu,sieie
Indexed by:
w._*
*#x:&#
a*
@Wr*ffisr#fffi*ffiffiry.
ffi#ffi
7"ru.
f*'".
ffi
a
nlfi[tTfiftY
#r
i
WE
if\
iopunAosgss
+-*#
r,*"^#ff'
*...*#
Jo
u RNAt$
h_.
Chief Editor: Henry Novianus Palit Petra Christian University Indonesia
Editorial Board: Willyanto Anggono Petra Ch ristian University Indonesia
Leopoldo Eduardo Cdrdenas-Ba116n Instituto Tecnologico y de Estudios Superiores de Monterrey Mexico
Chi-Hung Chi CSIRO Australia Julien Dubois
Universite de Bourgogne
Fra nce Masashi Emoto
Akikusa Gakuen Junior College lapan
Akihiro Hayakawa Tohoku University lapan
Shiyong Liao
Chongq i ng U n i versity of Tech nol ogy China
Felix Pasila
Petra Christian University Indonesia
Roberto Rojas-Cessa
New )ersey Institute of Technology USA
Dong-Youn Shin
Pu kyong Nati onal U n i versity
South Korea Yung Ting
Chung Yuan Christian University Republic of China (Taiwan) Hanny Hosiana Tumbelaka Petra Christian University Indonesia
I.N.G. Wardana Brawijaya University Indonesia Moeljono Widjaja
Agency for the Assessment and Appl ication of Technology Indonesia
I Gede Agus Widyadana Petra Christian University Indonesia
Jonas C.P Yu
Takming University of Science and Technology
Republic of China (Taiwan)
]OURNAL CONTENT Search
I
lpilr
-Browse
. gy.lisue
HOMT CALI TOR PAPEF1S AUI'HCJR GUIDTLINES ABOUT LC}G IN ARCHIVES ANr!OU I'JCtlvlEl'JTs
lloffie > About the -lournai > SubsEEssic!',9
Submissions
>> QEliee Sutlrfi iesicfi s > gui.des io!:.Auliars
> C0fvright Notice > Pr.r.V.aCy $il"i Le.r'n?.trl
Online
Submissions
Already have a Username/Password for International lournal of Industrial Research and Applied Engineering?
qQ r_qt !",QGiu
Need a Username/Password? SQ,,],L&EG-ISISATIQil
Registration and login are required to submit items online and to check the status of current submissions.
Guides
for Authors
Authors need to accomodate their paper using )1.*hE...Dpp.g.f...!E.mp..lrtl.?,..
JIRAE is a peer-reviewed international journal providing a medium for the academic and
industrial community to share cutting-edge research and development in various aspects of industrial technology and applied engineering. The three-pronged objectives are:
. To encourage research work in the field of industrial technology and applied engineering among scientists, researchers, engineering practitioners, and industrial experts to improve efficiency, reduce costs, and generate high-quality products / services;
. To promote the adoption and development of comprehensive and state-of-the-art technologies for enterprises and industries;
. To bridge the theoretical and practical gap between academia and industry, and advocate collaboration to address enterprise and industry challenges.
The aims of JIRAE is to publish a wide range of research and application papers which describe, but not restricted to, laboratory, numerical investigations, report on full scale projects, detailed case studies, review articles as well as short communications and discussions. JIRAE welcomes papers with the above aim and scopes.
IIRAE is published semiannually - in April and October - by the Institute of Research and Community Outreach, Petra Christian University.
Plagiarism Screening
Plagiarism is a threat to scholarly publishing in general and to JIRAE in particular. Originality of the submitted work can be assured through plagiarism screening and rejection of suspected material. For maximum effectiveness, all articles submitted to IIRAE shall be sent to a plagiarism detection process prior to submission.
Review
All papers will be assigned to independent experts for pe'er-review. A single-blind review is applied, where authors' identities are known to reviewers. Based on the cofnments and advice of
the peer-reviewers, the Editor will make a decision to accept, to reject or to ask authors to revise
. Bv Author . Ey.-Ifle
FONT SIZE
anticipated. All reviewer comments should be responded to in a point-by-point fashion. Where the
autno6QfutiStb9*fth%8ffirosfb9,Efictvlfih*gfds4flt a crear response.
Production and Publication
Once accepted, the manuscript will undergo professional copy-editing, English editing, proofreading by the authors, final corrections, pagination, and, publication on
the hllp.;llwy.r_w_,jjrne'ars website.
Copyright/Open Access
Articles published in IIRAE will be Open-Access articles distributed under the terms and conditions of the Creative Commons Attribution License (CC BY). JIRAE allows the author(s) to hold the copyright and to retain the publishing rights.
Authors are responsible for obtaining permission to reproduce any figures from other copyright holder, for which copyright exists. e'
Submission
Preparation Checklist
As part of the submission process, authors are required to check off their submission's compliance
with all of the following items, and submissions may be returned to authors that do not adhere to these guidelines.
1. The submission has not been previously published, nor is it before anotherjournal for
consideration (or an explanation has been provided in Comments to the Editor). 2. The submission file is in Openoffice, Microsoft Word, RTF, or WordPerfect document file
format.
3. Where available, URLS for the references have been provided.
4. The text is single-spaced; uses a l2-point font; employs italics, rather than underlining (except with URL addresses); and all illustrations, figures, and tables are placed within the
text at the appropriate points, rather than at the end.
5. The text adheres to the stylistic and bibliographic requirements outlined in the Alltho-r 6uidelines, which is found in About the Journal.
6. If submitting to a peer-reviewed section of the journal, the instructions in llsu]iug_e,,L-r]j'td Review have been followed.
Copyright Notice
Authors who publish with this journal agree to the following terms:
1. Authors retain the copyright and publishing right, and grant the journal right of first
publication with the work simultaneously licensed under a Creatlve Co,nrnons Atttribution License that allows others to share the work with an acknowledgement of the work's authorship and initial publication in this journal.
2. Authors are able to enter into separate, additional contractual arrangements for the non-exclusive distribution of the journal's published verston of the work (e.9., post it to an institutional repository or publish it in a book), with an acknowledgement of its initial publication in this journal.
3. Authors are permitted and encouraged to post their work online (e.9., in institutional repositories or on their website) followingthe publication of the article, as it can lead to
productive exchanges, as well as earlier and greater citation of published work (See _l_!:e Effeef,0rcBe!_Aeecss).
Privaby Statement
The names and email addresses entered in this journal site will be used exclusively for the stated purposes of this journal and will not be made available for any other purpose or to any other party.
Online ISSN: 2407-7259 EM viritors Vjey{Slets
Indexed by:
E,
[,e
x"-
\"
ffq ffi.
#
ffilft[tTfiftY
Gf
#
h*
kf
',
"+upxr*
AfrfrHss
#
i%
_#f"*"''2._-a
J0UftNA,{_S
JIRAE, Vol. 3, No. 2, October 2018, 51–60 DOI: 10.9744/JIRAE.3.2.51-60 e-ISSN 2407-7259
51
Experimental Study of Combustion Fluctuation Reduction Using In-Cylinder
Pressure Estimation in Gasoline Engine
Mitsuhisa Ichiyanagi1,a, Willyanto Anggono1,2,3,b, Edyta Dzieminska1,c, Takashi Suzuki1,d
1
Department of Engineering and Applied Sciences, Sophia University, Tokyo, Japan
2
Mechanical Engineering Department, Petra Christian University, Surabaya, Indonesia
3
Centre for Sustainable Energy Studies, Petra Christian University, Surabaya, Indonesia
a
[email protected], [email protected], [email protected],
d
Abstract. Gasoline engines needs to reduce its negative emission waste and raise its thermal
efficiency. Previous studies have shown an improvement of engines by regulating the ignition timing and retaining the engine at certain air-to-fuel ratio. Additional development of the thermal efficiency is anticipated by reducing the oscillation of pressure due to combustion (referred to as combustion fluctuation) during each cycle. Reducing the combustion fluctuations promotes the generation of a stable combustion field and improves fuel consumption. Since the combustion fluctuations are significantly affected by the in-cylinder pressure at compression top dead center (referred to as TDC pressure), the present study proposes a method to estimate the TDC pressure in the next cycle. The estimation was conducted by measuring the in-cylinder pressure at exhaust valve opening in the given cycle. This study also developed the method to reduce the combustion fluctuations by using the TDC pressure estimation and controlling the ignition timing. In our experiments, it was found that the developed methods reduced the fluctuations of the indicated mean effective pressure (IMEP), the maximum in-cylinder pressure, and the TDC pressure by 62.1%, 51.2%, and 38.5%, respectively.
Keywords: Combustion Fluctuation, In-Cylinder Pressure, IMEP, Spark Ignition Engine, Ignition
Timing Control.
1. Introduction
In response to the requirements for increasing the fuel efficiency and reducing the harmful exhaust gas generation in gasoline engines, the previous studies have observed some of the regulatory requirements by adjusting the air-to-fuel ratio (A/F), the timing for ignition, and other performance factors of engine [1–9]. However, one factor is not considered as part of improving the variation of pressure in the combustion stroke per cycle. This factor is known as “combustion fluctuation” and degrades the engine performance. Although the techniques such as the lean-burn and the exhaust gas recirculation (EGR) have been proposed for improving the fuel consumption and the exhaust gas emission, they also give an increase in the combustion fluctuation. Some studies have reported that the reduced combustion fluctuation can decrease the harmful exhaust emissions and increase the fuel efficiency [10– 16]. Consequently, it is expected to develop a new method that consider the reduction of combustion fluctuation.
The previous studies have revealed several key characteristics of the combustion fluctuation [17–20]. Since the pressure fluctuations in the intake, compression, and expansion strokes are extremely small in comparison with those in the combustion stroke, these small fluctuations can be regarded as identical in successive cycles. Accordingly, the combustion
Ichiyanagi, M. et al. / Experimental Study of Combustion Fluctuation Reduction / JIRAE, Vol. 3, No. 3, October 2018, pp. 51–60
52 causes keeping the maximum in-cylinder pressure and the IMEP as well as reducing the combustion fluctuation. Furthermore, the present reduction method was validated by applying these methods to a single cylinder at a given engine speed under the lean-burn conditions which are equal to the high A/F conditions.
2. Experimental Setup and Condition
2.1. Experimental Setup
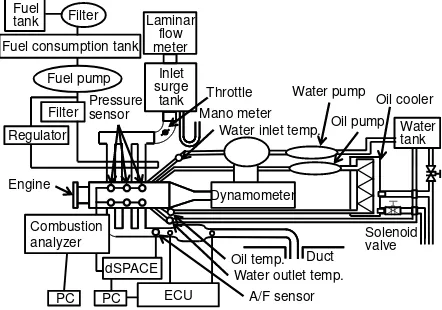
Figure 1 shows the experimental system configuration including the electronic control unit (ECU) for the ignition timing and A/F control, and Table 1 lists the specifications of the engine used in the experiments. The engine speed was maintained under constant value by using the low inertia dynamometer (Horiba, Ltd., Dynas3 LI250), whose absorbing rated power is 250 kW and absorbing rated speed is 4980 r.min−1. The temperatures of cooling water and lubricating oil were held constant at 80°C by using temperature regulator. The cylinder head was equipped with the piezoelectric pressure transducer (Kistler Japan Co., Ltd., 6117A) to measure the in-cylinder pressure with 0.001 MPa resolution at 1 °CA intervals in conjunction with the rotary encoder, along with the data logger. On the other hand, the required resolution for the pressure measurement in the present study was on the order of 1/100 for the TDC pressure (0.01 MPa), which means that the pressure sensor used in the present study satisfied the required resolution. The influence of the drift in the obtained data was negligible, because the pressure data were adjusted for the bottom dead center (BDC) pressure at the intake stroke in each cycle. The A/F sensor (Horiba, Ltd, MEXA-720NOx) was set at 370 mm downstream from the cylinder block. The newly developed method was used to control the ignition timing for the actual engine, which was programmed by using the numerical analysis software (MathWorks, Inc., MATLAB®) and transmitted to the ECU via the multi-channel A/D board (dSPACE GmbH, DS2002).
Figure 1. Schematic diagram of the experimental
gasoline engine with engine control unit and pressure sensor for pressure measurement in the cylinder
Table 1. Specification of gasoline engine
Type Gasoline 4 stroke
Layout of engine V type 6 cylinder
Shape of chamber room Pent roof type
Displacement 3.456 L
Fuel injection type EFI, Direct injection
2.2. Experimental Conditions
Table 2 shows the experimental conditions whose condition 1 was used in Section 3 and conditions 2 and 3 were used in Section 4. The experiments under the condition 1 were performed by varying only the A/Fs while the engine speed and the ignition timing were set to be constant. The results were used to propose the estimation method for the TDC pressure in the next cycle by using the in-cylinder pressure in the given cycle and to develop the reduction method of the combustion fluctuation. The experiments described in Section 4 were performed to validate the reduction method developed in Section 3. Both the engine speed and the A/F were kept at the constant value, while the ignition timing was changed either manually (the condition 2, absence of control) or automatically (the condition 3, with control). Without the control conditions, 7 ignition times were manually set and the IMEP from the time evolution of the in-cylinder pressure for each ignition timing condition was evaluated. With the control conditions, the standard ignition timing was set at 35 °CA before TDC, which is the reference ignition timing of original ECU. The IMEP was evaluated when the TDC pressure was in constant value by controlling the ignition timing. For all experimental conditions, the fuel injection rate correction through the feedback control using the oxygen sensor was not conducted.
Table 2. Experimental condition
Condition 1 (for Section 3)
Engine speed [r.min−1] 1,800
Boost pressure [kPa] −66.7
Coolant temperature [K] 353
Air temperature [K] 296
Ignition timing (BTDC) [°CA] 35
Air-to-fuel ratio [–] 14.7, 16.0, 16.5, 17.0
Condition 2 (for Section 4)
Engine speed [r.min−1] 1,800
Boost pressure [kPa] −66.7
Coolant temperature [K] 353
Air temperature [K] 296
Ignition timing (BTDC) [°CA] 29, 31, 33, 35, 37, 39, 41
Air-to-fuel ratio [–] 17.0
Ignition timing control Without control
Condition 3 (for Section 4)
Engine speed [r.min−1] 1,800
Boost pressure [kPa] −66.7
Coolant temperature [K] 353
Air temperature [K] 296
Ignition timing (BTDC) [°CA] 35 (changed by control)
Air-to-fuel ratio [–] 17.0
Ignition timing control With control
Dynamometer Fuel
tank Filter Fuel consumption tank
Fuel pump
Filter Regulator
Laminar flow meter
Inlet surge
tank
Mano meter Throttle
Engine
ECU
Duct
PC dSPACE
Water pump
Oil pump Water tank Oil cooler
Solenoid valve Water inlet temp.
Water outlet temp. Oil temp. Pressure
sensor
A/F sensor Combustion
analyzer
Ichiyanagi, M. et al. / Experimental Study of Combustion Fluctuation Reduction / JIRAE, Vol. 3, No. 3, October 2018, pp. 51–60
53
3. Development of Reduction Method of
Combustion Fluctuation
3.1. Relationship between IMEP and TDC Pressure
Figure 2 shows in-cylinder pressure curves in respect to the angle of the crank, which were obtained for a randomly selected set of five cycles. The ignition timing of this condition was set at 35 °CA before TDC (thus = 325 °CA). We could observe the combustion fluctuations in the approximate range of 10 °CA before TDC (thus = 350 °CA) to 20 °CA after TDC ( = 380 °CA), which should be reduced by maintaining almost the same in-cylinder pressure curves during each cycle. The IMEP is generally used as an indicator to the state of combustion in gasoline engines and its calculation requires the integration of the in-cylinder pressure during each cycle. Thus, the IMEP is inappropriate to a control indicator for the reduction of combustion fluctuation.
Figure 2. Pressure as function of crank angle under
condition 1 at A/F of 17.0
The previous studies show the qualitative correlation between the IMEP, PIMEP, and the maximum
in-cylinder pressure, Pmax. Figure 3 plots the time
evolutions of the IMEP and the ultimate in-cylinder pressure with condition 1 at A/F of 17.0. Figure 4 shows the distributions of the probability density functions, in which PIMEP and Pmax represent the
absolute difference values from the 500 cycle average
PIMEP and those from the 500 cycle average Pmax,
respectively. The quantitative evaluation, the standard deviation, the averaged value, and the oscillation ratio of PIMEP and Pmax under the condition 1 at each of the
four A/Fs are shown in Table 3, where the fluctuation ratio was defined as the standard deviation divided by the average value. It is obvious from Table 3 that the fluctuation ratios for both PIMEP and Pmax increase with
increasing the A/F (i.e., the lean-burn condition), which suggests that there is a correlation between the above two parameters.
Figure 5 shows the correlation between the IMEP and the ultimate in-cylinder pressure with condition 1 at the A/F of 17.0, and the solid line indicates the correlation line. The figure provides the quantitative confirmation of the positive correlation between the two
Figure 3. Evolution of time for (a) IMEP and (b) ultimate
in-cylinder pressure with condition 1 at A/F of 17.0
Figure 4. Distribution of probability density with function
of absolute value of difference for (a) IMEP and (b) maximum in-cylinder pressure with condition 1 at A/F of 17.0
Crank angle, (n) [deg.]
300 330 360 390 420
Pres
s
ur
e,
P
(
n
) [MPa]
0.0 0.5 1.0 1.5 2.0 2.5 3.0
Cycle number [-]
0 100 200 300 400 500
PIM
E
P
(
n
) [k
Pa]
290 300 310 320 330 340 (a)
Cycle number [-]
0 100 200 300 400 500
Pmax
(
n
) [
MPa]
1.5 2.0 2.5 3.0 3.5
(b)
PIMEP [kPa]
0 5 10 15 20 25
Prob
ab
ili
ty
[-]
0.00 0.05 0.10 0.15 0.20 0.25 0.30
(a)
Pmax [MPa]
0.0 0.2 0.4 0.6 0.8 1.0
Prob
ab
ili
ty
[-]
0.00 0.05 0.10 0.15 0.20
Ichiyanagi, M. et al. / Experimental Study of Combustion Fluctuation Reduction / JIRAE, Vol. 3, No. 3, October 2018, pp. 51–60
54 parameters with a correlation coefficient of 0.59, and the similar correlation coefficients were obtained for all four A/Fs in the condition 1. Since the correlation coefficient larger than 0.5 was regarded as indicating the moderately strong correlation, the combustion fluctuation was evaluated by using Pmax, instead of PIMEP. As shown in Table 3, since the largest fluctuation
ratio was observed at the A/F of 17.0, we developed the reduction method of the combustion fluctuation (described in Section 3.2) and validated the effectiveness of the method (described in Section 4) under the condition of the A/F of 17.0.
Table 3. Standard deviation average value and fluctuation
ratio of (a) IMEP and (b) ultimate in-cylinder pressure with condition 1 at each A/F
(a) IMEP, PIMEP
Air-to-fuel ratio [–]
Average [kPa]
Standard deviation [kPa]
Fluctuation ratio [%]
14.7 355 3.45 0.97
16.0 339 3.66 1.08
16.5 329 3.82 1.16
17.0 316 5.03 1.59
(b) Maximum in-cylinder pressure, Pmax
Air-to-fuel ratio [–]
Average [MPa]
Standard deviation [MPa]
Fluctuation ratio [%]
14.7 2.91 0.17 5.95
16.0 2.75 0.16 5.97
16.5 2.62 0.17 6.42
17.0 2.45 0.20 8.23
Figure 5. Relationship between maximum in-cylinder
pressure and IMEP under condition 1 at A/F of 17.0; solid line indicates the correlation line
Furthermore, in accordance with the computational processing speed and the data transmission speed, the in-cylinder pressure used in the control was obtained at 0.25 ms intervals for the implementation of the procedure developed in Section 3.2. With the engine speed of 1,800 r.min−1 used throughout this study, this interval corresponded to the sampling rate for every 2.7 °CA. Since the maximum in-cylinder pressure, Pmax,
occurs at a different crank angle in each cycle, it is necessary to obtain the pressure data at the sampling rate for every 1 °CA at least. Hence, the use of the maximum in-cylinder pressure for controlling the ignition timing process with the present system would
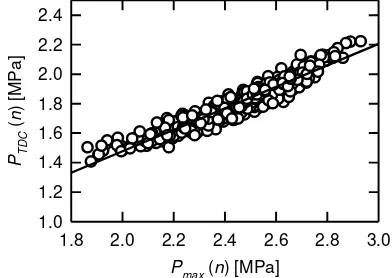
result in the decreased accuracy (in the future, an increase in computational processing speed and data transmission speed may overcome this shortcoming). The present study investigated the tentative use of the TDC pressure, PTDC, as the control indicator, in place of Pmax. Figure 6 shows the correlation between the TDC
pressure and the maximum in-cylinder pressure, and the correlation coefficient between the two pressures was estimated to be 0.95. This result indicated that PTDC was
substituted for Pmax as the control indicator for the
reduction of combustion fluctuation under the present conditions shown in Table 2.
Figure 6. Relationship between TDC pressure and
maximum in-cylinder pressure under condition 1 at A/F of 17.0
3.2. Combustion Fluctuation Reduction Method by
Using TDC Pressure
As described in Section 3.1, the TDC pressure is the indicator of combustion fluctuation. To accommodate such condition, we considered a method for the estimation of the TDC pressure in the next cycle and proposed a method for the reduction of combustion fluctuation based on the estimated TDC pressure through the ignition timing control. The previous studies [37–40] showed that the above pressures are dependent on the in-cylinder pressure at the exhaust-valve opening (referred to as EVO pressure) and the in-cylinder pressure at the intake-valve opening (referred to as IVO pressure), and the inter-cycle changes in the IVO pressure were much smaller than those in the EVO pressure. Thus, the TDC pressure, PTDC, might be
expected to correlate closely to the EVO pressure, P4. If
the cycle-averaged TDC pressure in the next cycle,
PTDC-ave (n+1), could be predicted by measuring the
cycle-averaged EVO pressure in the given cycle, P4-ave
(n), a similar TDC pressure in successive cycles by adjusting the ignition timing would be obtained, and thereby reduce the combustion fluctuation. Hence, Figure 7 shows the correlation between PTDC-ave (n+1)
and P4-ave (n), where correlation coefficient was
evaluated to be 0.88. Since this relation had the strong negative correlation, the empirical formula was expressed with the following equation:
1
33.8 4
10.8TDC ave ave
P n P n . (1)
PIMEP (n) [kPa]
290 295 300 305 310 315 320 325 330 Pmax
(
n
) [
MPa]
1.8 2.0 2.2 2.4 2.6 2.8 3.0
Pmax (n) [MPa]
1.8 2.0 2.2 2.4 2.6 2.8 3.0 PTDC
(
n
) [
MPa]
Ichiyanagi, M. et al. / Experimental Study of Combustion Fluctuation Reduction / JIRAE, Vol. 3, No. 3, October 2018, pp. 51–60
55 As shown in Figure 7, the above parameters were evaluated using the cycle-averaged values. This was attributed to decrease the stochastic variations of the combustion fluctuation, which causes increase in the estimation accuracy of Eq. (1). Figure 8 shows the correlation coefficient between the experimental data and the estimated values for the TDC pressure, which clearly indicates that the estimation accuracy was substantially increased by averaging over more than 5 cycles. In this section, the following reduction method of the combustion fluctuation was developed by controlling the ignition timing in the next cycle with the averaged data from the preceding 5-cycles (including the given cycle).
Figure 7. Relationship between cycle-averaged TDC
pressure and cycle-averaged EVO pressure under condition 1 at A/F of 17.0
Figure 8. Relationship among correlation coefficient
and averaged cycle number
The approach for the prediction of the ignition timing in next cycle to achieve a constant TDC pressure was essentially as follows: The previous studies noted that the variations in the TDC pressure or the maximum in-cylinder pressure were induced by the change in the combustion initiation position during each cycle. Thus, the present study examined the correlation between the TDC pressure, PTDC-ave (n+1), and the combustion
initiation position, 10 (n+1), (defined as the crank angle
at 10th part of the maximum rate of heat generation in the present study), as shown in Figure 9. The empirical
formula for this correlation was derived with the following equation:
10 n 1 30.0PTDC n 1 376
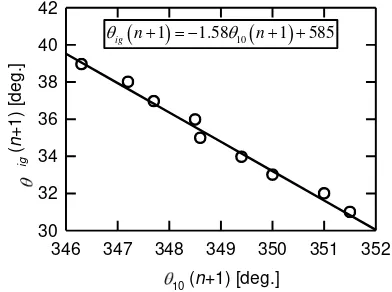
. (2) This equation could then be applied to estimate the combustion initiation position of the TDC pressure calculated from Eq. (1). Figure 10 shows the correlation between 10 (n+1) and the ignition timing, ig (n+1)
(defined as the spark advance from TDC), and the empirical equation was represented as:
1
1.58 10
1
585ig n n
. (3)
Figure 9. Relationship among the 10th part of crank
angle with ultimate rate of heat generation and cycle-averaged TDC pressure with condition 1 at A/F of 17.0
Figure 10. Relationship among ignition timing before
TDC and the 10th part of crank angle with ultimate rate of heat generation with condition 1 at A/F of 17.0
This equation indicated that the ignition timing of 1.58 °CA could be advanced or retarded by changing the combustion initiation position of 1 °CA. In order to provide the constant estimated combustion initiation position for the next cycle, the ignition timing correction angle, SA (n+1), was introduced by the
following equation:
1
1.58
10( 1)
SA n n set
, (4)
where set [°CA] was the target crank angle of the
combustion initiation position. Figure 11 shows the
P4-ave (n) [MPa]
0.255 0.260 0.265 0.270 0.275 0.280 PT
D
C
-a
v
e
(
n
+1
) [MPa]
1.2 1.4 1.6 1.8 2.0 2.2 2.4
1
33.8 4
10.8TDC ave ave
P n P n
Averaged cycle number [-]
0 5 10 15 20
C
or
re
la
tion
c
oe
ffic
ie
nt [-]
0.0 0.2 0.4 0.6 0.8 1.0
PTDC-ave (n+1) [MPa]
0.6 0.7 0.8 0.9 1.0 1.1 1.2
10
(
n
+1)
[deg.]
340 345 350 355 360 365
10 n 1 30.0PTDC n 1 376
1
1.58 10
1
585ig n n
10 (n+1) [deg.]
346 347 348 349 350 351 352
ig
(
n
+1)
[deg.]
Ichiyanagi, M. et al. / Experimental Study of Combustion Fluctuation Reduction / JIRAE, Vol. 3, No. 3, October 2018, pp. 51–60
56 schematic diagram of the ignition timing correction technique for the reduction of the combustion fluctuation, which procedure was essentially as follows: (1) The 5-cycle-averaged EVO pressure, P4-ave (n),
was measured by using the pressure sensor, and the 5-cycle-averaged TDC pressure in the next cycle, PTDC-ave (n+1) was estimated by applying P4 -ave (n) to Eq. (1).
(2) Since the variation in the TDC pressure was caused by a change in the combustion initiation position during each cycle, the combustion initiation position in the next cycle, 10 (n+1), was
estimated by applying PTDC-ave (n+1) to Eq. (2).
(3) The ignition timing was corrected by applying Eq. (4) to 10 (n+1), which causes to keep the TDC
pressure constant and reduce the combustion fluctuation.
Additionally, the robust performance of the developed ignition timing correction technique was discussed in Section 4. The target values in Sections 4.1 and 4.2 were set at the combustion initiation position represented as the averaged TDC pressure in the preceding 5 cycles (hereinafter referred to as average correction technique) and that as the maximum TDC pressure in the preceding 5 cycles (hereinafter referred to as maximum correction technique).
Figure 11. Review of developed method to decrease
combustion oscillation by estimating TDC pressure and controlling ignition timing
4. Results and Discussion
4.1. Combustion Fluctuation Reduction by Average
Correction Technique
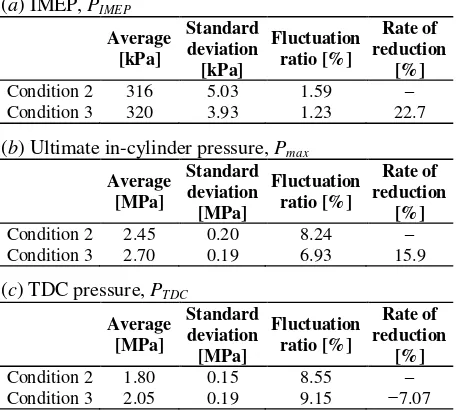
The experiments were performed under the condition 3 by controlling the ignition timing in the next cycle with the average correction technique. Table 4 summarizes the average values, the standard deviations, the fluctuation ratios (well-defined as the standard deviation divided by the average value) and the rate of reduction (defined as the percentage change from the fluctuation ratio of condition 2 to the fluctuation ratio of condition 3) of the IMEP, PIMEP, the
maximum in-cylinder pressure, Pmax, and the TDC
pressure, PTDC, under the conditions 2 and 3. Based on
the fluctuation ratios in the IMEP and the maximum in-cylinder pressure, their ratios under the condition 3
were smaller than those under the condition 2, and thus, the average correction technique resulted in decreasing the fluctuation of the IMEP and the maximum in-cylinder pressure slightly, compared with the condition without the correction technique, which was identified as reducing the combustion fluctuation. However, Table 4 exhibits that only the fluctuation ratio in the TDC pressure was increased by using the average correction technique, and this was attributed to the ignition timing correction in the retard direction.
Table 4. Average value, standard deviation, fluctuation
ratio and rate of reduction of (a) IMEP, (b) maximum in-cylinder pressure, and (c) TDC pressure under conditions 2 and 3 with control by using average correction technique
(a) IMEP, PIMEP
Average [kPa] Standard deviation [kPa] Fluctuation ratio [%] Rate of reduction [%]
Condition 2 316 5.03 1.59 –
Condition 3 320 3.93 1.23 22.7
(b) Ultimate in-cylinder pressure, Pmax
Average [MPa] Standard deviation [MPa] Fluctuation ratio [%] Rate of reduction [%]
Condition 2 2.45 0.20 8.24 –
Condition 3 2.70 0.19 6.93 15.9
(c) TDC pressure, PTDC
Average [MPa] Standard deviation [MPa] Fluctuation ratio [%] Rate of reduction [%]
Condition 2 1.80 0.15 8.55 –
Condition 3 2.05 0.19 9.15 −7.07
In a typical example, the maximum and minimum ignition timing correction angles, SA, were +3.8 °CA
and −5.7 °CA, and it continued to alternate between the advance and retard directions in approximately every 10 cycles. This ignition timing correction in the retard direction was caused by condition as follows: When examining the measured pressure data, approximately 10% of the TDC pressures showed extremely low values due to the stochastic variations of the combustion fluctuation. Since the target value was set at the average of the TDC pressure in the preceding 5 cycles, the use of the extremely low pressure data generated the lower target value. Afterward, the ignition timing was corrected in the retard direction. This fact indicates that the TDC pressure was hardly changed although the maximum in-cylinder pressure was fluctuated, because the combustion initiation position was also retarded and the pressure at approximately 350 °CA in Figure 2 was measured as the TDC pressure. For the above case, since there was the weak correlation between the maximum in-cylinder pressure and the TDC pressure, the reduction method with the average correction technique could not be applied to this case. Therefore, the lack of a limit on the ignition timing correction angle (SA (n+1)) led to the significant
PTDC-ave(n)
PTDC-ave(n+1)
P4-ave(n)
10(n+1)
ig(n+1)
(1)
(2) (3)
Crank angle [deg.]
Ichiyanagi, M. et al. / Experimental Study of Combustion Fluctuation Reduction / JIRAE, Vol. 3, No. 3, October 2018, pp. 51–60
57 correction of the ignition timing in the retard direction and to an increase in the fluctuation ratio in the TDC pressure. Based on the above facts, we considered that the effect of the extremely low TDC pressure could be decreased by using the maximum TDC pressure in the preceding 5 cycles as the target value, and the results using the maximum correction technique are discussed in Section 4.2.
4.2. Combustion Fluctuation Reduction by
Maximum Correction Technique
The experiments were performed under the condition 3 by controlling the ignition timing in the next cycle with the maximum correction technique. Table 5 summarizes the average values, the standard deviations, the fluctuation ratios and the rate of reduction of the IMEP, PIMEP, the maximum in-cylinder
pressure, Pmax, and the TDC pressure, PTDC, under the
conditions 2 and 3. Since the target value was set at the maximum TDC pressure in the preceding 5 cycles, it was suggested that the control of the ignition timing gives rise to all the pressures listed in Table 5 and decrease their standard deviations. Under the present experimental conditions, the maximum and the minimum ignition timing correction angles, SA (n+1),
were +3.8 °CA and ±0.0 °CA, respectively, which means that there was no correction of ignition timing in the retard direction. With the maximum correction technique, the fluctuation ratios of all three parameters were evaluated to be 0.60%, 4.02% and 5.26%, respectively, which was greater reduction in the combustion fluctuation than the results without the correction technique (1.59%, 8.24% and 8.55%) and those with the average correction technique (1.23%, 6.93% and 9.15%).
Table 5. Standard deviation, rate of reduction, average
value, and fluctuation ratio of (a) IMEP, (b) ultimate in-cylinder pressure, and (c) TDC pressure under conditions 2 and 3 using control by utilizing ultimate correction technique
(a) IMEP, PIMEP
Average [kPa]
Standard deviation [kPa]
Fluctuation ratio [%]
Rate of reduction
[%]
Condition 2 316 5.03 1.59 –
Condition 3 321 1.93 0.60 62.1
(b) Ultimate in-cylinder pressure, Pmax
Average [MPa]
Standard deviation [MPa]
Fluctuation ratio [%]
Rate of reduction
[%]
Condition 2 2.45 0.20 8.24 –
Condition 3 2.70 0.11 4.02 51.2
(c) TDC pressure, PTDC
Average [MPa]
Standard deviation [MPa]
Fluctuation ratio [%]
Rate of reduction
[%]
Condition 2 1.80 0.15 8.55 –
Condition 3 2.05 0.11 5.26 38.5
Figure 12 plots the distributions of probability density functions of the absolute difference values from the average IMEP, PIMEP, the averaged maximum
in-cylinder pressure, Pmax, and the average TDC pressure,
PTDC. For examining the ability of the average
correction technique and the maximum correction technique, Figure 12 also shows the results obtained without the ignition timing control (under the condition 2 when using the standard ignition timing of 35 °CA before TDC). The term of PIMEP in Figure 12
represents the absolute difference values between the measured PIMEP and the average PIMEP, and the other
two parameters were also evaluated here.
Figure 12. Distribution of probability density with
function of absolute value of difference for (a) IMEP, (b) ultimate in-cylinder pressure, and (c) TDC pressure under condition 2 absence of control and condition 3 using control by utilizing both average correction technique and ultimate correction technique
PIMEP [kPa]
0 5 10 15 20
Pro
ba
bi
lity [-]
0.0 0.1 0.2 0.3 0.4 0.5 0.6
Without control
Average correction technique Maximum correction technique
(a)
Pmax [MPa]
0.0 0.1 0.2 0.3 0.4 0.5 0.6
Prob
ab
ili
ty
[-]
0.0 0.1 0.2 0.3 0.4 (b)
PTDC [MPa]
0.0 0.1 0.2 0.3 0.4 0.5 0.6
Prob
ab
ili
ty
[-]
Ichiyanagi, M. et al. / Experimental Study of Combustion Fluctuation Reduction / JIRAE, Vol. 3, No. 3, October 2018, pp. 51–60
58 The results shown in Figure 12 clearly indicated that the probabilities of PIMEP, Pmax and PTDC close to
zero (thus, close to each average value) were increased by using the maximum correction technique, compared with the results using the average correction technique. This fact reveals that the fluctuation ratios of all three parameters were reduced, and thus, it was confirmed that the present developed method with the maximum correction technique had the advantage to reduce the combustion fluctuation.
5. Conclusions
For the reduction of the combustion fluctuation, this study suggested the approach to predict the TDC pressure in the next cycle and developed two types of methods to maintain a constant TDC pressure by controlling the ignition timing.
The ignition timing control by the average correction technique was found to reduce the fluctuation ratios of the IMEP and the maximum in-cylinder pressure by 22.7% and 15.9%, respectively. On the other hand, the fluctuation ratio of the TDC pressure was increased by 7.07%.
The ignition timing control by the maximum correction technique was found to reduce the fluctuation ratios of the IMEP, the maximum in-cylinder pressure, and the TDC pressure by 62.1%, 51.2%, and 38.5%, respectively. This result showed the effectiveness of this reduction method.
References
1. Suzuki, K., Miyazaki, T., Nemoto, M. and Machida, K., Optimum Control of Spark Ignition Timing in a Gasoline Engine Using Model Based Methodology,
Proc. of 2005 JSAE Autumn Convention, 2005, Paper No. 20055773.
2. Xiao, B., Wang, S., and Prucka, R., A Semi-Physical Artificial Neural Network for Feed Forward Ignition Timing Control of Multi-Fuel SI Engines, SAE 2013 World Congress & Exhibition, Detroit (MI, USA), Apr. 2013, SAE Technical Paper 2013-01-0324, doi: 10.4271/2013-01-0324. 3. Zhao, Y., Shen, T., and Jiao, X., Air-Fuel Ratio
Transient Control Design for Gasoline Engines Based on Individual Cylinder Air Charge Estimation, 17th Asia Pacific Automotive Engineering Conference, Bangkok (Thailand), Apr. 2013, SAE Technical Paper 2013-01-0102, doi: 10.4271/2013-01-0102.
4. Takiyama, T., Investigation on the Highly Precise Air Fuel Ratio Adaptive Control in Transient States under Changes in the Intake Valve Opening Timing,
SAE 2014 World Congress & Exhibition, Detroit (MI, USA), Apr. 2014, SAE Technical Paper 2014-01-1162, doi: 10.4271/2014-01-1162.
5. Ingesson, G., Yin, L., Johansson, R., and Tunestal, P., Simultaneous Control of Combustion Timing and Ignition Delay in Multi-Cylinder Partially
Premixed Combustion, SAE International Journal of Engines, 8(5), Nov. 2015, pp. 2089–2098, doi:
10.4271/2015-24-2424.
6. Ranga, A., Surnilla, G., Thomas, J., Sanborn, E. and Linenberg, M., Adaptive Algorithm for Engine Air – Fuel Ratio Control with Dual Fuel Injection Systems, SAE 2017 World Congress Experience (WCX), Detroit (MI, USA), Apr. 2017, SAE Technical Paper 2017-01-0588, doi: 10.4271/2017-01-0588.
7. Simmons, T.C. and Markoski, L.J., Innovative Carburetor Design with Dynamic Air to Fuel Ratio (AFR) Control for Improved Fuel Economy and Reduced Emissions, JSAE/SAE 23rd Small Engine
Technologies Conference (SETC), Jakarta
(Indonesia), Nov. 2017, SAE Technical Paper 2017-32-0003.
8. Suzuki, T. and Ichiyanagi, M., Robust Control Design for Air-Fuel Ratio Fluctuation of Gasoline Engine (1st Report: Development of Feed-Forward Controller with Heat Transfer Model at Intake),
Journal of Japan Society for Design Engineering, 53(5), 2018, pp. 377–390, doi: 10.14953/jjsde.2017. 2757.
9. Suzuki, T. and Ichiyanagi, M., Robust Control Design for Air-Fuel Ratio Fluctuation of Gasoline Engine (2nd Report: Application of Feed-Forward Controller with Heat Transfer Model at Intake to Multiple Cylinder Engine), Journal of Japan Society for Design Engineering, 53(5), 2018, pp. 391–400,
doi: 10.14953/jjsde.2017.2758.
10.Vance, J.B., Kaul, B.C., Jagannathan, S., and Drallmeier, J.A., Output Feedback Controller for Operation of Spark Ignition Engines at Lean Conditions Using Neural Networks, IEEE Transactions on Control Systems Technology, 16(2), Mar. 2008, pp. 214–228, doi: 10.1109/TCST.2007. 903368.
11.Inoue, T., Matsushita, S., Nakanishi, K., and Okano, H., Toyota Lean Combustion System – The Third Generation System, SAE 1993 International Congress & Exposition, Detroit (MI, USA), Mar. 1993, SAE Technical Paper 930873, doi: 10.4271/ 930873.
12.Obermair, H., Scarcelli, R., and Wallner, T., Efficiency Improved Combustion System for Hydrogen Direct Injection Operation, SAE 2010 Powertrains Fuels & Lubricants Meeting, San Diego (CA, USA), Oct. 2010, SAE Technical Paper 2010-01-2170, doi: 10.4271/2010-01-2170.
13.Scarcelli, R., Matthias, N., and Wallner, T., Numerical Investigation of Combustion in a Lean Burn Gasoline Engine, 11th International Conference on Engines & Vehicles (ICE), Napoli (Italy), Sep. 2013, SAE Technical Paper 2013-24-0029, doi: 10.4271/2013-24-0029.
Ichiyanagi, M. et al. / Experimental Study of Combustion Fluctuation Reduction / JIRAE, Vol. 3, No. 3, October 2018, pp. 51–60
59
Exhibition, Detroit (MI, USA), Apr. 2015, SAE Technical Paper 2015-01-1254, doi: 10.4271/2015-01-1254.
15.Lehrheuer, B., Pischinger, S., Wick, M., Andert, J. Berneck, D., Ritter, D., Albin, T., and Thewes, M., A Study on In-Cycle Combustion Control for Gasoline Controlled Autoignition, SAE 2016 World Congress & Exhibition, Detroit (MI, USA), SAE Technical Paper 2016-01-0754, doi: 10.4271/2016-01-0754.
16.Takahashi, D., Nakata, K., Yoshihara, Y., and Omura, T., Combustion Development to Realize High Thermal Efficiency Engines, SAE International Journal of Engines, 9(3), 2016, pp. 1486–1493, doi: 10.4271/2016-01-0693.
17.Kurino, S., Internal Combustion Engine Engineering, Sankaido Publishing, 1989.
18.Gomi, T., Automotive Engineering: Vol. 4 Gasoline Engine, Sankaido Publishing, 1980.
19.Heywood, J., Internal Combustion Engine Fundamentals, McGraw-Hill Education, 1988. 20.Ravaglioli, V., Ponti, F., De Cesare, M., Stola, F.,
Carra, F., and Corti, E., Combustion Indexes for Innovative Combustion Control, SAE International Journal of Engines, 10(5), 2017, pp. 2371–2381,
doi: 10.4271/2017-24-0079.
21.Nishida, K., Kaneko, T., Takahashi, Y., and Aoki, K., Estimation of Indicated Mean Effective Pressure Using Crankshaft Angular Velocity Variation,
JSAE/SAE 17th Small Engine Technologies
Conference (SETC), Sapporo (Japan), Nov. 2011, SAE Technical Paper 2011-11-08, doi: 10.4271/ 2011-32-0510.
22.Anderson, D., Callies, J., Xiao, B., and Prucka, R., In-Cylinder Thermodynamic Analysis for Performance Engine Development, SAE 2012 World Congress & Exhibition, Detroit (MI, USA), Apr. 2012, SAE Technical Paper 2012-01-1170, doi: 10.4271/2012-01-1170.
23.Yang, Z., Steffen, T., Stobart, R., and Winward, E., A Predictive Model of Pmax and IMEP for
Intra-Cycle Control, SAE 2014 World Congress & Exhibition, Detroit (MI, USA), Apr. 2014, SAE Technical Paper 2014-01-1344, doi: 10.4271/2014-01-1344.
24.Ding, S., Yang, L., Song, E., and Ma, X., Investigations on In-Cylinder Pressure Cycle-to-Cycle Variations in a Diesel Engine by Recurrence Analysis, SAE 2015 World Congress & Exhibition, Detroit (MI, USA), Apr. 2015, SAE Technical Paper 2015-01-0875, doi: 10.4271/2015-01-0875. 25.Jung, D. and Iida, N., An Investigation into
Cycle-to-Cycle Variations of IMEP using External EGR and Rebreathed EGR in an HCCI Engine, Based on Experimental and Single-Zone Modeling, JSAE/SAE 2015 International Powertrains, Fuels & Lubricants Meeting, Kyoto (Japan), Sep. 2015, SAE Technical Paper 2015-01-1805, doi: 10.4271/2015-01-1805. 26.Shayestehmanesh, S., Peyton Jones, J., and Frey, J.,
Stochastic Characteristics of Knock and IMEP, SAE
2018 World Congress Experience (WCX), Detroit (MI, USA), Apr. 2018, SAE Technical Paper 2018-01-1155, doi: 10.4271/2018-01-1155.
27.Takeuchi, M., Tsukada, K., Nonomura, Y., Omura, Y. and Chujou, Y., A Combustion Pressure Sensor Utilizing Silicon Piezoresistive Effect, SAE 1993 International Congress & Exposition, Detroit (MI, USA), Mar. 1993, SAE Technical Paper 930351, doi: 10.4271/930351.
28.Sugitani, N., Ueda, M., Kosugi, M. and Tsukada, K., Combustion Pressure Sensor for Toyota Lean Burn Engine Control, SAE 1993 International Congress & Exposition, Detroit (MI, USA), Mar. 1993, SAE Technical Paper 930882, doi: 10.4271/ 930882.
29.Herden, W. and Küsell, M., A New Combustion Pressure Sensor for Advanced Engine Management,
SAE 1994 International Congress & Exposition, Detroit (MI, USA), Mar. 1994, SAE Technical Paper 940379, doi: 10.4271/940379.
30.Maass, B., Deng, J., and Stobart, R., In-Cylinder Pressure Modelling with Artificial Neural Networks, SAE 2011 World Congress & Exhibition, Detroit (MI, USA), Apr. 2011, SAE Technical Paper 2011-01-1417, doi: 10.4271/2011-01-1417. 31.Yu, S., Song, H., Min, K., Choi, H., Cho, S., and
Han, K., Development of Engine Control Using the In-Cylinder Pressure Signal in a High Speed Direct Injection Diesel Engine, SAE 2011 World Congress & Exhibition, Detroit (MI, USA), Apr. 2011, SAE Technical Paper 2011-01-1418, doi: 10.4271/2011-01-1418.
32.Huang, Y., Yang, F., Ouyang, M., Chen, L., and Yang, X., Optimal Feedback Control with In-Cylinder Pressure Sensor under Engine Start Conditions, SAE 2011 World Congress & Exhibition, Detroit (MI, USA), Apr. 2011, SAE Technical Paper 2011-01-1422, doi: 10.4271/2011-01-1422.
33.Yu, S., Han, K., Nam, K., Choi, D., and Yu, J., Development of Real-Time Engine Control Using the In-Cylinder Pressure Signal in a Diesel Engine for Passenger Vehicle, SAE/KSAE 2013 International Powertrains, Fuels & Lubricants Meeting, Seoul (South Korea), Oct. 2013, SAE Technical Paper 2013-01-2513, doi: 10.4271/2013-01-2513.
34.Min, K., Chung, J., Kang, E., and Sunwoo, M., Individual Cylinder IMEP Estimation Using a Single Cylinder Pressure Sensor for Light-Duty Diesel Engines, SAE 2014 World Congress & Exhibition, Detroit (MI, USA), Apr. 2014, SAE Technical Paper 2014-01-1347, doi: 10.4271/2014-01-1347.
35.Kulah, S., Donkers, T., and Willems, F., Virtual Cylinder Pressure Sensor for Transient Operation in Heavy-Duty Engines, SAE International Journal of
Engines, 8(3), 2015, pp. 1029–1040, doi:
Ichiyanagi, M. et al. / Experimental Study of Combustion Fluctuation Reduction / JIRAE, Vol. 3, No. 3, October 2018, pp. 51–60
60 36.Ura, Y. and Oya, K., Pressure Sensor Module for
High Temperature, High Pressure, and Quick Response, SAE 2018 World Congress Experience (WCX), Detroit (MI, USA), Apr. 2018, SAE Technical Paper 2018-01-0759, doi: 10.4271/2018-01-0759.
37.Gomi, T., Thermal Effect upon Air Capacity of the Four-Stroke Engine (1st Report, Thermodynamical Analysis Method), Transactions of the Japan Society of Mechanical Engineers Series B, 12(53), 1969, pp. 1163–1179, doi: 10.1299/jsme1958.12. 1163.
38.Gomi, T., Thermal Effect upon Air Capacity of the Four-Stroke Engine (2nd Report, Results of Experimental Analysis), Transactions of the Japan Society of Mechanical Engineers Series B, 12(53),
1969, pp. 1180–1203, doi: 10.1299/jsme1958.12. 1180.
39.Yazdani, A., Naber, J., Shahbakhti, M., Dice, P., Glugla, C., Cooper, S., McEwan, D. and Huberts, G. Air Charge and Residual Gas Fraction Estimation for a Spark-Ignition Engine Using In-Cylinder Pressure, SAE 2017 World Congress Experience (WCX), Detroit (MI, USA), Apr. 2017, SAE Technical Paper 2017-01-0527, doi: 10.4271/2017-01-0527.