Waste Technology (WasTech)
Journal homepage:
https://ejournal.undip.ac.id/index.php/wastech
An International Journal
THE EFFECT OF SOLID-STATE ANAEROBIC DISGESTION (SS-AD) AND LIQUID
ANAEROBIC DISGESTION (L-AD) METHOD IN BIOGAS PRODUCTION OF RICE HUSK
Agus Hadiyarto, Fadillah Fathir Mahmud Fofana, Ihwan Fauzi, Siswo Sumardiono, and Budiyono Department of Chemical Engineering, University of Diponegoro,
Postal Code 50275, Semarang, Indonesia [email protected]
Abstract - Rice husk is one of the agricultural waste from rice crop residue which has high potential to be processed into biogas. The purpose of this research is to study the effect of solid state anaerobic digestion and liquid anaerobic digestion on biogas production from rice husk waste. The anaerobic digestion laboratory scale used in this experiment is operated in a batch system and at room temperature. This method is added with chemical and biological pretreatment that was NaOH and microbial consortium. Total solid (TS) wa s varied from 5%, 7%, 9%, 11% which is L-AD and 17%, 19%, 21%, 23% are SS-AD. Biogas results were measured using the water displacement method every two days to determine daily production. The results showed that with the addition of NaOH the total volume of biogas obtained by L-AD method (TS 9%) and SS-AD (TS 23%) were 1254 ml and 1397 ml. Production of biogas per unit of TS for L-AD method is 46,44 ml / grTS and for SS-AD is 20,246 ml / grts, while biogas production per reactor volume unit for L-AD method is 6,26 ml / ml reactor and for SS-AD method is 4.64 ml / ml reactor. The kinetics constant of biogas production with L-AD method obtained A, U, and λ respectively were 50,53 ml / grTS, 1.23ml / grTS.day, 11,71 day, while for SS-AD method obtained A, U , and λ respectively 21.07 ml / grTS, 0.6 ml / grTS.day, 6.2 days.
Keyword: biogas, pretreatment, SS-AD, L-AD, rice husk
Key words -bioethanol waste; biogas; initial pH; urea addition; pH control
Doi: http://dx.doi.org/10.12777/wastech.5.1.2017.1-15
Citation: Agus Hadiyarto, Fadillah Fathir Mahmud Fofana, Ihwan Fauzi, Siswo Sumardiono, and Budiyono.2017. THE EFFECT OF SOLID-STATE ANAEROBIC DISGESTION (SS-AD) AND LIQUID ANAEROBIC DISGESTION (L-AD) METHOD IN BIOGAS PRODUCTION OF RICE HUSK. Waste Technology 1(1):1-5. Doi: http://dx.doi.org/10.12777/wastech.5.2.2017.1-15
1. Introduction
Indonesia is an archipelagic country rich in natural resources such as sea water resources, land resources, forest resources, petroleum resources, natural gas resources and so on. The management of natural resources has been done in various ways and the results of Indonesia is still not optimal in its development (Kusdiana, 2008). One of them is the management and development of petroleum (Kharisma, 2011). This is certainly a concern, because Indonesia is still large in reliance on the use of fossil fuels. Seen in the daily activities of Indonesian people who can not be separated from the use of fuel, such as cooking, transportation, lighting, and others (Hambali, et al., 2007). The condition of petroleum reserves in Indonesia is only about 3.6 billion barrels. The energy consumption will continue to increase and will slow down in 2020, if applied to stricter environmental standards. Primary energy needs only grew by 11% according to the Minister of Energy and Mineral Resources. Energy demand for the industrial sector by 2025 is an increase of about 55 percent of its total
million mmbtu of natural gas and 53.71 million tons of coal (Priyanto, 2014).
becomes the main contributor of energy that is about 10% of total energy (Antizar and Turrion, 2008). Biomass can be converted into various forms of energy that can be used one of them biogas. The development of biomass technology based on biomass has increased rapidly, so it is necessary to study the development of biomass production into biogas at affordable cost and can be widely commercialized (Junfeng and Runqing, 2003).
Biogas is the final product gas of organic materials fermented by microorganisms under anaerobic conditions (Budiyono dkk., 2013). Many developed and developing countries have developed biogas technology, even the first anaerobic biogas generator was built in 1900 (Fang et al., 2011). Biogas can be used as fuel for vehicles as well as for power and heat generation (Carvalho, 2010). According to the Ministry of Energy and Mineral Resources if the potential is maximized, Indonesia will be able to save about 700 thousand tons of LPG or equivalent to 900 million liters of kerosene.
The biogas composition comprises a mixture of methane (CH4) between 55-70%, carbon dioxide (CO2) between 25-50%, water (H2O) between 1-5%, H2S between 0-5%, nitrogen (N2) between 0-5 %, and ammonia (NH3) between 0-0.05% (Deublein dan Steinhauser, 2008). The main component of biogas is methane gas because it has a high calorific value. The biogas production fermentation process exists comprising four stages: (i) hydrolysis of the polymer substrate into (i) monomer; (ii) acidogenesis to convert monomers into volatile fatty acids, carbon dioxide and hydrogen; (iii) acetogenesis to produce acetate from intermediate metabolisis; and (iv) methanogenesis to convert acetate and carbon dioxide into methane (Deublein dan Steinhauser, 2008; Bruni, 2010; Li et al., 2011 ; Tuesorn et al., 2013). While in the two-stage process for hydrolysis and methane gas formation is done separately. Which, the difference of biogas production process has an effect on the amount of biogas produced later (Zhang, 2010). Wastewater research to produce biogas has been done extensively with liquid waste (Sunarso, et.al, 2010, Annuputtikul and Rodtong, 2004), agricultural waste (Maghanaki, et al., 2013, Widodo, et. al., 2007), municipal waste (Maghanaki, et.al., 2013), etc.
Indonesia is an agricultural country with abundant rice production where each processing of 1 ton of rice produces 240 kg of husk (Hosseinnia et al., 2007). As a result, rice husk is one of the major environmental disturbances due to being a pile of solid waste where they are thrown away. Nevertheless, rice husk can be used as a source of heat energy in various human needs, high enough cellulose levels can provide a uniform and stable combustion (Chen et al., 2009). According to Li et al. (2010), rice husk can be utilized to waste for energy resources that is biogas.
Lignocellulosic plant fibers are contained in biomass from agricultural and agro-industrial wastes. Lignocellulose consists of heterogeneous hemicellulose, highly crystalline cellulose, and
lignin-based complex aromatic polymers that protect the polysaccharide microstructure. Lignocellulosic hydrolysis has been identified as a step to increase biogas production from lignocellulosic fiber-rich wastewater. Lignocellulosic hydrolysis can be achieved by physical, chemical pretreatment (Monlau et al., 2012), thermochemistry (Teghammar et al., 2010), biology (Zhang et al., 2011), or a combination of raw material pretreatment (Michalska et al. 2012) which results in lignocellulosic degradation and thereby improves overall methane yield.
2. MATERIAL DAN METHODS
Material :
The materials used are rice husk, cow rumen, microbial consortium (Decoprima), urea, NaOH, HCl, and water.
Methods:
The research method used to achieve the purpose of this study by conducting laboratory experiments conducted in the Laboratory of Chemical Waste Processing Engineering, Faculty of Engineering Diponegoro University. processing is done using anaerobic digestion method at mesophilic state, ie at waste is taken from the rice husks from the village palm oil plantation located in Pandeglang Regency, and the cow rumen coming from Penggaron Pengbin House of Semarang and the purchase of microbial consortium and NaOH as pretreatment for lignocellulosic degradation of rice husk. Preparing urea as micronutrient.
2. Pretreatment Stage
Pretreatment melalui 2tahap, yaitu: a. Chemistry Pretreatment
Rice husk is soaked with NaOH as much as 3% gr / gr TS then silenced for 24 hours.
b. Biology Pretreatment
Rice husk that has been through chemical pretreatment for 24 hours then pH adjusted before added microbial consortium, setting pH using HCl. After neutral pH add microbial consortium 5% g / v.
3. Operation Stage
4. Result Analysis Stage
Biogas volume data was analyzed in graph of the relation of biogas volume to time. Graphical analysis
and phenomena theory based on the effect of variables on the results obtained in the graph of results.
Table 1. Variation of mixed composition of each digester
Tank
% TS NaOH
3% (g/gTS)
Without NaOH
Microbial Consortium
5% g/v
Without Microbial Consortium 5 7 9 11 17 19 21 23
1 √ √ √
2 √ √ √
3 √ √ √
4 √ √ √
5 √ √ √
6 √ √ √
7 √ √ √
8 √ √ √
9 √ √ √
10 √ √ √
11 √ √ √
12 √ √ √
13 √ √ √
14 √ √ √
15 √ √ √
16 √ √ √
K 1 √ √ √
K 2 √ √ √
3. RESULTS
Effect of% TS on raw material of rice husk waste on Biogas Production by L-AD Method
In this study, the effect of the% TS ratio on biogas production was observed with the 5%, 7%, 9% and 11%
Solid (TS) variations. Biogas volume data are presented as daily and cumulative biogas volumes for 60 days of L-AD trials, as shown in Figures 1 through 3
0 20 40 60 80 100 120
0 10 20 30 40 50 60 70
B
io
g
a
s
D
a
il
y
V
o
lu
m
e
(
m
l)
Time (Day)
T1 1=Dengan NaOH; TS 5% T2 1=Dengan NaOH; TS 7%
Figure 1.Effect of% TS on Biogas Production by Addition NaOH Method of L-AD on Daily Biogas Volume (ml) vs. Time
Figure 2.Effect of% TS on Biogas Production by Addition NaOH Method of L-AD on Cumulative Biogas Volume (ml) vs. Time
Figure 3. Effect of% TS on Biogas Production by Addition NaOH Method of L-AD on Cumulative Biogas Volume / TS (ml/grTS) vs Waktu
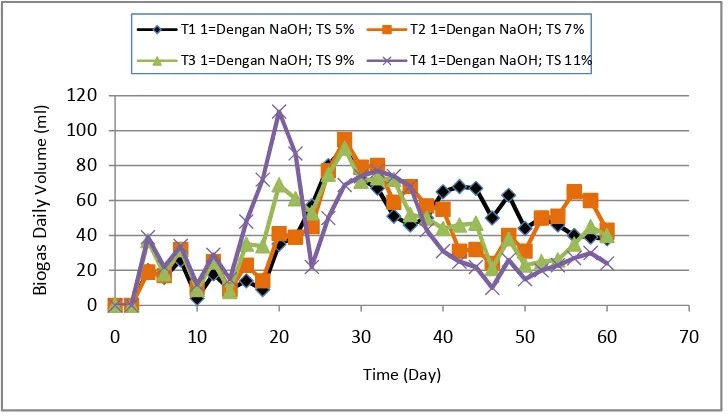
Figure 1 shows the daily biogas volume in rice husk with the addition of NaOH for the chaff variation with TS 5%, 7%, 9% and 11%. In rice husks TS 5% biodegradable fluctuating production tends to increase until the 28th day. On the 30th day the fluctuating biogas production tends to decrease until the 60th day. In rice husk TS 7% biogas production increased high starting on the 28th day. However, starting on the 30th day of biogas production fluctuates but tends to decline until day-to-60. In rice husk TS 9% biogas production increased voluntarily until the 28th day. On the 30th day biogas production fluctuates but tends to decline until day-to-60. In rice husk TS 11% biogas production increased until the 20th day, then biogas production again fluctuate but tends to decline until day-to-60. The highest daily biogas production in TS 11% rice husk
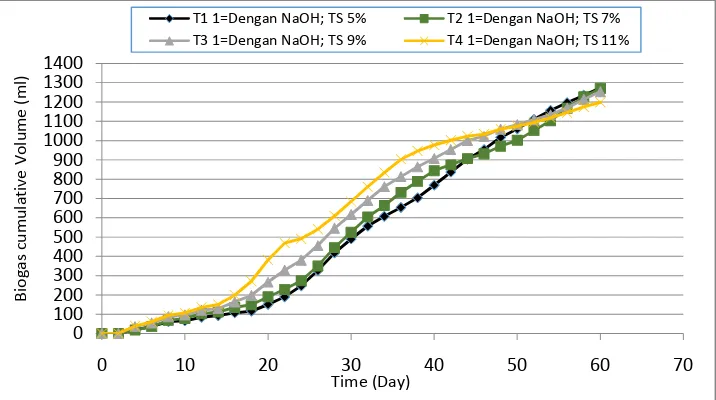
was 111 ml on the 20th day.Pada gambar 2 dapat dilihat perbandingan jumlah produksi biogas dari sekam padi dengan penambahan enzym dan NaOH dengan perbedaan %TS. Produksi biogas pada sekam padi dengan TS 5% memiliki hasil yang paling tinggi. Total volume biogas pada 5%, 7%, 9% dan 11% berturut-turut untuk sekam padi tersebut adalah 1274 ml, 1271 ml, 1254 ml dan 1199 ml.
Figure 3 shows the cumulative biogas volume of each TS unit in rice husk with the addition of NaOH. In TS 5% rice husk, the total yield of biogas is 84.93 ml / grts. In rice husks TS 7% yield cumulative biogas of 60.52 ml / grTS. In rice husk TS 9% yield cumulative biogas of 46.44ml / grTS, and on rice husk TS 11% yield cumulative biogas up to 60th day, that is equal to 36.33 ml / grTS
T1 1=Dengan NaOH; TS 5% T2 1=Dengan NaOH; TS 7% T3 1=Dengan NaOH; TS 9% T4 1=Dengan NaOH; TS 11%
0
T1 1=Dengan NaOH; TS 5% T2 1=Dengan NaOH; TS 7%
The conclusion of the above observations is that the total solid variation in the L-AD method has an effect on the biogas production. The highest biogas yield of 84.93 ml / grts was obtained at 5% TS with the addition of NaOH. The following is in accordance with previous research by (Ni'mah, 2014) entitled "BIOGAS FROM SOLID WASTE OF TOFU PRODUCTION AND COW MANURE MIXTURE: COMPOSITION EFFECT" that a watery slurry will produce higher and faster methane levels when compared to slurry is more viscous.
Effect of% TS on raw material of rice husk waste on Biogas Production by SS-AD Method
In this study, the effect of% TS on biogas production was observed with 17%, 19%, 21% and 23% of Total Solid (TS) variations. Biogas volume data are presented as daily and cumulative biogas volumes for 60 days of SS-AD experiments, as shown in Figures 4 through 6.
Figure 4.Effect of% TS on Biogas Production by Addition NaOH Method of SS-AD on Daily Biogas Volume (ml) vs. Time
Figure5.Effect of % TS on Biogas Production by Addition NaOH Method of SS-AD on Cumulative Biogas Volume (ml) vs. Time
0 20 40 60 80 100 120
0 10 20 30 40 50 60 70
B
io
g
as
D
ai
ly
V
o
lu
m
e
(
m
l)
Time(Day)
T5 1=Dengan NaOH; TS 17% T6 1=Dengan NaOH; TS 19%
T7 1=Dengan NaOH; TS 21% T8 1=Dengan NaOH; TS 23%
0 100 200 300 400 500 600 700 800 900 1000 1100 1200 1300 1400 1500
0 10 20 30 40 50 60 70
B
io
g
as
C
u
m
u
lati
v
e
V
o
lu
m
e
(
m
l)
Time (Day)
T5 1=Dengan NaOH; TS 17% T6 1=Dengan NaOH; TS 19%
Gambar 6.Effect of% TS on Biogas Production by Addition NaOH Method of SS-AD on Cumulative Biogas Volume / TS (ml/grTS) vs Waktu
Figure 4 shows the daily biogas volume in rice husk with the addition of NaOH for chaff variation with TS 17%, 19%, 21% and 23%. In rice husk TS 17% biogas production fluctuate tends to increase until day 32. On the 34th day of fluctuating biogas production tends to decrease until day 60. In rice husk TS 19% biogas production increased high starting on the 22nd day. However, the 24th day of biogas production fluctuates but tends to decline until the 60th day. In rice husk TS 21% biogas production increased volatile until the 20th day. On the 22nd day biogas production fluctuates but tends to decline until day-to-60. In rice husk TS 23% biogas production increased until the 20th day, then biogas production again fluctuate but tends to decline until day-to-60. The highest daily biogas production on TS 23% rice husk was 113 ml on the 20th day.
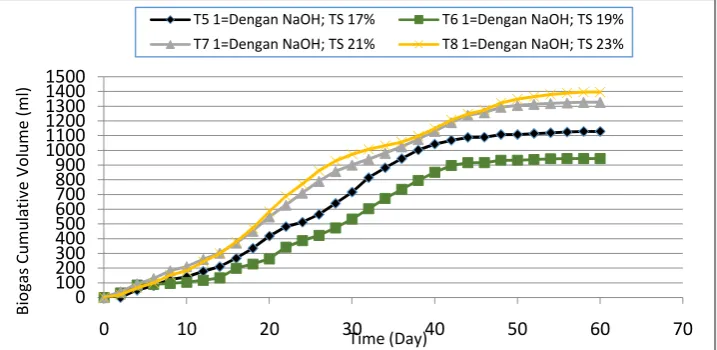
Figure 5 shows the ratio of the amount of biogas production from rice husks with the addition of enzymes and the addition of NaOH with a difference of% TS. Biogas production in rice husk with TS 23% has the highest yield. The total volume of biogas at 17%, 19%, 21% and 23% respectively for the rice husks were 1129 ml, 945 ml, 1327 ml and 1397 ml.
Figure 6 shows the cumulative biogas volume of each TS unit in rice husk with the addition of NaOH. In rice husk TS 17%, the total yield of biogas is 22.14 ml /
grts. In rice husk TS 19% yield cumulative biogas of 16.58 ml / grTS. In rice husk TS 21% yield of cumulative biogas of 21.06 ml / grTS, and on rice husk TS 23% yield cumulative biogas up to 60th day, that is equal to 20,246 ml / grTS.
The conclusion of the above observation is that the total solid variation in the SS-AD method has an effect on the biogas production. The highest biogas yield of 22.14 ml / grts was obtained at 17% TS with the addition of NaOH. This happens because the TS content is too high cause the production of organic acids in the early stages of digestion faster than the speed of organic acid consumption by methanogen bacteria. This causes the activity of methanogen bacteria inhibited and reduce biogas production (Jha et al.,2013)
Comparison of Biogas Production by SS-AD and L-AD method from rice husk waste
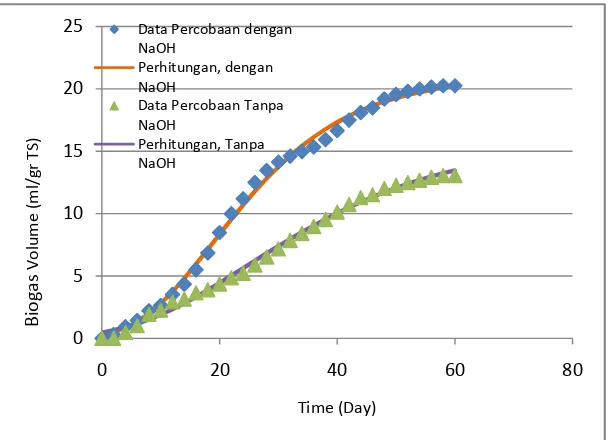
In this study, the comparison of L-AD and SS-AD method to biogas production was observed with 9% Solid (TS) variation for L-AD and 23% for SS-AD where each variable was done addition NaOH and without addition NaOH. Biogas volume data are presented as daily and cumulative biogas volumes for 60 days of L-AD and SS-AD trials, as shown in figures 7 to 14.
0 5 10 15 20 25
0 10 20 30 40 50 60 70
B
io
g
a
s
C
u
m
u
la
ti
v
e
V
o
lu
m
e
(
(m
l/
g
rT
S
))
Time (Day)
T5 1=Dengan NaOH; TS 17% T6 1=Dengan NaOH; TS 19%
Figure 7. Daily Biogas Volume Comparison between TS 9% (L-AD) and TS 23% (SS-AD) with Addition of NaOH
Figure 8.Cumulative Biogas Volume Comparison between TS 9% (L-AD) and TS 23% (SS-AD) with Addition of
NaOH
Figure 9.Cumulative Biogas Volume / TS (ml/grTS) Comparison between TS 9% (L-AD) and TS 23% (SS-AD)
with Addition of NaOH
TS 9% dengan NaOH TS 23% dengan NaOH
0
TS 9% dengan NaOH TS 23% dengan NaOH
0
Figure 10.Cumulative Biogas Volume / Reactor Volume (ml/grReactor) Comparison between TS 9% (L-AD) and
TS 23% (SS-AD) with Addition of NaOH
Figure 7 shows the daily biogas volume in rice husk with the addition of NaOH for chaff variation with TS 9% and 23%. In rice husks TS 9% biodegradable fluctuating production tends to increase until the 28th day. On the 30th day the fluctuating biogas production tends to decrease until the 60th day. In rice husk TS 23% biogas production increased high starting on the 20th day. However, starting from the 22nd day of biogas production fluctuates but tends to decline until day-to-60. The highest daily biogas production on TS 23% rice husk was 113 ml on the 20th day.
In Figure 8 we can see the ratio of the amount of biogas production from the rice husk with the addition of enzyme and the addition of NaOH with the difference of% TS. Biogas production in rice husk with
TS 23% has higher yield. The total volume of biogas at 9% and 23% respectively for rice husk was 1254 ml and 1397 ml.
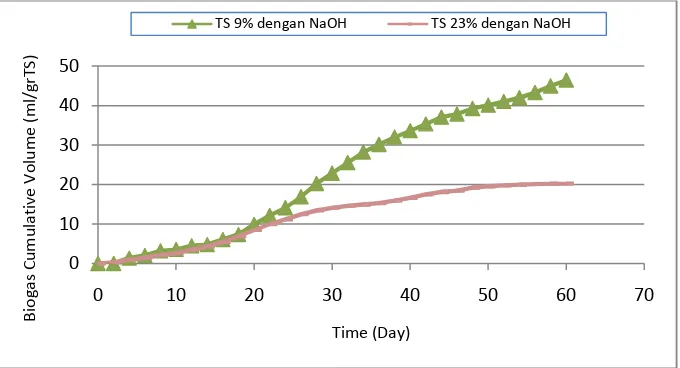
Figure 9 shows the cumulative biogas volume of each TS unit in rice husk with the addition of NaOH. In TS 9% rice husk, the total yield of biogas is 46.44 ml / grts and in rice husk TS 23% cumulative yield of biogas up to 60th day, ie 20.2246 ml / grTS.
Figure 10 shows the cumulative biogas volume of each reactor volume unit in rice husk with the addition of NaOH. In TS 9% rice husk, the total yield of biogas is 4.64 ml / ml Reactor and on rice husk TS 23% cumulative yield of biogas up to 60th day, ie 6.26 ml / ml Reactor..
Figure 11.Daily Biogas Volume Comparison between TS 9% (L-AD) and TS 23% (SS-AD) Without Addition of
NaOH
TS 9% dengan NaOH TS 23% dengan NaOH
0
Figure 12.Cumulative Biogas Volume Comparison between TS 9% (L-AD) and TS 23% (SS-AD) Without
Addition of NaOH
Figure 13. Cumulative Biogas Volume / TS (ml/grTS) Comparison between TS 9% (L-AD) and TS 23% (SS-AD) without Addition of NaOH
Figure 14. Cumulative Biogas Volume / Reactor Volume (ml/grReactor) Comparison between TS 9% (L-AD) and TS 23% (SS-AD) without Addition of NaOH
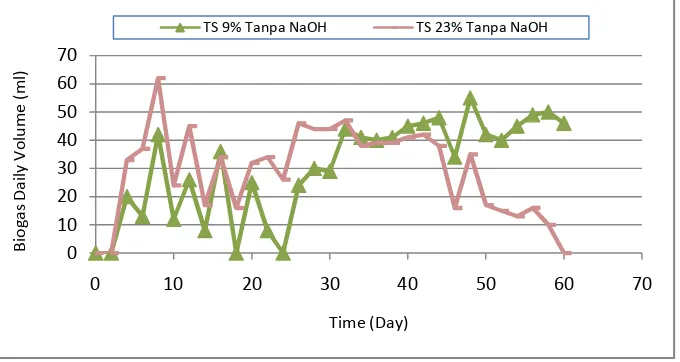
Figure 11 shows the daily biogas volume in rice husk without the addition of NaOH for chaff variation with TS 9% and 23%. In rice husk TS 9% biogas production fluctuate tends to increase until day 48. On the 50th day the fluctuating biogas production tends to decrease until the 60th day. In rice husk TS 23% biogas
production increased high starting day 8. However, starting on the 10th day of fluctuating biogas production tends to decline until day-to-60. The highest daily
TS 9% Tanpa NaOH TS 23% Tanpa NaOH
0
TS 9% Tanpa NaOH TS 23% Tanpa NaOH
0
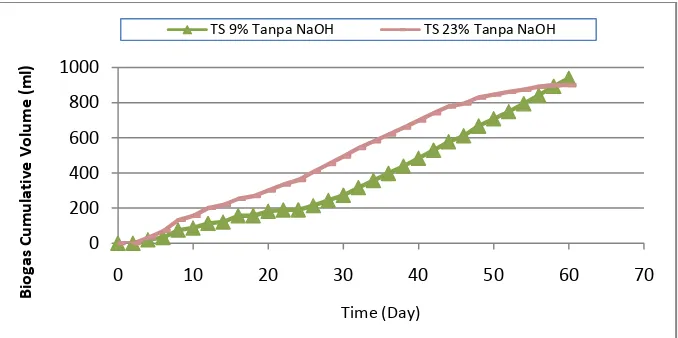
In Figure 12 we can see the ratio of the amount of biogas production from the rice husk with the addition of enzyme and without the addition of NaOH with a difference of% TS. Biogas production in rice husk with TS 9% has higher yield. The total volume of biogas at 9% and 23% respectively for the rice husk was 939 ml and 900 ml.
Figure 13 shows the cumulative biogas yield of each TS unit on rice husk with the addition of NaOH. In rice husk TS 9%, the total yield of biogas is 34,78 ml / grTS and on rice husk TS 23% yield of cumulative biogas up to day-60, that is equal to 13,043 ml / grTS.
Figure 14 shows the cumulative biogas volume of each reactor volume unit in rice husk without the addition of NaOH. In TS 9% rice husk, the total yield of biogas is 3.478 ml / ml Reactor and on rice husk TS 23% cumulative yield of biogas up to 60th day, that is 4.033 ml / ml Reactor.
It can be concluded from the above observation that the highest biogas yield produced by L-AD method is 46.44 ml / grts obtained at TS 9% with the addition of NaOH. This is because, according to Brown and Li (2012), the higher TS content has a minimal effect on TS efficiency and decrease in biogas production so in this study the L-AD situation is more advantageous
because the cumulative biogas yield per TS will be higher if the amount little solids. If the TS content of TS 9% and TS content of 23% is higher then the higher biogas yield on TS content of 9%, because the TS content is too high can cause inhibition at the hydrolysis stage caused by limited mass transfer between microbes and raw materials. The product of the hydrolysis stage has accumulated on the surface of the substrate due to limited mass transfer, ultimately inhibiting the absorption of hydrolytic enzymes. Limited mass transfer makes the amount of hydrolysis product available for acidogenic microbes limited so as to decrease the amount of product produced at the acidogenesis stage to be converted to biogas at the methanogenesis stage (Sheets et al., 2015).
Kinetics of Biogas Production Reaction
Research at this stage one of them aims to study the kinetics constant of biogas production. The kinetics constant of biogas production rate (U), maximum
biogas production (A), and minimum time of biogas (λ)
are determined by using non linear regression technique. The data obtained from the results of the study was resolved numerically using a non linear regression technique using the Polymath 6.0 Program. Table2Kinetic Constants on Research Effect of NaOH Addition on Biogas Production Method L-AD
Constants NaOH WithoutNaOH
A, ml/(grTS) 50,53 103,5
U, ml/(grTS.hari) 1,23 0,92
λ, hari 11,71 22,07
Table3. Kinetic Constants on Research Effect of %TS on Biogas Production Method L-AD
Constants
TS (%)
5 7 9 11
A, ml/(grTS) 108,23 70,07 50,5 37,6
U, ml/(grTS.hari) 2,2 1,5 1,23 1,07
λ, hari 16,01 13,09 11,7 9,7
Figure 15. Relation between Experimental Data and Calculation Result on Research of NaOH Effect on Biogas Production 0
10 20 30 40 50
0 20 40 60 80
B
io
g
a
s
V
o
lu
m
e
(
m
l/
g
rT
S
)
Figure16.Relation between Experimental Data and Calculation Result on TS% Effect on Biogas Production of L-AD Method
Table 2 and Figure 16 show that the NaOH used for the preliminary treatment has a significant effect on the biogas production kinetics constants. Mathematically, rice husk with preliminary treatment with NaOH addition, gives biogas production kinetics constant that is maximum biogas production (A), biogas production rate constant (U), and
minimum time of biogas (λ) formation of 50,53 ml /
(grTS); 1.23 ml / (grTS.day); and 11.71 days. Unprepared
rice husks using NaOH give kinetic constant A, U and λ
respectively 103.5 ml / (grTS); 0.92 ml / (gTS.day); and 22.07 days. This kinetics constant, biogas production rate can be expressed by the constant rate of biogas production (U) with unit ml / (grTS.hari).
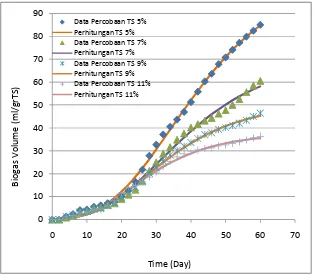
Table 3 and Figure 17 show that% TS gives a real effect on the biogas production kinetics constants. Mathematically, TS 5% gives the highest biogas production rate expressed as the constant ie maximum biogas production (A), biogas production rate constant (U) and
minimum time of biogas (λ) forming 108,23 ml / (grTS) ;
2.2 ml / (grTS.day); and 16.01 days. Overall, the maximum biogas production averages (A), kinetics constants of biogas production rate (U) and minimum time of biogas (λ) formation were 66.6 ml / (grTS), 1.5 ml / (grTS.hari ), and 12.625 days.
Table 4. Kinetic Constants on Research Effect of NaOH Addition on Biogas Production MethodSS-AD
Constants NaOH Without NaOH
A, ml/(grTS) 21,07 15,86
U, ml/(grTS.hari) 0,6 0,3
λ, hari 6,2 5,3
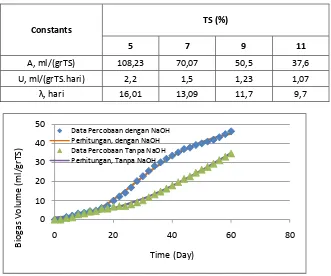
Table5.Kinetic Constants on Research Effect of %TS on Biogas Production Method L-AD
Constants
TS (%)
17 19 21 23
A, ml/(grTS) 24,04 18,72 22,83 21,07
U, ml/(grTS.hari) 0,71 0,51 0,596 0,6 0
10 20 30 40 50 60 70 80 90
0 10 20 30 40 50 60 70
B
io
g
a
s
V
o
lu
m
e
(
m
l/
g
rT
S
)
Time (Day) Data Percobaan TS 5%
Figure17.Relation between Experimental Data and Calculation Result on Research of NaOH Effect on Biogas Production
of SS-AD Method
Figure18.Relation between Experimental Data and Calculation Result on TS% Effect on Biogas Production of SS-AD
Method Table 4 and Figure 17 show that the NaOH used for the preliminary treatment has a significant effect on the biogas production kinetics constants. Mathematically, rice husk with pretreatment with NaOH addition, gives biogas kinetics production constant that is maximum biogas production (A), biogas production rate constant (U), and
minimum time of biogas (λ) is 21.07 ml / (grTS); 0.6 ml /
(grTS.day); and 6.02 days. Unprepared rice husk using
NaOH gives kinetic constant of A, U and λ respectively
15,86 ml / (grTS); 0.3 ml / (gTS.day); and 5.3 days. This kinetics constant, biogas production rate can be expressed by the constant rate of biogas production (U) with unit ml / (grTS.hari).
Table 5 and Figure 18 show that% TS gives a real effect on biogas production kinetics constants. Mathematically, TS 17% gives the highest biogas 0
5 10 15 20 25
0 10 20 30 40 50 60 70
B
io
g
a
s
V
o
lu
m
e
(
m
l/
g
r
T
S
)
Time (Day)
Data Percobaan TS 17%
Perhitungan TS 17%
Data Percobaan TS 19%
Perhitungan TS 19%
Data Percobaan TS 21%
Perhitungan TS 21%
Data Percobaan TS 23%
Perhitungan TS 23% 0
5 10 15 20 25
0 20 40 60 80
B
io
g
a
s
V
o
lu
m
e
(
m
l/
g
r
T
S
)
Time (Day) Data Percobaan dengan
NaOH
Perhitungan, dengan NaOH
Data Percobaan Tanpa NaOH
production rate expressed as the constant ie maximum biogas production (A), biogas production rate constant (U)
and minimum time of biogas (λ) 24.04 ml / (grTS) ; 0.71
ml / (grTS.day); and 8.57 days. Overall, the maximum biogas production averages (A), kinetics constant of biogas
production rate (U) and minimum time of biogas (λ) were
21.665 ml / (grTS), 0.604 ml / (grTS.hari), and 7 , 56 days. From the above experiments, it is known that the modified biogas production kinetics with the Gompertz equation gives the data predicted by the model quite close to the experimental data. It also proves that with chemical pretreatment (addition of NaOH), and biology (addition of microbial consortium) maximum biogas production (A) and biogas production potential (U) of all lignocellulosic biomass improves. The values of A, U, and λ differ in each experiment, as this is based on the feed / material having its own character, and the variables used are also different. The modified Gompertz equation also describes cumulative gas production as a function of residence time (Ghatak and Mahanta, 2014). The value of λ has an effect on the first initial time when the biogas is formed or improves (Budiyono et al., 2013).
4. Conclusion
This research shows that rice husk combined with cow dung can be used as raw material for biogas production. The most optimum biogas production was found in rice husk with addition of NaOH and microbial consortium using L-AD method with total yield of biogas of 46.44 ml / grTS. This is because the higher TS content has a minimal effect on TS efficiency and a decrease in biogas production and because of too high TS content can lead to inhibition at the hydrolysis stage caused by limited mass transfer between microbes and raw materials.
5. REFERENCE
Al Hasibi, R.A. 2010. Peran Sumber Energi Terbarukan dalam Penyediaan Energi Listrik dan Penurunan Emisi CO2 di Provinsi Daerah Istimewa Yogyakarta. Jurnal Ilmiah Semesta Teknika, Vol. 13, No. 2, 155-164.
Antizar, L.B. and Turrion, G.J.L. 2008. Second-generation Biofuels and Local Bioenergy Systems. Biofuels Bioproducts dan Biorefining, Vol. 2(5): 455-69
Brown, D., Li, Y. 2013. Solid state anaerobic co-digestion of yard waste and food waste for biogas production. Bioresource Technology, 127,275-280.
Bruni, E., Jensen, A.P., Angelidaki, I., (2010). Comparative study of mechanical,hydrothermal, chemical and enzymatic treatments of digested biofibers to improve biogas production. J Bioresour Technol Vol. 101:8713-7.
Budiyono, Syaichurrozi, I., & Sumardiono, S. 2013. Biogas Production From Bioethanol Waste: The Effect Of Ph And Urea Addition To Biogas Produstion Rate. Waste Tech, 1-5.
Chen, X., Yan, W., Sheng, K., Sanati, M. 2014. Comparison of high-solids to liquid anaerobic
co-digestion of food waste and green waste. Bioresource Technology, 154, 215-221.
Deublein, D. and Steinhauser, A. 2008. Biogas from Waste and Renewable Resource. Wiley-VCH Verlag GmbH dan Co. KGaA ,Weinheim. Dhouib, A., Ellouz, M., Aloui, F., Sayadi, S. 2006
Fang, C., Boe, k., & Angelidaki, I. (2011). Anaerobic co digestion of desurgared molasses with cow manure; focusing on sodium and potassium inhibition. Bioresource Technology, 102, 1005-1011
Ghatak, M.D., Mahanta, P., (2014). Kinetic assessment of biogas production fromlignocellulosic biomasses. International Journal of Engineering and AdvancedTechnology (IJEAT) ISSN: 2249 – 8958, Volume-3, Issue-5.
Hosseinnia, A., Hashtroudi, M.S., Banifatemi, M., (2007). Surfactant removal. Water and Wastewater Asia pp. 52-5.
Jha, A.K., Li, J., Zhang, L., Ban, Q., Jin, Y. 2013. Comparison between wet and dry anaerobic digestions of cow dung under mesophilic and thermophilic conditions. Advances in Water Junfeng, L. and Runqing, H. 2003. Sustainable Biomass
Production For Energy In China. Biomass and Bioenergy Vol. 25(5):483-99.
Kharisma, Putra. 2011. Pengaruh Program Konversi Minyak Tanah Ke Gasterhadap Pedagang Kecil Di Kelurahan Padang Bulan Medan.Universitas Sumatera Utara Medan
Kusdiana, D. 2008. Kondisi Riil Kebutuhan Energi di Indonesia dan Sumber-Sumber Energi Alternatif Terbarukan, Indonesia.
Li, H., Saeed, A., Jahan, M.S., Ni, Y., van Heiningen, A. 2010. Hemicellulose Removal from Hardwood Chips in the Pre-Hydrolysis Step of the Kraft-Based Dissolving Pulp Production Process. Journal of Wood Chemistry and Technology, Volume 30, Issue 1, pages 48-60.
Li, Y., Park, S.Y., Zhu, J. 2011a. Solid-state anaerobic digestion for methane production from organic waste. Renewable and Sustainable Energy Reviews, 15(1), 821-826.
Michalska, K., Miazek, K., Krzystek, L., Ledakowicz S., (2012). Influence of pretreatment with Fenton’s reagent on biogas production and methane yield from lignocellulosic biomass. Bioresour Technol 2012;119:72-8.
Monlau, F., Barakat, A., Steyer, J.P., Carrere, H., (2012). Comparison of seven types of thermo-chemical pretreatments on the structural features and anaerobic digestion of sunflower stalks. Bioresour Technol Vol. 102:241-7.
Ni’mah, L., (2014). Biogas From Solid Waste Of Tofu Production And Cow Manure Mixture: Composition Effect. Chemica Vol 1 No.1 :1-9. Panpong, K., Srisuwan, G., O-Thong, S., & Kongjan, P.
Purba, Noir P. 2014. Variabilitas Angin dan Gelombang Laut sebagai Energi Terbarukan di Pantai Selatan Jawa Barat. Jurnal Akuatika Vol. V No. 1/ Maret 2014 (8-15) ISSN 0853-2532.
Putri, D.A., R.R. Saputro, Budiyono. 2012. Biogas Production from Cow Manure. International Journal of Renewable Energy Development (IJRED); 1(2) : 61-64, ISSN : 2252-4940.
Sheets, J.P., Ge, X, Li, Y. 2015. Effect of limited air exposure and comparative performance between thermopihilic and mesophilic solid-state anerobic digestion of switchgrass. Bioresource Technology, 180, 296-303.
Sunarso, & Sumardiono, S. (2012). Pengembangan teknologi biodigester anaerobik untuk mempercepat produksi biogas dari limbah tapioka dan limbah peternakan. Semarang: Universitas Diponegoro
Teghammar, A., Yngvesson, J., Lundin, M., Taherzadeh, M.J., Horvath, I.S., (2010).
Pretreatment of paper tube residuals for improved biogas production. Bioresour Technol Vol. 101:1206-12
Tuesorn, S. Wong, W.S. Champreda, V. (2013). Enhancement of biogas production from swine manure by a lignocellulolytic microbial consortium. Bioresource Technology, 144, pp.579–586.
Warsito, Suciyati, S.W., Wahyudi, D., Khoiron, W. 2011. Realisasi dan Analisis Sumber Energi Baru Terbarukan Nanohidro dari Aliran Air Berdebit Kecil. Jurnal Material dan Energi Indonesia Vol. 01, No. 01 (2011) 15-21.