Indo. J. Chem., 2006, 6 (2), 161 - 164
Saryati,et al.
161
* Corresponding author.
SQUARE WAVE CATHODIC STRIPPING VOLTAMMETRY ADSORPTIVE
FOR NICKEL AND COBALT ANALYSIS
Saryati
*, Rukihati and Sumardjo
Technology Center for Nuclear Industrial Material - National Nuclear Energy Agency (BATAN), Jakarta
Received 9 March 2006; Accepted 30 May 2006
ABSTRACT
The adsorptive stripping voltammetric determination of Ni and Co based on adsorption of the Ni/Co and dimethylglioxime (DMG) complex on a hanging mercury drop electrode is studied. The reduction current of the adsorbed DMG complex is measured by square wave cathodic stripping voltammetry method. The effect of various parameters such as ligand concentration, pH of supporting electrolytic, adsorption potential and adsorption time on the current peak of Ni and Co voltammogram were studied. Optimum condition of this method are supporting electrolyte pH 9, DMG concentration 5×10 -4 M, adsorption potential -0.7 V vs Ag/AgCl and adsorption time 180 second. A linier relationship between the current peak and Ni or Co concentration was obtained in the range 5 – 30 ng/mL and the detection limit 0.6 ng/ml for both Ni and Co. The recovery of Ni and Co were 98.11-104.17% using standard biological materials with RSD 2.59 – 10.37%. Based on “t” test can be conclude that the result are nearly equal to the standard reference material.
Keywords:adsorptive stripping voltammetric, dimethylglioxime complex, nickel, cobalt. INTRODUCTION
In a row with the awareness increase of life, environment and materials quality, the need of quality analysis method are rise. Industrial development caused heavy metal pollution. So that heavy metal analysis is one interesting study in life and environment science
Heavy metals are a great significance in ecochemistry and ecotoxicology because of their toxicity at low levels and tendency to accumulate in human organs. The major intake of toxic metals by humans is through food. Vegetable foods are relative more exposed to environmental pollution than cereals. Leafy vegetables are most exposed to environmental pollution because of their large surface area. In many countries vegetables are a major part of diet and its important to monitor their heavy metal content. Cobalt and nickel are very important heavy metal in biochemical and psycologycal process, but accumulate and deficiency cause healt interference [1]
There is many instrument and method that used in heavy metal analysis, voltammetry method is one of it. The advantage of voltammetry method is a major element not interference in the minor element determination, so that the sample preparation is faster, because it doesn’t need element separation. In other hand voltammetry method can be also used to determine ion in wide concentration range, from ng/ML(ppb) until µg/ML (ppm) level. For height concentration (≥ ppm) direct analysis by using differential pulse voltammetry (DPV) or square wave voltammetry (SWV) is possible . But for low concentration the DPV and SWV teknique can’t be used except it combining with accumulation step, that know as
stripping voltammetry, anodic stripping voltammetry, cathodic stripping voltammetry or adsorptive striping voltammetry.
In a media that can’t form complex compound Ni(II)/Ni(I) or Co(II)/Co(I) pairs electrode reaction are very irreversible, so its hard to determinate using anodic/cathodic stripping voltammetry, because of that Ni and Co determination was done by using adsorptive stripping voltammetry with complexing agent. The complexing agent increase the sensitivity method. Some researcher used dimethylglyoxime (DMG) as complexing agent [3-5]. Neiman [3] has studied Ni adsorptive stripping voltammetry in tetraethyl amine and ammonium chloride media with Ep Co –1,04 V/SCE. Voset al[4] has been determined Ni and Co in rain water in the ammonium buffer media with Ep Ni – 1.04 V/SCE and Ep Co –1.195 V/SCE. Thunus [5] has determined Ni and Co in blood with pH 9 ammonium buffer media. The several literature used DPV in cathodic current from Ni and Co –DMG complex reduction. The optimum condition of this method commonly determinate by experimentally with take a note of sensitivity, reproductivity and peak voltammogram form.
For reliable analysis by voltammetry, the analyte must be in the ionic state. In voltammtric analysis where usually associated with the incomplete destruction of organic matter during digestion. Wet digestion in the mixture nitric acidn perchloric acid and hydrogen peroxide that follow by heating, has proven successfully to determinate metal ion in biological sample [2-5].
Indo. J. Chem., 2006, 6 (2), 161 - 164
Saryati,et al.
162
square wave stripping voltammetric method by using DMG as complexing agent and application of this method to determine Ni and Co in Apple leave SRM 1515, Bovine liver SRM 1577B, Oyster Tissue SRM 1566b, Sargasso CRM no 9, Copepod RMMAA-1 and local vegetables
EXPERIMENTAL SECTION
Instrumentation and reagents
The voltammograms were recorded on a EG&G PAR model 384B polarographic analyzer. The working electrode was a EG&G PAR model 303 A static mercury drop electrode and hanging mercury drop electrode (HMDE) was employed. Ag/AgCl (saturated KCL) and platinum wire as reference and auxiliary electrode, respectively. A XY recorder for Houston instrument was used.
All reagent were of analytical-reagent grade, except a stock solution of 10000 µg/mL Ni and Co from MERCK was used. All solution were prepared from distilled water.
Procedure
Voltammetric stripping experiments were described indetail below. The supporting electrolyte (10 ml) containing 0.1 M ammonium tartaric buffer, 5.10-4M DMG transfered into the voltammetric cell and purged with nitrogen gas for 4 min. The pre-concentration potential at –0.7 V was applied to a fresh mercury drop while the solution was stirred. Stirring was stopped and then after 5 s voltammogram recorded by applying a negative scan (at 200 mV/s) from –0.7 to 1.3 V using the square wave mode. After the ground voltammogram has been obtained, the adsorptive stripping experiment was repeated with a new drop for the addition of sample. Nitrogen was than purge through the solution for about 1 min. Quantification was done by standard addition using three spikes for each element.
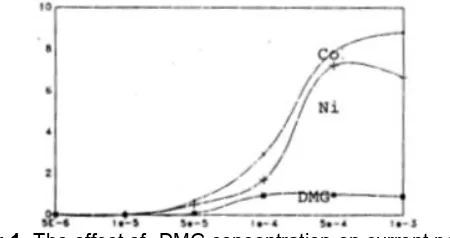
Fig 1.The effect of DMG concentration on current peak (Ip) Ni and Co. Ni concentration = Co concentration = 20 ng/ML. Deposition time 120 s in tartaric buffer pH 9 media
A covered quartz cell containing a 0.4 g sample powder and 2 mL concentrated HNO3, 0. 5 mL perchloric acid were added and placed on the hot plate and keep slightly boiling until dissolution of the sample was complete. If dissolution was in complete, the mixture was cooled to 80 ºC and 1 mL concentrated HNO3, 0.4 mL H2O2 30% was added. The mixture was heated to dryness to yield a whitish residue. The quartz cell was cooled to about 100 ºC, about 2 mL of water was added and heated at about 100 – 150 ºC for 2 h, and volume was made in 10 mL flask.
RESULT AND DISCUSSION
The complex of Nickel and Cobalt with dimethylglyoksime ligands (DMG) was formed in an ammonium buffer media.
Ni (H2O)62++ 2 H2DMG→Ni(HDMG)2 + 2 H++ 6 H2O. Accumulation take place at control potential, Ni or Co complex was adsorbed at the working electrode surface [4]
Ni(HDMG)2 ↔ Ni(HDMG)2Hg
In a stripping step, potential was scanned in negative direction (cathodic stripping) so that electrochemical reduction of adsorbed complex of Ni or Co was take placed, and formed peak reduction voltammogram.
Ni(HDMG)2Hg + 2e→ Ni(Hg) + 2 (HDMG) – Current peak (Ip) of cathodic stripping Ni/Co-DNG complex was used as the based of Ni/Co concentration calculation.
Fig 1 shows the dependence of current peak (Ip) of Co/Ni -DMG complex on the ligands concentration. Both current peak (Ip) of Ni and Co complex maximum on the 5×10⁻⁴ M DMG concentration. There fore this concentration was selected as the optimum concentration of DMG.
Indo. J. Chem., 2006, 6 (2), 161 - 164
Saryati,et al.
163
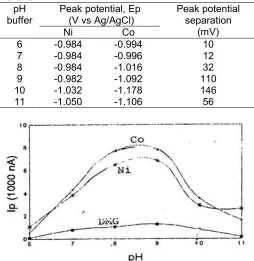
Table 1. Peak potential of Ni and Co in the buffer concentration.
Table 2. Peak potential of Ni and Co in pH buffer variation
Fig 2. The effect of pH buffer on current peak (Ip) Ni and Co. DMG concentration 5×10⁻⁴M, deposition potential -0.7 V, deposition time 120 s, Ni concentration = Co concentration = 20 ng/mL.
Fig 3.The effect of deposition potential on current peak (Ip) Ni and Co. DMG concentration 5×10⁻⁴M,deposition time 120 detik, Ni concentration = Co concentration = 20 ng/mL
So, the buffer concentration 0.1 – 1 M at pH 9 was selected as the optimum condition of supporting electrolyte for Ni and Co simultaneous determination.
The effect of potential deposition on current peak of Ni and Co was studied from -0.5 V to –0.9 V. In Fig 3 shows that Ip Co is relative constant but for Ip Ni tend to decrease after –0.7 V deposition potential. Therefore, -0.7 V was selected as the optimum deposition potential. Fig 4. shows the effect of deposition times from 60 to 600 s, on the current peak (Ip) both of Ni and Co. the maximum peak current was observed at 180 s for Ni or Co. Therefore 180 s was selected as the optimum deposition time.
By using -0.7 V deposition potential will give oportunity for the other ions like Cu, Cd or Pb were deposited on the surface of working electrode. Because of that Ni and Co determination using the negative scanning (cathodic stripping), Cu,Cd and Pb ion have no interference.
From the result above, we chose the following as the optimum experimental condition: supporting electrolyte is (0.1 – 1) M buffer ammonium tartaric pH 9.5×10⁻⁴M DMG, -0.7 V deposition potential and 180 s
Fig 4. The effect of deposition time on current peak (Ip) Ni and Co. DMG concentration 5×10⁻⁴M,deposition potential –0.7 V, Ni concentration = Co concentration = 20 ng/mL
Fig 5. The relationship between current peak(Ip) and Ni and Co concentration in tartaric buffer pH 9, DMG concentration 5×10⁻⁴M, deposition potential -0.7, deposition time 180 s.
Potential (V vs Ag/AgCl)
Indo. J. Chem., 2006, 6 (2), 161 - 164
Saryati,et al.
164
Table 3.Ni and Co in standard materials (n = 7 – 10)
Ni (µg/g) Co (µg/g)
Material standard
Our result Certificate Our result Certificate
Apple leave SRM 1515 0.90 ± 0.1 0.90 ± 0.1 nd nd
Bovine liver SRM 1577B 0.219 ± 0.008 Nd 0.143 ± 0.005 nd
Oyster Tissue SRM 1566b 1.047 ± 0.029 1.04 ± 0.09 0.361 ±0.019 0.371 ±0.009
Sargasso CRM no 9 Nd nd 0.121 ± 0.005 0.120 ± 0.01
Copepod RMMAA-1 1.89 ± 0.17 1.59 ± 0.2 0.125 ± 0.015 0.12 ± 0.01 nd = no data
Table 4. Recovery and RSD of Ni and Co in reference materials
Recovery (%) RSD(%)
Material standard
Ni Co Ni Co
Apple leave SRM 1515 100 nd 11 nd
Bovine liver SRM 1577B nd nd 3.65 3.50
Oyster Tissue SRM 1566b 100.67 97.30 2.77 5.37
Sargasso CRM no 9 nd 100.8 nd 4.13
CopepodRMMAA-1 103.15 104.17 10.37 6.40
Table 5. “t” value calculation and table [8] of the determination result
“t” calculation Material standard
Ni Co
“t” table Apple leave SRM
1515
0 nd 2.31
Bovine liver SRM 1577B
nd nd
-Oyster Tissue SRM 1566b
0.11 0.182 2.57
Sargasso CRM no 9
nd 0.037 2.57
Copepod RMMAA-1
2.3 0.127 2.31
Table 6.Ni and Co contained in the local vegetables
Sample Ni (µg/g) Co (µg/g)
Cassava leave Spinach
Mustrard greens Leafy vegetables carbbage
0.3 ± 0.1 1.3 ± 0.2
nd nd nd
nd 0.1 ± 0.0
nd nd nd
deposition time. From this optimum experimental condition, a linier relationship between the current peak and Ni or Co concentration was obtained in the range 5 – 30 ng/mL (Fig 5). Linier regression equation for standard curve in this range for Ni is Ni: Y = 477.9 X + 3548 with r = 0.9998 and for Co is Y = 388.3 X + 228.7 with r = 0,9991. Limit detection of Ni and Co is 0.4 ng/ml , obtained by that statistical calculation of standard curve [7]. An application of this method in the determination of Ni and Co in biological material standard showed in Table 3, 4 and 5. Shows that recovery of this method is in the range of 97.30% -104.17% with relative standard deviation (RSD) is in the range of 2.77% – 10.37%. From the ‘t’ test [7], shows that “t” calculation was smaller than “t” table value.
Therefore, it can be concluded that concentration determination result and the standard concentration value have no significant difference. This result demonstrated that digestion sample have been done perfectly.
CONCLUSION
The optimum experimental condition: supporting electrolyte was (0.1 – 1 ) M buffer ammonium tartaric pH 9, 5×10⁻⁴ M DMG, -0.7 V deposition potential and 180 s deposition time. A linier relationship between the current peak and Ni or Co concentration was obtained in the range 5 – 30 ng/mL Limit of detection of this method 0.4 ng/mL for Ni and Co. The recovery is about 97.30 -104.17% with relative standard deviation (RSD) is about 2,77 -10,37%. Digestion sample using the mixture of HNO3, perchloric acid, H2O2 were heated to dryness was suitable to the Ni and Co in the biological material determination. There are only cassava leave and spinach that contain Ni and Co in all local vegetables that studied
REFFERENCES
1. Bolt A.W., 1995,Curr. Separations.,14, 1
2. Wang Y, 1985, Stripping analysis. Principles. Instrumentation and application
3. Neiman E.Y and Dracheva L.V, 1990, Z. Anal. Khim., 45, 2
4. Vos L., 1986,Anal. Chem. Acta.,184 5. Thunus L., 1990,Anal. Lett.23, 5
6. Anonim, 1988, Polarographic Analyzer Instruction Manual, Model 384B, Princeton Applied Research Corporation
![Table 5. “t” value calculation and table [8] of thedetermination result](https://thumb-ap.123doks.com/thumbv2/123dok/3376845.1758951/4.595.44.296.354.580/table-t-value-calculation-table-thedetermination-result.webp)
