THE INFLUENCE OF FINANCIAL PERFORMANCES ON INDONESIA’S
STATE-OWNED BANKS TOWARDS SHARE RETURNS IN 2013-2016
I Wayan Sunarya
STMIK STIKOM Indonesia, Program Study Teknik Informatika
Jl. Tukad Pakerisan No. 97, Panjer, Denpasar - Bali 80225 Telp. (0361) 256995 / Faks. (0361) 246875
Abstract
The performance of financial statements shows the level of productivity in a company. Specific to banking sector, the performance of its financial statements can be analyzed from Economic Value Added (EVA) and Market Value Added (MVA). This study analyzes MVA and EVA are of state-owned banks consisting of Bank Tabungan Negara (BTN), Bank Negara Indonesia (BNI), Bank Mandiri and
Bank Rakyat Indonesia (BRI). The results convey that Indonesia’s state-owned banks in giving share
return to theirs shareholders are not influenced by Economic Value Added (EVA) and Market Value Added (MVA). There is an evidence that, EVA and MVA do not give any effect to share return because in the state owned bank in Indonesia, the investors have been very confident about the performance of banks in Indonesia so that without seeing the performance of the financial statements of investors have been very convinced from the fundamental point that the Indonesia state owned banks can bring benefits to investors (JEL Classification: G21, G35, D12, D47)
Keywords: state-owned bank, share return, economic value added, market value added
INTRODUCTION
In general, financial statement analysis uses several methods in analyzing the companies’
financial statements. The financial statement analysis will be used by the management to achieve operational decisions. One of the business entities that use the financial statement analysis is banking sector. Bank is a business entity that aims to receive funds from the public either in the form of savings deposits, deposits and so forth. In addition, banks have to extend credit to the entrepreneurs and to the community business expansion. In Indonesia, there are various banks from state-owned banks to private banks. States-owned banks in Indonesia include Bank Tabungan Negara, Bank Negara Indonesia, Bank Mandiri and Bank Rayat Indonesia. While, private banks in Indonesia include, Bank Central Asia, Bank Danamon, and Bank Permata.
The scope of this research is the state-owned banks. A state bank runs its business by focusing
on the stability of its business reflected from its financial statements. For go public’s banks or have
RESEARCH METHOD
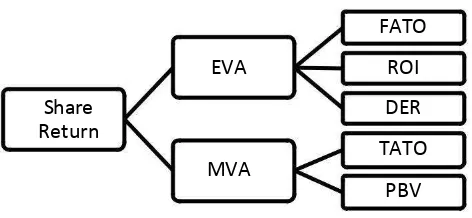
There are some approaches used in analyzing stocks such as Share Return, Fixed Assets Turnover (FATO), Return on Investment (ROI), Debt to Equity Ratio (DER), Price to Book Value (PBV), Total Assets Turnover (TATO) Economic Value Added (EVA), Market Values Added (MVA). This research aims to examine the effect of variables that indicate stocks performance on Share Return. Therefore research framework is formulated as follow,
Figure 1. Research Framework
Share return is the result of profit or often called capital gains or losses are often called the capital loss that will be obtained by investors in a period. According to Huda et al. (2015: 178), the formula used in seeking this share return is:
Pa =
(Pi.t -Pi.t-1)x 100%
= stock price I in quarter t = stock price in quarter t-1
Independent Variables
1. Calculation of Economic Value Added (EVA)
According to Irianti Y.N., et.al (2014:3) in Moeljadi (2006:75) states Economic Value Added is a value added to the shareholders by management for a certain year. EVA formula by Huda et al. (2015:179) in Bennett Stewart III (1991 that is :
EVA = NOPAT – COC
2. Calculation of Market Value Added (MVA)
According to Zulvina (2010:137) in Young and O’Byrne (2001) MVA is the value earned by
using formula by Huda, et.al (2015:179) in Stewart (1996) is a "cash difference either debt or equity the investors have in the company and contributes to the expected cash value" and is formulated as follows:
MVA = Equity Market Value - Equity Book Value
In which:
EMV = Number of shares x Price/Shares
EBV = Number of shares x Nominal value/Shares
3. Fixed Assets Turnover (FATO)
According to Gunawan and Wahyuni (2013:66) in Munawir (2004: 240), Fixed Assets Turnover is the ratio between sales and fixed assets. Fixed Assets Turnover or often abbreviated with FATO is used to analyze the effectiveness of the use of funds contained in the bank's fixed assets in generating sales. From the FATO results that have been analyzed, if the result is higher the ratio from year to year means the more effective use of fixed assets. Formula for calculating FATO that is:
FATO = Sales x 100%
Fixed Assets
4. Return on Investment (ROI)
According to Topowijono, et al. (2015:4) in Hanafi (2012:157) states Return on Investment is a measure of the ability of a company in generating net profits using the total assets owned company. Given this ratio, it will be known about the condition of net profit after bank tax by using all assets owned by the bank itself. Formula for calculating ROI that is:
ROI =
Earning After Tax x 100%Total Assets
5. Debt to Equity Ratio (DER)
According to Ramdhani (2013: 30) in Kasmir (2008) states Debt to Equity Ratio (DER) is the ratio used to assess debt with equity. For a business entity such as banking, the level of DER above 100% can be said to be normal, because the bank manages funds from customers in its operational activities. For the banking world, capital managed from customers is used for the distribution of credit to the community, so that from the credit provided to generate interest on the loan which will be used as a source of income by the bank. In search of DER analysis using the formula total debt owned by bank divided by total equity owned by bank. Formula for calculating DER that is:
DER =
Total
Total
Equity
Debts
x 100%6. Price to Book Value (PBV)
According to Silalahi (2014:6) states Price to Book Value describes how much the market appreciates the value of a company's stock book. This is because the higher the ratio of Price to Book Value of a bank then the higher returns also owned stock. Formula for calculating PBV that is:
7. Total Assets Turnover (TATO)
According to Setiawan (2015:5) in Moeldjadi (2008:50) states Total Asset Turnover shows the ability of total assets to spin for a year to generate sales that can be calculated by dividing net sales by total assets. Formula for calculating TATO that is:
Sales
TATO =
Total Assets
x 100%
Regression Analysis
Based on research Huda et.al (2015:179) the analysis model used for analysis research EVA and
MVA is using multiple regression analysis with several variables consisting of FATO (X1), ROI (X2),
DER (X3), TATO (X4), PBV (X5), EVA (X6), dan MVA (X 7) and Share Return (Y).
a, b, c = coefficient of regression of each variable
U = disturbance error
i = bank data observed
t = time series data showing the length of time taken
RESULTS AND DISCUSSION
1. Economic Value Added (EVA)
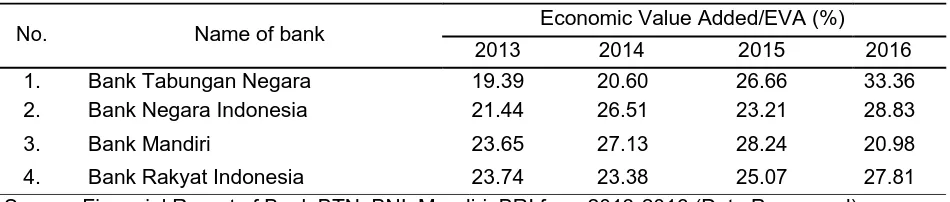
The data of Indonesia state-owned banks on Economic Value Added (EVA) from 2013 to 2016 are as follows:
Table 1. Analysis on EVA of Indonesia State-owned Bank from 2013-2016
No. Name of bank Economic Value Added/EVA (%)
2013 2014 2015 2016
1. Bank Tabungan Negara 19.39 20.60 26.66 33.36
2. Bank Negara Indonesia 21.44 26.51 23.21 28.83
3. Bank Mandiri 23.65 27.13 28.24 20.98
4. Bank Rakyat Indonesia 23.74 23.38 25.07 27.81
Source: Financial Report of Bank BTN, BNI, Mandiri, BRI from 2013-2016 (Data Processed)
2. Market Values Added (MVA)
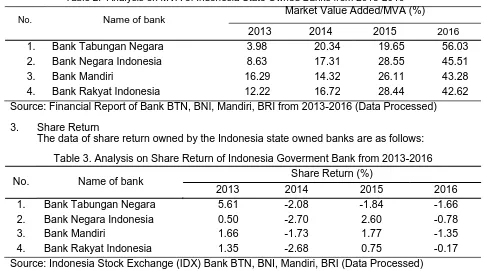
Table 2. Analysis on MVA of Indonesia State Owned Banks from 2013-2016
Market Value Added/MVA (%)
No.
2013 2014 2015 2016
1. Bank Tabungan Negara 3.98 20.34 19.65 56.03
2. Bank Negara Indonesia 8.63 17.31 28.55 45.51
3. Bank Mandiri 16.29 14.32 26.11 43.28
4. Bank Rakyat Indonesia 12.22 16.72 28.44 42.62
Source: Financial Report of Bank BTN, BNI, Mandiri, BRI from 2013-2016 (Data Processed)
3. Share Return
The data of share return owned by the Indonesia state owned banks are as follows:
Table 3. Analysis on Share Return of Indonesia Goverment Bank from 2013-2016
No. Name of bank Share Return (%)
2013 2014 2015 2016
1. Bank Tabungan Negara 5.61 -2.08 -1.84 -1.66
2. Bank Negara Indonesia 0.50 -2.70 2.60 -0.78
3. Bank Mandiri 1.66 -1.73 1.77 -1.35
4. Bank Rakyat Indonesia 1.35 -2.68 0.75 -0.17
Source: Indonesia Stock Exchange (IDX) Bank BTN, BNI, Mandiri, BRI (Data Processed)
4. Fixed Assets Turnover (FATO)
The data on Fixed Assets Turnover (FATO) from Indonesian government banks from 2013- 2016 are as follows:
Table 4. Analysis on FATO of Indonesia State-owned Bank from 2013-2016
No. Name of bank Fixed Assets Turnover/FATO (%)
2013 2014 2015 2016
1. Bank Tabungan Negara 3.34 3.48 3.21 1.94
2. Bank Negara Indonesia 4.07 4.84 1.66 1.88
3. Bank Mandiri 2.28 2.41 2.57 1.39
4. Bank Rakyat Indonesia 4.52 4.59 5.21 2.28
Source: Financial Report of Bank BTN, BNI, Mandiri, BRI from 2013-2016 (Data Processed)
5. Return on Investment (ROI)
The data on Return on Investment from banks owned by the government of Indonesia are as follows:
Table 5. Analysis on ROI of Indonesia State-owned Banks
from 2013-2016
Return on Investment /ROI (%)
No.
2013 2014 2015 2016
1. Bank Tabungan Negara 1.10 0.77 1.08 1.22
2. Bank Negara Indonesia 2.34 2.59 1.78 1.88
3. Bank Mandiri 2.48 2.32 2.23 1.41
4. Bank Rakyat Indonesia 3.41 3.02 2.89 2.61
Source: Financial Report of Bank BTN, BNI, Mandiri, BRI from 2013- 2016 (Data Processed)
6. Debt to Equity Ratio (DER)
The data Debt to Equity Ratio (DER) bank owned by the government of Indonesia year 2013- 2016 are as follows:
Table 6. Analysis on DER of Indonesia State-owned Bank from 2013-2016
No. Name of Bank Debt to Equity Ratio/DER (%)
2013 2014 2015 2016
1. Bank Tabungan Negara 1.164 1.084 1.140 1.020
2. Bank Negara Indonesia 711 559 526 552
3. Bank Mandiri 672 665 617 538
4. Bank Rakyat Indonesia 689 721 676 584
Source: Financial Report of Bank BTN, BNI, Mandiri, BRI from 2013-2016 (Data Processed)
7. Price to Book Value (PBV)
The PBV data of Indonesia state-owned banks from 2013-2016 that is:
Table 7. Analysis on PBV of Indonesia State-owned Bank from 2013-2016
No. Name of bank Price to Book Value/PBV (%)
2013 2014 2015 2016
1. Bank Tabungan Negara 89.42 104.32 98.87 96.32
2. Bank Negara Indonesia 154.48 186.42 118.64 115.44
3. Bank Mandiri 206.29 239.80 180.63 176.10
4. Bank Rakyat Indonesia 225.46 294.05 249.14 196.18
Source: Financial Report of Bank BTN, BNI, Mandiri, BRI from 2013-2016 (Data Processed)
8. Total Assets Turnover (TATO)
The data Total Asset Turnover (TATO) from Indonesia State-owned Banks from 2013-2016 are as follows:
Table 8. Analysis TATO of Indonesia Goverment Bank from 2013-2016
No. Name of bank Total Assets Turnover/TATO (%)
2013 2014 2015 2016
1. Bank Tabungan Negara 8.22 8.86 8.71 8.00
2. Bank Negara Indonesia 6.84 8.01 7.25 7.26
3. Bank Mandiri 6.85 7.33 7.86 7.39
4. Bank Rakyat Indonesia 9.50 9.37 9.73 9.44
Source: Financial Report of Bank BTN, BNI, Mandiri, BRI from 2013-2016 (Data Processed)
9. Effect of FATO, ROI and DER on EVA
From data FATO (table 4), ROI (table 5), DER (table 6) can be calculate for to know analysis regression between FATO, ROI and DER to EVA (table 1) in effect performance financial report in Indonesia Goverment Bank from 2013 until 2016. The result of FATO Effect Analysis, ROI and DER to EVA by using EViews program as follows:
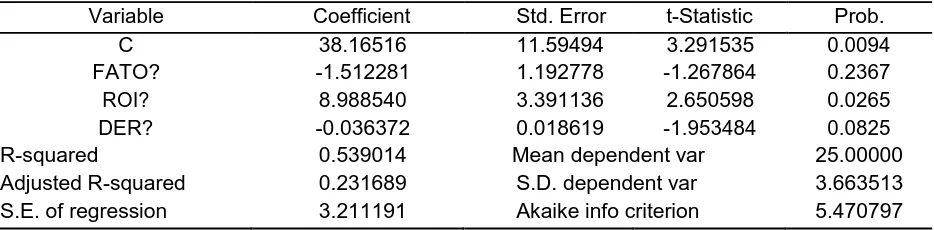
Table 9. Result Analysis on the Effect of FATO, ROI and DER on EVA in Indonesia Goverment Bank from 2013-2016
Adjusted R-squared 0.231689 S.D. dependent var 3.663513
Sum squared resid 92.80575 Schwarz criterion 5.808804
Log likelihood -36.76638 Hannan-Quinn criterion 5.488106
F-statistic 1.753892 Durbin-Watson stat 1.914772
Prob(F-statistic) 0.215274
Source: Table 1, 4, 5, 6 (Data Processed)
From the results of statistical analysis in table 9 can be explained that affecting Economic Value Added (EVA) for state-owned banks in Indonesia from 2013-2016 is the level of Return On Investment (ROI) because it has a probability of less than 5%, while the level of correlation between FATO, ROI, and DER to EVA by 54% while the remaining 46% is influenced by other factors such as inflation rate and so forth. The results of analysis between banking and mining have different results. This is not in line with research Huda et al. (2015) states that affect EVA is DER because it is a concern for investors in determining investment decisions.
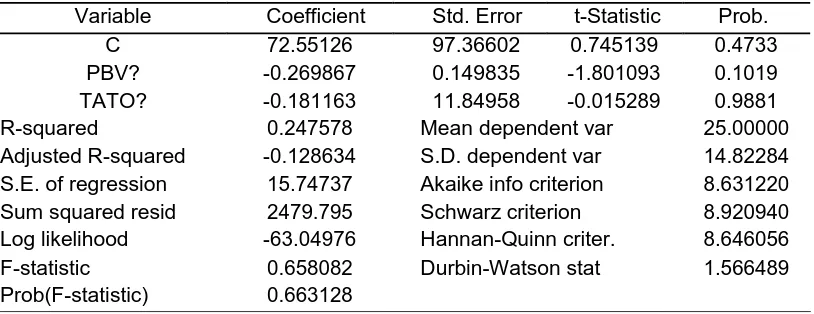
10. Effect of PBV and TATO on MVA
From data PBV (table 7), TATO (table 8) and MVA (table 2) can be calculate for to know analysis regression between PBV and TATO to MVA in performance effect financial report in Indonesia Goverment Bank from 2013 until 2016. The result of FATO, ROI and DER to EVA Effect Analysis by using EViews program as follows:
Table 10. Result Analysis on the Effect of PBV and TATO on MVA in Indonesia State-owned Bank from 2013-2016
Adjusted R-squared -0.128634 S.D. dependent var 14.82284
S.E. of regression 15.74737 Akaike info criterion 8.631220
Sum squared resid 2479.795 Schwarz criterion 8.920940
Log likelihood -63.04976 Hannan-Quinn criter. 8.646056
F-statistic 0.658082 Durbin-Watson stat 1.566489
Prob(F-statistic) 0.663128
Source: Table 2, 7, 8 (Data Processed)
From the results of the statistical analysis in table 10, it can be explained that PBV and TATO does not affect the Value Added (MVA) Maket for state-owned banks in Indonesia from 2013-2016, it is seen that the probability for PBV and TATO is above 5%, where the level of PBV correlation and TATO to MVA by 25%, while the remaining 75% is influenced by factors other than PBV and TATO.This is not in line with the research of Ghulam Nurul Huda, et.al (2015) states that affecting the MVA is PBV and TATO because becoming MVA will show the level of feasibility of a stock in the capital market.
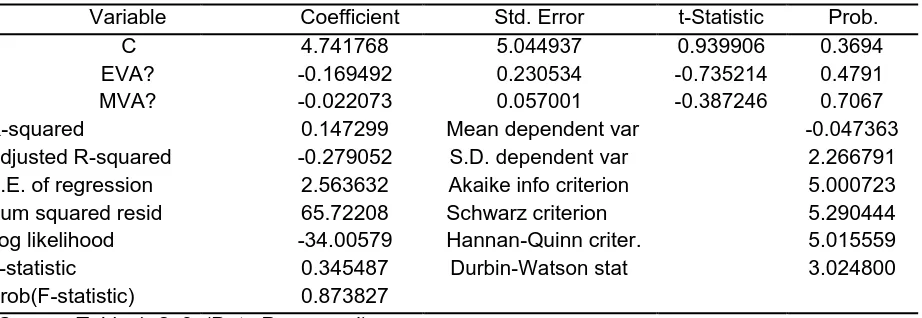
11. Effect of EVA and MVA on Share Return
Table 11. Result Analysis on the Effect of EVA and MVA on Share Return in Indonesia State-owned
Adjusted R-squared -0.279052 S.D. dependent var 2.266791
S.E. of regression 2.563632 Akaike info criterion 5.000723
Sum squared resid 65.72208 Schwarz criterion 5.290444
Log likelihood -34.00579 Hannan-Quinn criter. 5.015559
F-statistic 0.345487 Durbin-Watson stat 3.024800
Prob(F-statistic) 0.873827
Source: Table 1, 2, 3 (Data Processed)
From the results of statistical analysis in table 11, it can be explained that EVA and MVA does not affect Share Return for state-owned banks in Indonesia from 2013-2016, it is seen that the probability for EVA and MVA is above 5%, where the EVA and MVA correlation rate to Share Return of 15%, while the remaining 85% is influenced by factors other than EVA and MVA. This is not in line with the research of Huda et.al (2015) states that affecting the EVA and MVA is affeting Share of Return.
CONCLUSION
After the discussion that has been explained then can be made a conclusion about the influence of EVA and MVA in giving share return in the Indonesia state-owned banks, there is an evidence that, EVA and MVA do not give any effect to share return because in the banking world, particularly state-owned bank in Indonesia, the investors have been very confident about the performance of banks in Indonesia so that without seeing the performance of the financial statements of investors have been very convinced from the fundamental point that the Indonesia state-owned banks, therefore this situation can bring benefits to investors.
RECOMMENDATION
1. For Bank BTN, BNI, Mandiri and BRI
Recommendations that can be given to Indonesian state owned banks consisting of Bank BTN, BNI, Mandiri and BRI are to maintain the banking performance to be trusted by the customers by providing good service and quality of banking products in accordance with the wishes of the community.
2. For Investors
Recommendations that can be given to the retail investors is choosing shares of state owned bank such as Bank BTN, BNI, Mandiri and BRI have no risk in investing, because it is proven shares of Indonesia state-owned bank gives investment returns that continue to grow from year to year because of an increase in assets and profits earned by Indonesian state-owned banks.
REFERENCES
Bank Tabungan Negara. 2017. Laporan Tahunan Bank Tabungan Negara Tahun 2016. http://www.btn.co.id. [8 September 2017]
Bank Mandiri. 2017. Laporan Tahunan Bank Mandiri Tahun 2016. http://www.bankmandiri.co.id. [13 September 2017]
Bank Rakyat Indonesia. 2017. Laporan Tahunan Bank Rakyat Indonesia Tahun 2016. http://www.ir-bri.com. [15 September 2017]
Gunawan, A. dan Wahyuni, S. F. 2013. Pengaruh Rasio Keuangan Terhadap Pertumbuhan Laba pada perusahaan perdagangan di Indonesia. Jurnal Manajemen & Bisnis 13(1):63-84. Huda, G. N., Sinaga, B. M., dan Andati, T. 2015. The Influence of Corporate Financial Performance
On Share Return. Indonesian Journal of Business and Entrepreneurship 1(3):177-185. Ningtias, I. Y., Saifi, M. dan Husaini, A. 2014. Analisis Perbandingan antara Rasio Keuangan dan
Metode Economic Value Added (EVA) sebagai pengukur kinerja keuangan perusahaan: Studi Kasus pada PT. Indofoof Sukses Makmur, Tbk dan Anak Perusahaan yang terdaftar di Bursa Efek Indonesia Periode Tahun 2010-2012. Jurnal Administrasi Bisnis 9(2):1-8.
Ramdhani, R. 2013. Pengaruh Return On Assets dan Debt to Equity Ratio terhadap Harga Saham pada Institusi Finansial di Bursa Efek Indonesia. Journal The Winner 14(1):29-41.
Saraswati, N. M. D. P., Topowijono dan Yaningwati, F. 2015. Analisis Du Pont System sebagai salah satu alat mengukur kinerja keuangan perusahaan: Studi pada perusahaan rokok yang listing di Bursa Efek Indonesia Tahun 2011-2013. Jurnal Administrasi Bisnis 23(1):1-9
Setiawan, E. 2015. Pengaruh Current Ratio, Inventory Turnover, Debt To Equity Ratio, Total Asset Turnover, Sales dan Firm Size terhadap ROA pada perusahaan Food and Beverage yang terdaftar di Bursa Efek Indonesia (BEI) periode 2010-2013 [skripsi]. Riau: Universitas Maritim Raja Ali Haji, Fakultas Ekonomi, Jurusan Akuntansi
Silalahi, S. P. 2014. Pengaruh Corporate Social Repsonsibility (CSR) Disclosure, Beta dan Price To Book Value (PBV) terhadap Earnings Response Coefficient (ERC) : Studi Empiris pada perusahaan manufaktur yang terdaftar di Bursa Efek Indonesia. Jurnal Ekonomi 22(1):1-14 Zulvina, R. A. 2010. Analisis perbandingan kinerja keuangan sebelum dan sesudah merger dengan