EXPLORATION OF URBAN SPATIAL PLANNING EVALUATION BASED ON
HUMAN-LAND HARMONY
KEY WORDS: Population Urbanization, Urbanization Rate, Grey System Model, Urban Spatial Planning, Big Data Analysis
ABSTRACT:
This study puts forward a new concept, "population urbanization level forecast - driving factor analysis - urban spatial planning analysis" for achieving efficient and intensive development of urbanization considering human-land harmony. We analyzed big data for national economic and social development, studied the development trends of population urbanization and its influencing factors using the grey system model in Chengmai county of Hainan province, China. In turn, we calculated the population of Chengmai coming years based on the forecasting urbanization rate and the corresponding amount of urban construction land, and evaluated the urban spatial planning with GIS spatial analysis method in the study area. The result shows that the proposed concept is feasible for evaluation of urban spatial planning, and is meaningful for guiding the rational distribution of urban space, controlling the scale of development, improving the quality of urbanization and thus promoting highly-efficient and intensive use of limited land resource.
1. INTRODUCTION
According to “the new urbanization state plan(2014-2020)” issued by the CPC Central Committee and the State Council, these years our country is just in the critical period of rapid development, the rate of urbanization between 30% and 70%, and best described as the great epoch of economic transformation and rapid development in socialist modernization, by the universal laws of urbanization development. Yet a series of problems have come along with urbanization: urbanization of the land is faster than the urbanization of the population; construction is extensive and inefficient; the distribution and scale of urban spatial structure is unreasonable; urbanization dose not matching with the resources and environmental carrying capacity, and so on. Coordination of the development of population, land, economy, and society under the guidance of the new state plan for urbanization is now a problem to be solved. To address these kinds of problems, various disciplines and fields both at home and abroad focus on urban development, including economics, sociology, geography, administrative science, architecture and ecology(Li, L.Y., 2013). The research however, that considers improvements in high efficiency development of regional urbanization, to a great extent synthetically, on the premise of human-land harmony is relatively scarce.
Urbanization has four types of population, land, economy, and social urbanization that are closely related to each other. While population urbanization is the core (Wu, J., 2013), town planning is the programmatic document that guides its development. In this study we consider "population urbanization" as the breakthrough point. Based on comprehensive analysis of regional big data including population, economic development, and space planning data over the years, this study puts forward a new concept, “population urbanization level forecast - driving factor analysis - urban spatial planning analysis”, for evaluating urban spatial planning, to guide the reasonable adjustment and promoting the efficient and intensive development of urban, on the premise of human-land harmony. A variety of theories and technologies were used, such as the grey system model, and GIS spatial analysis.
2. RESEARCH IDEAS AND THEORETICAL BASIS 2.1 Research Ideas
The new concept, as shown in Figure 1, divides into five parts: (1) Considering urbanization rate as the main indicator for evaluating regional urbanization level, we analyze the regional urbanization rate of a long time series to understand its development laws. Subsequently, we forecast the value in the coming years using a GM(1,1) model.
(2) Combining regional development characteristics, we select several indicators that have great influence on the regional urbanization level and distinguish between driving factors and restricting factors using a comprehensive grey relation analysis model. We explore how to adjust the industrial structure to maintain or improve existing urbanization rate.
(3) We forecast regional urban population size through an urban population forecasting model and calculate a reasonable planning area for residential, administration and public service land, road and transportation, and green space and square land, closely associated with the population, according to the national standard of "Code for classification of urban land use and planning standards of development land (GB50137-2011)". (4) We sum up the actual planning area and proportion of all kinds of development land, and then compare, analyze, and evaluate the real to the forecasted values.
(5) At last, based on the research results from the 2th and 4th steps, we explore how to guide reasonable adjustment of urban spatial planning to promote efficient and intensive development of town space on the premise of human-land harmony.
a Hainan Geomatics Center of National Administration of Surveying, Mapping and Geoinformation, Haikou, China
Urbanization
urban development land Explore how to maintain
or improve existing urbanization rate
Suggestion about adjusting urban space planning based on human-land harmony
2.2.1 Urbanization Rate Calculation: Population urbanization rate refers to the proportion of urban population to permanent population(Liu, S.F., 2010), which is an important indicator reflecting urbanization development. Permanent population and registered population are two ways to present population statistics in our country. Permanent population is divided into urban and rural population, while registered population is divided into agricultural and non-agricultural population.
The formula for population urbanization rate is as follows:
100%
P
= urban populationp
P
= permanent population2.2.2 Grey System Theory: Grey system theory considers uncertainty problems, such as "small sample", or "poor information" that are difficult to be solved by probability and statistics and fuzzy mathematics. Grey system theory explores the real laws of a thing in motion, according to the information coverage, based on a sequential operator. In this study the GM(1,1) grey model was used to forecast the rate of regional urbanization. The grey comprehensive correlation analysis method exposes the driving and restricting factors in regional urbanization(Cao, M.X., 2007; Zhang, H., 2015).
Building the GM(1,1) Model
The GM(1,1) model is the basis of grey system forecasting and is most widely used. It is a first-order differential equation containing only one variable, applied when the original data has good smoothness, and is able to describe the whole
development trend of a system. The modelling process is as follows:
Suppose (0)
X is a positive original data sequence of a
forecasted object:
{
}
(0) = (0)( ), =1, 2,,
X x i i n (2)
When this sequence is subjected to the Accumulating Generation Operation (AGO), the following sequence X(1) is obtained:
The least square estimate sequence of the grey difference equation of GM(1,1) is defined as follows:
(0)( )+ ∗ (1)( )=
x k a Z k u (7)
The equation is therefore, as follows:
(1)
Model of Grey Comprehensive Correlation Analysis
Grey comprehensive correlation analysis is a research method for quantitative comparison of the correlation degree between certain factors that contain mutual contact, influence, and restriction. The basic idea is to determine whether a correlation is close or not, according to the degree of similarity between the geometric shapes of sequence curves. The smaller the curve similarity degree means the smaller the correlation degree between corresponding sequences, and thus the less degree of mutual influence. If the results are to the contrary, then the results show a closer degree of similarly and mutual influence.
Consider the two raw data sequences
{ }
0
X and
{ }
i(
)
1) Calculate absolute degree (
0
ε
i) and relative degree (γ
0i) of gray correlation separatelyThe starting point zeroization of raw data sequences for calculating absolute correlation degree:
(
)
Initialize raw data sequences for calculating relative correlation degree:
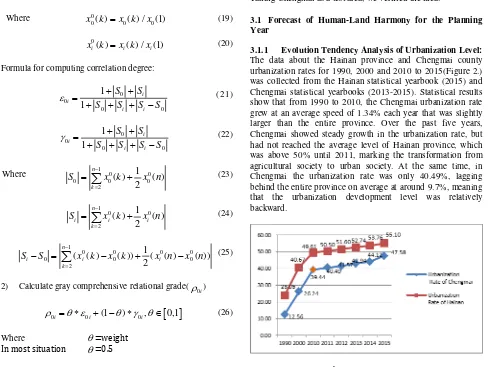
Formula for computing correlation degree:
0
2) Calculate gray comprehensive relational grade(
0
2.2.3 Model for Urban Population Forecast: The overall balance method measures permanent population for the next year by natural growthing rate and mechanical growth rate. While natural growth rate is the ratio of the natural population increase to the average in that period, and mechanical growth rate is the ratio of immigratory population minusing emigrant population to the average in that period. The formula is as follows:
0 (1 )
= ∗ + + n
Q Q K P (27)
Where Q=forecasted value of permanent population
0
Q =present value of permanent population
K=natural growth rate (%)
P=mechanical growth rate (%)
n=planning period (year)
3. EXPERIMENT AND ANALYSIS
In recent years, Chengmai county actively implemented the “three counties and a base” strategy for economic development. The goal is to develop into an ecological modernized county, a new industrial county, a leisure and low carbon tourism county. It is also a tropical high-efficiency agriculture demonstration base, becoming the third largest investment body and the fourth largest economic entity among all the cities and counties in Hainan province, and therefore has certain representativeness. Taking Chengmai as a test area, we verified the idea.
3.1 Forecast of Human-Land Harmony for the Planning Year
3.1.1 Evolution Tendency Analysis of Urbanization Level: The data about the Hainan province and Chengmai county urbanization rates for 1990, 2000 and 2010 to 2015(Figure 2.) was collected from the Hainan statistical yearbook (2015) and Chengmai statistical yearbooks (2013-2015). Statistical results show that from 1990 to 2010, the Chengmai urbanization rate grew at an average speed of 1.34% each year that was slightly larger than the entire province. Over the past five years, Chengmai showed steady growth in the urbanization rate, but had not reached the average level of Hainan province, which was above 50% until 2011, marking the transformation from agricultural society to urban society. At the same time, in Chengmai the urbanization rate was only 40.49%, lagging behind the entire province on average at around 9.7%, meaning that the urbanization development level was relatively backward.
Based on the raw data of urbanization rate from 2010 to 2015, the GM(1,1) grey system model was used to forecast urbanization development level from 2016 to 2020. According to the modelling process, two GM (1,1) models were obtained .
GM (1,1) model for Chengmai:
0( )−0.0390∗ 1( )=37.707
x k Z k (28)
GM (1,1) model for Hainan:
0( )−0.0232∗ 1( )=48.59
x k Z k (29)
The two development coefficients were 0.039 and 0.0232. The average relative errors of restored urbanization rates for Chengmai and Hainan by GM(1,1) model were 1.14% and 0.33% respectively, which were small (Table1.), and could be used to forecast future values.
The years
Urbanization rate of Chengmai Urbanization rate of Hainan
Real value Restored value Average relative error (%) Real value Restored value Average relative error (%)
2010 39.44 39.44
1.14
47.20 47.20
0.33
2011 40.49 40.02 50.20 50.27
2012 41.57 41.61 51.30 51.45
2013 42.94 43.27 53.10 52.66
2014 44.12 44.99 53.76 53.90
2015 47.58 46.78 55.10 55.17
Table 1. Restored value and average relative error of urbanization rate (2010-2015)
The years 2016 2017 2018 2019 2020
Chengmai 48.64 50.57 52.58 54.67 56.85
Hainan 56.46 57.79 59.15 60.54 61.96
Table 2. Forecasted value of urbanization rate (2016-2020)
Forecasted results showed that Chengmai urbanization level would continue to grow in the next five years, and expected to top 50% in 2017. By then, Chengmai will be an urban society and no longer rural. The urbanization rate will reach 56.85% in 2020, 8.21% more than in 2016. According to the world development law of urbanization rate, Chengmai urbanization itself would enter the deceleration phase after the rate reaches 50%. Analyzing various economic factors affecting the development of Chengmai urbanization can inform adjustments in the industrial structure and necessary to maintain the current urbanization growth rate.
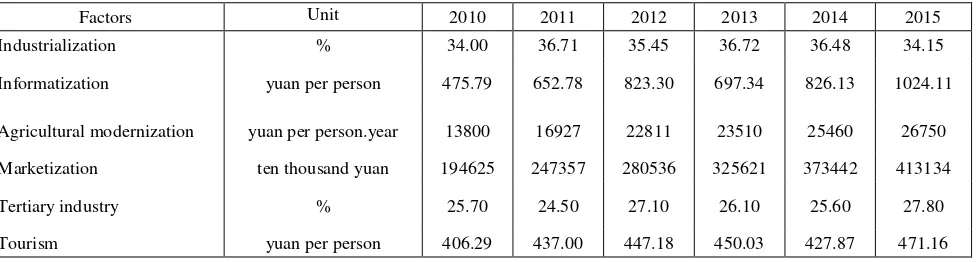
3.1.2 Analysis of Influence Factors: Combining with the characteristics of Chengmai local economic development, six factors, including industrialization, informatization, agricultural modernization, marketization, the development level of tertiary industry and tourism, were chosen from numerous factors to construct an analysis matrix for calculating the effectiveness of Chengmai urbanization.
The following three indicators were calculated: 1) the grey absolute correlation degree reflecting the similarity between two lines; 2) the grey relative correlation degree reflecting the proximity of their change rates relative to the starting point; and 3) the grey comprehensive relational grade, combining the two relational degrees, a relatively quantitative index that comprehensively reflects the correlation degree between sequences.
Raw data for each factor collected from the ChengMai statistical yearbooks for the relevant years is shown in Table 3.
Factors Unit 2010 2011 2012 2013 2014 2015
Industrialization % 34.00 36.71 35.45 36.72 36.48 34.15
Informatization yuan per person 475.79 652.78 823.30 697.34 826.13 1024.11
Agricultural modernization yuan per person.year 13800 16927 22811 23510 25460 26750
Marketization ten thousand yuan 194625 247357 280536 325621 373442 413134
Tertiary industry % 25.70 24.50 27.10 26.10 25.60 27.80
Tourism yuan per person 406.29 437.00 447.18 450.03 427.87 471.16
Table 3. Original data of influence factors
Grey comprehensive correlation analysis was used to calculate absolute correlation degree, relative correlation degree, and comprehensive relational grade, based on urbanization rate data
large impact of these factors on Chengmai urbanization development. Among all the factors analyzed, industrialization had the largest influence, whose absolute correlation degree reached 0.8119, relative correlation degree 0.9895, and comprehensive correlation degree 0.9007. Tourism and development level of tertiary industries were in second place,
whose comprehensive correlation degree were 0.772 and 0.7668. The comprehensive relational grade of informatization, agricultural modernization, and marketization were 0.6739, 0.6708 and 0.6714, showing the roughly same influence, and were relatively new influences on the process of Chengmai urbanization development.
Influence factor Urbanization rate
Absolute correlation degree Relative correlation degree Comprehensive relational grade Rank
Industrialization 0.8119 0.9895 0.9007 1
Informatization 0.5058 0.8421 0.6739 4
Agricultural modernization 0.5002 0.8413 0.6708 6
Marketization 0.5000 0.8427 0.6714 5
Tertiary industry 0.5643 0.9693 0.7668 3
Tourism 0.547 0.998 0.772 2
Table 4. Grey correlation degree
Typically, industrial investment significantly lifts the urbanization level, but with continuous improvement, population shifting to secondary industries gradually declines. Industrialization will weaken if urbanization development is continuously promoted. Therefore, to maintain the stable and sustainable growth at the current urbanization rate, Chengmai must adjust the industrial structure by accelerating the development of agricultural modernization and tertiary industries, expanding employment to create conditions for the transfer of agricultural population to other industries based on steady development.
3.1.3 Forecasting Population and Land Use Scale for a Planning Year: Population size determines the demand for land, infrastructure, urban infrastructure, and urban service facilities during urban development, to a large extent(Zhang, H., 2015; Hu, X.D., 2016; Lv, Y., 2014). Given limited land resources, economical and intensive use of land must be strengthened with the expansion of population(Zhang, L.Q.,2014). Forecasting the scale of the future population is necessary for analyzing urban scale planning and guiding growth rationally to achieve human-land harmony.
(1) Population Forecast
In this study, we forecasted permanent population in 2020 by the overall balance method, and calculated urban population using forecasted urbanization rate in 2020(as discussed in the theoretical section). Population data of 2015 from ChengMai statistical yearbook (2016) were taken as the present value, we averaged the value over the past six years (2010-2015) as natural growth rate and mechanical growth rate for the planning period. The basic data and forecasted values are shown in Table 5.
The years Permanent resident (person)
Natural growth rate (‰)
Mechanical growth rate (‰)
Urbanization rate (%)
Forecasted urban population( person)
2015 555566 10.30 3.00 / /
2020 593506 / / 56.85 337408
Table 5. Basic and forecasted value of Chengmai population (2020)
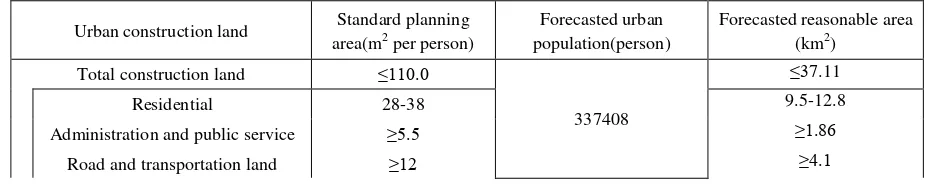
(2) Reasonable Area Forecasting and Planning
The study forecasted the areas of total construction land, residential land, administration and public service land, road and transportation, and green space and square land. Further, we compared the forecasting land area with planning value
(Table 6.), according to the national standard of "Code for classification of urban land use and planning standards of development land (GB50137-2011)", considering ChengMai as belonging to the fourth climate zone.
Urban construction land Standard planning area(m2 per person)
Forecasted urban population(person)
Forecasted reasonable area (km2)
Total construction land ≤110.0
337408
≤37.11
Residential 28-38 9.5-12.8
Administration and public service ≥5.5 ≥1.86
Green space and square land ≥10 ≥3.4 Table 6. Forecasted reasonable area of Chengmai planning urban construction land (2020)
3.2 Evaluation of Urban Spatial Planning
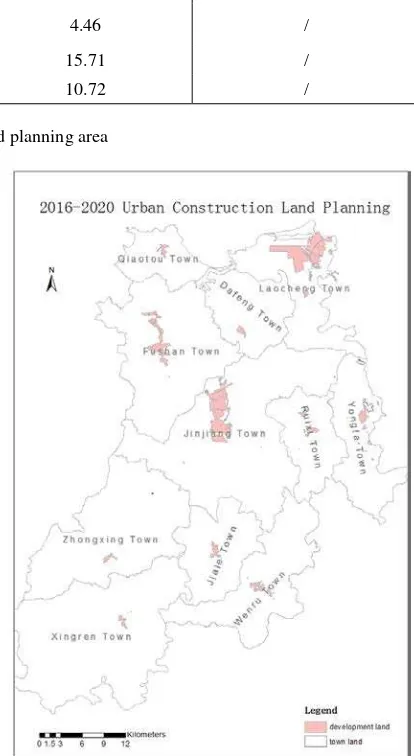
In this study, we accumulated the planning area for all kinds of urban construction land in Chengmai “regulatory detailed planning (2014-2020)” (Figure 3.) and "multiple plans
integration (2016-2020)” (Figure 4.) using GIS statistical methods, and compared these values with the forecasted reasonable area .The results are shown in Table 7.
Urban construction land
Forecasted reasonable area (km2)
Area in regulatory plan (2014-2020)
(km2)
Area in “multiple plans integration” (2016 -2020)
(km2)
Total construction land ≤37.11 78.65 48.95
Residential 9.5-12.8 19.88 /
Administration and public
Service ≥1.86 4.46 /
Road and transportation land ≥4.1 15.71 /
Green space and square land ≥3.4 10.72 /
Table 7. Forecasted area and planning area
Figure 3. Distribution of urban construction in Chengmai
“regulatory detailed planning (2014-2020)”
Figure 4. Distribution of urban construction in Chengmai “multiple plans integration (2016-2020)”
Table 7. shows that in Chengmai land use will grow too fast from 2014 to 2020, especially the total scale of urban construction land and residential land, twice outside the range forecasted. The county government of Chengmai adjusted the overall planning scale of town construction land in 2020 from 78.65km2 to 48.95 km2, decreased by 38%, in the pilot work of Hainan “multiple plans integration (2016)”. But, there is still the problem of expansion in urban construction, when compared with the forecasted scale, indicating the reliance of
reasonable, but still needs to be measured by concretely analyzing the annual tourist population over the past few years.
3.3 Discussion
These research results show that, the level of urbanization in Chengmai maintained a growth trend from 1990 to 2015, even accelerating from 2010 to 2015, and related to increased investment in international tourism on Hainan island. According to the universal laws related to urbanization development, speed of urbanization at Chengmai will slow down along with urbanization rate, crossing the turning point at 50%; At the same time, as urbanization and economics are each other’s essential prerequisites, the speed of development will also be affected by the slowing trend in China's economic growth.
Chengmai must adjust the industrial structure by analyzing various factors affecting the development of urbanization to maintain the current growth rate of urbanization steadily and sustainably. Urbanization must reduce the reliance on industrialization scientifically and reasonably, with steady development in industry, tourism, and tertiary industries. This can be achieved by relying on the endowment of regional resources and comparative advantages of industry, actively seeking diversification from travel, science and technology, internet and service drives. To speed up the development of emerging and high technology industries, the county should make full use of the basic advantages and strategic platform at the Hainan ecological software park and the ecological wisdom new town to expand employment. It must enhance the tensile strength of the rural to urban population shift, develop tourism, business, finance and other service industries to revitalize the market dynamics and strengthen the motive force of urbanization. It must develop tropical high-efficiency agriculture, realize industrialization and modernization, and liberate the agricultural labour force creating conditions for agricultural population transferrals to other industries. The compaction of agricultural development will guarantee balanced urban and rural development, realizing scaled development of small towns, driving the urbanization process of large and medium cities.
Considering urban construction land planning, according to the “national new urbanization plan (2014-2020)”, traditional of urban planning must shift from disordered expansion to reduction and inventory planning. It should advocate a compact urbanization path, with emphasis on intensive development of land to improve the quality of urbanization, avoiding the phenomenon of “reduced” city in the late development phase. In the planning field, the capacity for urbanization development and land demand must be calculated first in terms of a reasonable configuration between urban development and urban population scale. The development capacity must consider construction land and ecological environmental constraints, in combinaton with other constraints, such as food security, to reduce the phenomenon of idle and inefficient utilization of land. This will improve the efficiency of land output, setting up a space for sustainable development, balancing whole town construction with scientific and perfect development planning to realize sustainable development. The direction of urbanization development must be guided by legislative regulations. To date, the Chengmai county government has adopted the above-mentioned suggestions in the “multiple plans integration” program and has appropriately adjusted the total
scale of the construction land, combining plans with tourism development as the core.
4. CONCLUSION
Our research results show that, “population urbanization level forecast - driving factor analysis - urban spatial planning analysis ", is feasible based on an evaluation of urbanization space development. And, has a certain meaning on guidance for rational distribution of urban space, control of the scale of development, for an improved quality of urbanization to promote high-efficiency intensification of urban space. At the same time, there are some problems: the grey GM (1, 1) forecasting model does not have convergence. Longer time series data is needed to enhance the forecasting accuracy, and the forecasting period should not be too long. Future work will address these issues.
ACKNOWLEDGEMENTS
We wish to thank the staff of Chengmai Statistics Bureau for kindly providing the relevant data about national economic and social development and also Urban Planning & Design Institute of Haikou for valuable opinions. The work presented in this study was supported by Grant No.2015BAJ06B01 of National Key Technology Support Program.
REFERENCES
Chen, C., 2008. Research on healthy development of urbanization. Territory& Natural Resources Study, (4),pp.7-9.
Cao, M.X., 2007. Research on grey incidence analysis model and its application. Nanjing University of Aeronautics and Astronautics
Hu, X.D., 2016. Study on urban construction land performance evaluation under new-type urbanization: a case study of Hubei province. China University of Geoscience
Li, L.Y., 2013. Perplexity of inflection point at 50% urbanization Level—A Comparative study on rapid urbanization of typical countries. Urban Planning Forum, 2013(3), pp.43-49
Liu, S.F., 2010. The grey system theory and its application. Science Press, 2010(5)
Lv, Y., 2014. Regional spatial pattern of urbanization, the process and its response. Northwest University
Wu, J., 2013. China's population urbanization rate speculation and statistical methods. The World of Survey and Research, 2013(7), pp.44-47
Zhang, H., 2015. Analysis on coupling development of urbanization and urban land intensive utilization in China [J]. Journal of South China Normal University (Natural Science Edition). 47(3), pp.127-133