Volume 27, Number 3, 2012, 355 – 372
A CROSS-CULTURAL STUDY ON THE VALUE STRUCTURE OF
MOBILE INTERNET USAGE: COMPARISON BETWEEN
INDONESIA AND JAPAN
Ranti YuliaWardani
STIE YKPN, Yogyakarta
([email protected] or [email protected])
Sony Warsono
Faculty of Economics and Business Universitas Gadjah Mada ([email protected])
ABSTRACT
The number of mobile Internet users has been growing rapidly worldwide. Access to the Internet via mobile cellular networks has also grown rapidly. The effects of different culture of mobile Internet would be interesting to be investigated. The research objective is to investigate the usage pattern differences of mobile Internet users in Indonesia and Japan and to interpret them within the framework of a value structure. The data collection technique used in this study was the survey method. The same questionnaire written in mother language of each country was given to respondents in Japan and Indonesia directly. The result shows that value structures (functional value, emotional value, social value, and monetary value) simultaneously affect the satisfaction of mobile Internet usage of Indonesian respondents, which affect the satisfaction of Japanese respondents. Social value did not significantly affect the satisfaction of mobile Internet usage of Japanese respondents. The implications of cross-cultural differences of mobile Internet will be discussed in this paper. This paper will be ended with discussion, conclusion with practical implications and limitations.
Keywords: mobile Internet, cross cultural, m-commerce, Indonesia, Japan
INTRODUCTION
Today Internet has greater influence on the way people communicate, search for in-formation and do their work than anything else in history. During the past years, information and communication technologies (ICTs) have continued to spread throughout the world, with the result that more people now have access to the Internet and its wealth of information and applications (ITU, 2009). Access to the Inter-net via mobile cellular Inter-networks has also grown rapidly with the increasing availability
of IMT- 2000/3G networks and enabled de-vices, including mobile handsets and data cards that allow users to access the Internet over the mobile cellular network using their computers (ITU, 2009). The facts show that the mobile Internet has grown rapidly so that mobile economy (m-economy) is both inevita-ble and imminent (Kalakota & Robinson, 2002).
In recent years, there has been much excite-ment and hype in relation to the promises ep-och of the mobile, handheld epep-och. The bene-fit of using the mobile Internet has urged peo-ple to be connected and access Internet any-time and anywhere. Gareth Hughes, managing director of Psion, states that the mobile Inter-net would empower people with information, communications, transactions, and entertain-ment reviews in their work and personal life (Hughes, 2009).
More and more people will use mobile phones to access Internet. Many forecasters, basing their predictions on the uptake of stan-dard mobile telephones, suggest that in the near future most Internet access will take place using small, wireless devices, providing “any-time, anywhere” access (Buchanan et al. 2001). Businesses in the future will be mobile, integrated, and personal, with the widespread rollout of a wireless infrastructure, and a new wave of consumer and business applications will begin using airwaves for much more than just phone calls (Kalakota & Robinson, 2001).The demand for mobile communica-tions is expected to be large owing to the low entry cost for users of purchasing a mobile phone compared with purchasing a networked PC or interactive, television system. This new market, therefore, is being actively targeted by many companies (Chen, 2001).
By looking at the phenomena, it would be interesting to further investigate the mobile Internet usage pattern in two different cultures. The adoption or usage patterns of the mobile Internet are quite different among different countries (Pedersen, 2001). The adoption of the mobile Internet might be different in dif-ferent countries because of culture differences. That would lead to different usage or adoption patterns of the mobile Internet. People in dif-ferent countries would also have difdif-ferent cultural values regarding the mobile Internet.
In the future, technologies will become more and more advanced. The mobile Internet will also provide us with better and more
ad-vanced services. The mobile Internet providers will be very careful to exercise their strategy in every different country. In order to meet customer satisfaction in a particular culture, the mobile Internet companies should better understand the mobile Internet usage pattern and implement their strategy accordingly. This investigation would give more insight about cross-cultural study in technology, particularly mobile Internet. It would give managerial im-plication regarding to mobile Internet man-agement strategy in different cultures particu-larly in Indonesia and Japan.
The following section will discuss infor-mation from the literature survey; a review of hypotheses and results from previous studies related to culture and value, value structure, and satisfaction regarding mobile Internet and explain the research methodology. This article also provides a data analysis, and statistical procedures and results. The final section will discuss results from the previous two sections and provide discussion, conclusions, limita-tions and research implicalimita-tions.
LITERATURE REVIEW AND HYPOTHESES DEVELOPMENT
This study focuses on values as the core concept of culture for two reasons (Straub et al. 2002). First, value is a concept that is apt to change, which is appropriate to explain the change of behavior (Lee et al. 2002). Value can affect people’s behaviors more than other components of culture that are relatively less sensitive to behavioral changes (Lachman, 1983). Second, different value and attitudes affect the way people behave in their lives (Lee et al. 2002; Hofstede, 1980). The Mobile Internet is used by people in their daily lives which take place in fast-changing societies. These things considered a value-based ap-proach would be appropriated.
struc-ture. Most of the studies about cross-cultural mobile Internet usage patterns have been con-ducted in developed countries such as Japan and Korea. Developed countries are more con-cerned about advanced technology than devel-oping countries. For example, Japan and Ko-rea are the countries that always develop and improve their technology to become more ad-vanced and sophisticated. This study is based on the previous study by Lee et al. (2002) to expand one of their suggestions to another geographical location. There is no cross-cul-tural study on the value structure of the mobile Internet usage between developed and devel-oping countries.
This study is based on the following research questions:
1. Do functional values, emotional values, social values, and monetary values affect mobile Internet service satisfaction in Indonesia and Japan, respectively?
2. Is there any difference in value structures between Indonesia and Japan?
Culture is the belief and values about how a community of people should and do act (Kreitner & Kinicki, 2007). Hofstede defined culture as “the collective programming of the mind which distinguishes the members of one human group from another” (Hofstede, 1980). It is a collective phenomenon because it is at least partly shared with people who live or lived within the same social environment, which is where it was learned. Culture is learned, not inherited. It derives from one's social environment, not from one's genes (Hofstede, 2010). In the definition given by Hofstede, there is a general notion that culture is based on shared values (Straub et al. 2002, Hofstede 1980). The definition of culture by Hofstede is used as a basic definition because his definition is the best known and most ap-plied in previous studies. A value is an endur-ing belief in a mode of conduct or end-state (Kreitner & Kinicki, 2007).
The value structure is an analytic frame-work that consists of various types of values that the mobile Internet provides (Lee et al. 2002). There are some interested various re-searches are related to the value. Based on the previous research on value, value then be-comes recognized as a key tool for not only understanding human behaviors, but also in doing business (Lee et al. 2002).
From the literature reviews and explana-tions above, each of the theories breaks down into some hypotheses that measure the effect of each value structure on satisfaction for each country. In order to explore this more compre-hensively, it would be better to break down the hypotheses that could measure all of the value structures which affect satisfaction simultane-ously for Japan and Indonesia respectively. Hypotheses 1 of this study are as follows:
Hypothesis 1a: Functional Value, Emotional Value, Social Value, Monetary Value simultaneously affect satisfaction for the Japanese respondents.
Hypothesis 1b: Functional Value, Emotional Value, Social Value, Monetary
Value simultaneously affect satisfaction for the Indonesian respondents.
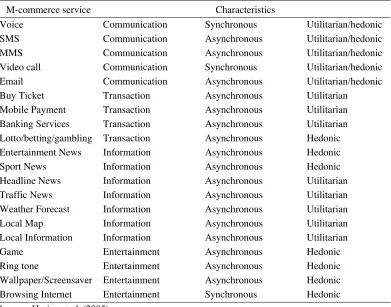
Hariss et al. (2005) classify m-commerce services in order to distinguish more clearly between synchronous and asynchronous ser-vices, hedonic and utilitarian services and in order to isolate specific m-commerce func-tions. The set of twenty m-commerce services used in their research was developed after ex-tensive reviews of providers’ functionality and with reference to the extant m-commerce literature. This classification is shown in Table 1.
Kim et al. (2004) classify m-commerce services as hedonic or utilitarian, and find similarities in patterns of m-commerce usage
Table 1. Classification of m-Commerce Services
M-commerce service Characteristics
Voice Communication Synchronous Utilitarian/hedonic
SMS Communication Asynchronous Utilitarian/hedonic
MMS Communication Asynchronous Utilitarian/hedonic
Video call Communication Synchronous Utilitarian/hedonic
Email Communication Asynchronous Utilitarian/hedonic
Buy Ticket Transaction Asynchronous Utilitarian
Mobile Payment Transaction Asynchronous Utilitarian Banking Services Transaction Asynchronous Utilitarian Lotto/betting/gambling Transaction Asynchronous Hedonic Entertainment News Information Asynchronous Hedonic
Sport News Information Asynchronous Hedonic
Headline News Information Asynchronous Utilitarian Traffic News Information Asynchronous Utilitarian Weather Forecast Information Asynchronous Utilitarian
Local Map Information Asynchronous Utilitarian
Local Information Information Asynchronous Utilitarian
Game Entertainment Asynchronous Hedonic
Ring tone Entertainment Asynchronous Hedonic
between Hong Kong and South Korea, with Japanese m-commerce users exhibiting very different patterns. Hedonic criteria are related to feelings and emotions such as fun, relaxa-tion or pleasure while utilitarian criteria are concerned with quality of workmanship or delivery, fitness for purpose or the ability to perform a specific function (Kim et al. 2004). Kim et al. (2004) study found that Hong Kong and South Korean customers exhibit more hedonic m-commerce usage patterns than their counterparts in Japan.
According to Alexa.com, a web informa-tion company, the Indonesian sites, such as headline news and banking services, are not among the highest ranking sites in August 2009. Information websites which provide headline news, weather forecasts, local news, and local information, such as detiknews.com and kompas.com, are not the highest ranking sites. In Indonesia, the highest rank is on Facebook. Facebook also provides game which is related to entertainment characteristic classified by Hariss et al. 2005. This ranking sites information would indicate that Indone-sian functional value relates less closely to satisfaction.
Japanese users regard functional value to be higher than other values. This seems to be reasonable in that e-mail service is convenient to use anytime, anywhere and Japanese users use Information services more frequently than Indonesian users. Japanese users are most likely to use email services, followed by download services, news and sports (Lee et al. 2002). For the Japanese respondents, func-tional value is closely related to satisfaction (Lee et al. 2002).
The information above distinguishes be-tween hedonic and utilitarian m-commerce usage patterns. The information above shows the m-commerce usage pattern for Indonesian and Japanese users. Indonesian users are re-lated closely to a hedonic usage pattern and Japanese users are related closely to a utilitar-ian usage pattern. This would imply that
Japa-nese functional value relates more closely to higher satisfaction than Indonesian functional value.
Hypothesis 2a: Functional value will posi-tively affect the satisfaction of Japanese respondents.
Hypothesis 2b: Functional value will posi-tively affect satisfaction of In-donesian respondents.
Hypothesis 2c: Functional value will affect more greatly the satisfaction of Japanese respondents than In-donesian respondents.
Indonesian people have high social net-working characteristic (Subagyo, 2009). Some Indonesian people tend to satisfy their needs by interacting with their community, as shown by their high social networking characteristics. Related to this character, we could see how it affects the most frequently used website. The website that is accessed most by Indonesian people is Facebok. Indonesian Facebookers enjoy accessing this website because of their high social networking character. It could be seen in the alexa.com rankings that Facebook ranks the highest in Indonesia. From the clas-sification of m-commerce service in table 2.1 by Hariss et al. (2005), Facebook is not one of the information websites and does not have utilitarian character.
Based on the information provided by Alexa.com, in August 2009 one of the highest ranking sites in Indonesia is Facebook. Face-book is the biggest social networking site in the world. This website could be classified as an entertainment site that could satisfy mental or psychological needs by using the mobile Internet. Entertainment is the action of pro-viding or being provided with amusement or enjoyment (New Oxford American Dictionary, 2007).
purpose or the ability to perform a specific function (Kim et al. 2004). Hedonism is one of the behaviors that particularly happen in de-veloping countries such as Indonesia. This behavior shows the way some people in Indo-nesia react to modernity as a priority value without fully recognizing how this modernity should be treated (Zubair, 1998). They catch modernity as a symbol of the “final result” without understanding the antecedent process of modernity. They own the latest and most advanced devices with high technology as a symbol of modernity, achievement and pres-tige (Zubair, 1998). “Getting/owning” these latest and most advanced devices is more im-portant than understanding the imim-portant function of the devices (Zubair, 1998).
Arambewela et al. (2005) examined the differences in personal values among Asian international postgraduate students from China, India, Indonesia and Thailand studying in Australian universities based on nationality and discussed marketing implications of these differences. Personal values are one way in which insights can be gained of students, par-ticularly with regard to their needs and prefer-ences (Arambewela et al. 2005). Their study results found that Indonesian and Thai stu-dents attached greater importance to values associated with hedonism.
Based on the previous research, emotional value is less related to satisfaction for Japa-nese respondents (Lee et al. 2002). When they compared the average means of significant variables in two countries, the average means of functional value, emotional value, social value and monetary value were higher in Ja-pan than in Korea. Kim et al. (2004) study found that Japanese people tended towards utilitarian usage patterns. The Japanese did not exhibit hedonic criteria of usage patterns of m-commerce that are related to feelings and emotions such as fun, relaxation or pleasure.
Based on the information above Indone-sian people tend to have hedonistic criteria and they also use website services such as
Face-book to fulfill their emotional needs more than Japanese people. Thus, the emotional value would be positively related to satisfaction for both countries. Emotional value would affect more greatly the satisfaction of Indonesian respondents than Japanese respondents.
Hypothesis 3a: Emotional value will positively affect the satisfaction of Japa-nese respondents.
Hypothesis 3b: Emotional value will posi-tively affect the satisfaction of Indonesian respondents.
Hypothesis 3c: Emotional value will affect more greatly the satisfaction of Indonesian respondents than Japanese respondents.
Social value creates a feeling amongst users of the mobile Internet that they could easily connect with each other. Some people use mobile Internet to chat with colleagues or friends by using Yahoo Messenger, or people use the mobile Internet to socially do network via Facebook or Friendster.
peo-ple, Indonesians tend to have high social value.
The information above could be proved by looking at the website preferences of Indone-sian people. According to the Alexa.com, a web information company in August 2009, Facebook was the top-ranking website amongst Indonesian Internet users. Since Facebook is a social networking website that connects people, it is ranked to be the first on Alexa.com as most of the users feel they can easily connect with each other.
On the other hand, Japanese social value did not significantly affect satisfaction (Lee et al. 2002). Matsuda (2005) argues that most young Japanese people are becoming more selective rather than superficial in their social relationships, focusing on friends who they identify closely with. For most heavy users, the keitai (Japanese word which means mobile phone) reinforces ties between close friends and families rather than communal or weaker and more dispersed social ties (Ito, 2005). Matsuda’s (2005) description of “selective sociality” also notes that keitai participates in a similar trend towards intentional contact with intimates at the expense of both given and serendipitous relation. While new com-munication technologies are tied to an expan-sion in the range of partners and means to communicate, most communication gets chan-neled into a narrow and highly selective set of relationships (Ito, 2005). Matsuda (2005) also locates keitai in ecology of personal commu-nications in Japan which has increasingly val-ued the discursive production of intimacy, particularly between family members and couples. These intimate circles of contact are what Ichiyo Habuchi describes as “teleco-cooning”; that is the production of social identities through small, insular social groups (Ito, 2005).
Social value does not seem to affect satis-faction in Japan. This may result from Japa-nese people being characteristically intro-verted. Although the mobile Internet is a
con-venient communication device, Japanese users may not want to use it for socializing with others (Lee et al. 2002).
By comparing Indonesia and Japan, it could be seen that social values affect Indone-sian respondents positively and Japanese re-spondents negatively.
Hypothesis 4a: Social value will negatively affect the satisfaction of Japa-nese respondents.
Hypothesis 4b: Social value will positively affect the satisfaction of Indo-nesian respondents.
Hypothesis 4c: Social value will affect more greatly the satisfaction of In-donesian respondents than Japanese respondents.
Monetary value means how satisfactory mobile Internet services are compared to cost, time or effort spent in using the mobile Inter-net (Sweeney & Soutar, 2001). MoInter-netary value cannot be neglected since users have to pay relatively high usage fee for mobile Inter-net services, while stationary InterInter-net services often can be accessed free of charge (Lee et al. 2002).
Based on information from VivaNews. com (February 2009), in Indonesia up- to-date Internet fees are still expensive. One of the reasons for expensive Internet fees in Indonesia is that Indonesian Internet providers need high investment for their business. Some of the mobile Internet providers provide Internet cost with low price but with very low access speed. So, for the Indonesian people, monetary value would affect less to their satis-faction of using mobile Internet.
maxi-mum charge will be 5,985 yen. However, if the smartphone is connected to a PC or other external device, the maximum charge will be 13,650 yen (NTTDocomo, 2009).
Hypothesis 5a: Monetary value will positively affect the satisfaction of Japa-nese respondents.
Hypothesis 5b: Monetary value will positively affect the satisfaction of Indo-nesian respondents.
Hypothesis 5c: Monetary value will affect more greatly the satisfaction of Japanese respondents than In-donesian respondents.
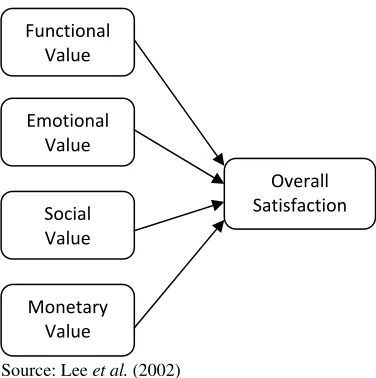
The research model (for Indonesia and Ja-pan, respectively) is established as shown in Graph 2:
Source: Lee et al. (2002)
Figure 1. Research Model
RESEARCH METHOD
Descriptive statistics will be used in this study. Descriptive statistics present quantita-tive descriptions and statistical computations describing either the characteristics of a sam-ple or the relationship among variables in a sample (Babbie, 2004). This technique in-volves measuring the association/causality between two variables (independent and
de-pendent). This technique provides the infor-mation that explains the relationship between values as independent variable and satisfaction of mobile Internet as a dependent variable.
In this study, the unit of analysis is the in-dividual whose characteristics sought to be described. In this case, respondents are people from Indonesia and Japan who have experi-enced in using the mobile Internet. The popu-lation of this research is all people in Indone-sia and Japan who are using mobile Internet. The samples of this study are people who are using mobile Internet in Indonesia and Japan. In this study, non probability samples that are unrestricted are called convenience samples (Cooper & Schindler, 2001). Samples were selected according to convenience sampling. The reason why convenience sampling was used is that researchers have the freedom to choose whomever they find.
Based on the previous research, Lee et al (2002) used 21 independent variable questions that are considered fit with the criteria such as sufficient correlation coefficients and reliabil-ity using Cronbach’s Alpha. The question-naires were written in Japanese language and Indonesian language.
The data collection technique used in this study is the survey method. The questionnaire was given to respondents in Japan and Indone-sia directly. The survey questionnaire con-sisted of four parts: a question for frequently used mobile Internet services, questions re-garding user satisfaction, those for value structures, and the final is the user’s demo-graphic information.
In assessing the degree of measurement error presented in any measure, Hair et al. (2006) stated that the researcher must address two important characteristics of a measure: validity and reliability. Validity is the degree to which a measure accurately represents what it is supposed to. Reliability is the degree to which the observed variables measure the
Functional Value
Emotional Value
Social Value
Monetary Value
“true” value and is “error free”; thus, is the opposite of measurement error.
Multiple regressions are used in this study because there are four independent variables in this study. Multiple regression analysis will be used to identify the relationship between value structures and overall satisfaction in each country. The linear regression analyses will be conducted to identify the relationship between four types of values and satisfaction. Inde-pendent sample T-Test will be used in order to verify how value structures are different be-tween the respondents in two countries.
DATA ANALYSIS
The Indonesian respondents consisted of 30.7% male and 69.3% female. For the Japa-nese respondents; 76.9% were male and 23.1% were female.
The age of the Indonesian respondents were as follows; 1 (0.7%) respondent was un-der 16 years old, 64 (46.7%) respondents were in the age range of 16-20 years old, 46 (33.6%) respondents were in the age range of
21-25 years old, 24 (17.5%) respondents were in the age range of 26-30 years old, and 2 (1.5%) respondents were in the age range of 31-35 years old. The age of the Japanese re-spondents were as follows; 1 (0.7%) respon-dent was under 16 years old, 58 (43.3%) re-spondents were in the age range of 16-20 years old, 60 (44.8%) respondents were in the age range of 21-25 years old, 12 (9%) respondents were in the age range of 26-30 years old, and 3 (2.2%) respondents were in the age range of 31-35 years old.
The education background of the Indone-sian respondents were as follows; 83 (60.6%) had graduated from senior high school and are undergraduate students, 40 (29.2%) respon-dents had graduated from undergraduate stud-ies (S1), 5 (3.6%) had graduated from post graduate studies (S2), 9 (6.6%) respondents were from another education background such as D3 (three-year education program after senior high school) and junior high school for the youngest respondent. The education back-ground of the Japanese respondents were as follows; 81 (60.4%) had graduated from senior
Table 2. Gender, Age, and Education
Gender Indonesia Japan
Male 42 30.7% 103 76.9%
Female 95 69.3% 31 23.1%
Total 137 100% 134 100%
Age
< 16 1 0.7% 1 0.7%
16-20 64 46.7% 58 43.3%
21-25 46 33.6% 60 44.8%
26-30 24 17.5% 12 9.0%
31-35 2 1.5% 3 2.2%
Total 137 100% 134 100%
Education
Senior High School 83 60.6% 81 60.4%
S1 40 29.2% 34 25.4%
S2 5 3.6% 7 5.2%
S3 0 0% 3 2.2%
Others 9 6.6% 9 6.7%
high school and are undergraduate students, 34 (25.4%) respondents had graduated from un-dergraduate studies (S1), 7 (5.2%) respondents had graduated from post graduate studies (S2), 3 (2.2%) respondents have earned a doctoral degree, 9 (6.6%) respondents were from an-other education background such as a profes-sional education program completed after senior high school and junior high school for the youngest respondent.
Validity Test and Reliability Test
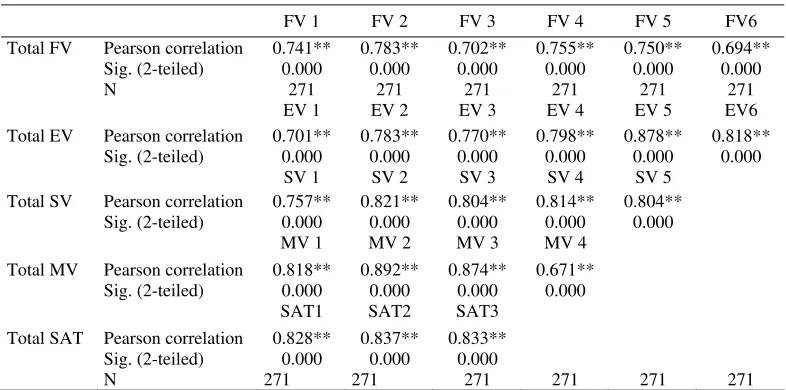
The results of five variables show that cor-relations between each of the indicators with the total construct score show the significant results. It can be concluded that each of the questions regarding all of the indicators are valid.
The reliability results using Cronbach’s Alpha show all variables that would be tested are reliable. The Cronbach’s Alpha shows more than 0.60 until 0.90;this means that all variables are very reliable.
Table 3. Validity
FV 1 FV 2 FV 3 FV 4 FV 5 FV6
Total FV Pearson correlation 0.741** 0.783** 0.702** 0.755** 0.750** 0.694**
Sig. (2-teiled) 0.000 0.000 0.000 0.000 0.000 0.000
N 271 271 271 271 271 271
EV 1 EV 2 EV 3 EV 4 EV 5 EV6
Total EV Pearson correlation 0.701** 0.783** 0.770** 0.798** 0.878** 0.818**
Sig. (2-teiled) 0.000 0.000 0.000 0.000 0.000 0.000
SV 1 SV 2 SV 3 SV 4 SV 5
Total SV Pearson correlation 0.757** 0.821** 0.804** 0.814** 0.804**
Sig. (2-teiled) 0.000 0.000 0.000 0.000 0.000
MV 1 MV 2 MV 3 MV 4
Total MV Pearson correlation 0.818** 0.892** 0.874** 0.671**
Sig. (2-teiled) 0.000 0.000 0.000 0.000
SAT1 SAT2 SAT3 Total SAT Pearson correlation 0.828** 0.837** 0.833**
Sig. (2-teiled) 0.000 0.000 0.000
N 271 271 271 271 271 271
**Correlation is significant level at the 0.01 level (2-Tailed).
Table 4. Reliability
No Value Cronbach’s Alpha
1. Functional Value 0.832
2. Emotional Value 0.881
3. Social Value 0.859
4. Monetary Value 0.830
5. Satisfaction 0.780
Table 5. ANOVA Output
Country F Sig
Japan 15.952 0.000* Indonesia 73.912 0.000*
In table 5, the result for Japan shows that F score is 15.952 and F score for Indonesia is 73.912. P value score is 0.00. Since P value 0.00 < 0.05, this means that regression model with Functional Value, Emotional Value, Social Value, Monetary value as independent variables can be used to predict Satisfaction. Hypothesis 1a and hypothesis 1b are supported.
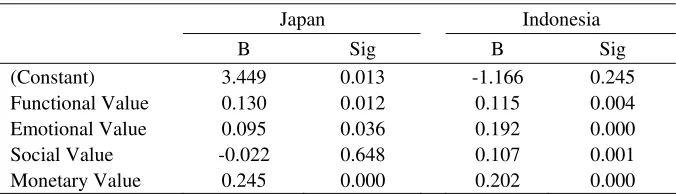
The result showed in significant column in the table 6 will be used to analyze the hy-potheses with 0.05 significant level. There are four independent variables in this regression that will be analyzed partially to test hypothe-ses 2a, 2b, 3a, 3b, 4a, 4b and 5a, 5b for the Japanese and Indonesian respondents as fol-lows:
The result in the Japan significant column of functional value shows that significant value is 0.012, which is less than 0.05. This result supports hypothesis 2a. The result in the Indonesia significant column of functional value shows that significant value is 0.004, which is less than 0.05. This result supports hypothesis 2b.
The result in the Japan significant column of emotional value shows that significant value is 0.036, which is less than 0.05. This result supports hypothesis 3a. The result in the Indonesia significant column of emotional value shows significant value is 0.000, which is less than 0.05. This result supports hypothe-sis 3b.
The result in the Japan significant column of social value shows that significant value is 0.648, which is more than 0.05. The result also shows negative relationship of social value of Japanese respondents. This result aligns with the hypothesis 4a, which stated that social value negatively affects the satisfaction of Japanese respondents, but this result is not significant statistically. The output result in the Indonesia significant column of social value shows that significant value is 0.001, which is less than 0.05. This result supports hypothesis 4b.
The output result in the Japan significant column of monetary value shows that signifi-cant value is 0.000, which is less than 0.05. This result supports hypothesis 5a.The output result in the Indonesia significant column of monetary value shows that significant value is 0.000, which is less than 0.05. This result sup-ports hypothesis 5b.
From the result of regression coefficient, then, it could be put in the regression equation for Japan and Indonesia as follows:
YJP = 3.449 + 0.130X1 + 0.095X2 –
0.022X3 + 0.247X4 (1.1)
YINA = 0.115X1 + 0,192X2 + 0.107X3 +
0.202X4 (1.2)
T-test sample was used in order to test how value structure is different between re-spondents in both countries.
Table 6. Japan and Indonesia Regression Coefficient
Japan Indonesia
B Sig B Sig
(Constant) 3.449 0.013 -1.166 0.245
Functional Value 0.130 0.012 0.115 0.004
Emotional Value 0.095 0.036 0.192 0.000
Social Value -0.022 0.648 0.107 0.001
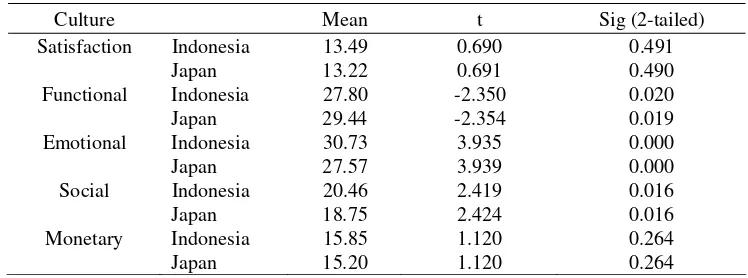
Table 7. T-Test and Independent Sample T-Test
Culture Mean t Sig (2-tailed)
Satisfaction Indonesia 13.49 0.690 0.491
Japan 13.22 0.691 0.490
Functional Indonesia 27.80 -2.350 0.020
Japan 29.44 -2.354 0.019
Emotional Indonesia 30.73 3.935 0.000
Japan 27.57 3.939 0.000
Social Indonesia 20.46 2.419 0.016
Japan 18.75 2.424 0.016
Monetary Indonesia 15.85 1.120 0.264
Japan 15.20 1.120 0.264
Hypothesis 2c: Functional value will af-fect more greatly the satisfaction of Japanese respondents than Indonesian respondents. The result on functional value in table 7 shows that the t value is -2.350 and the P value is 0.020 < 0.05. This means that there is mean difference between Japanese respondents and Indonesian respondents. From the result, it could be con-cluded that functional value average mean of Japanese is higher than functional average mean of Indonesian. Thus, the hypothesis 2c statistically is supported.
Hypothesis 3c: Emotional value will affect more greatly the satisfaction of Indonesian respondents than Japanese respondents. The emotional value shows that the t value is 3.935 and the P value is 0.000 < 0.05. This means that there is mean difference between Japanese respondents and Indonesian respondents. The result shows that emotional value average mean of Indonesian is higher than emotional value average mean of Japan. Thus, the hy-pothesis 3c statistically is supported.
Hypothesis 4c: Social value will affect more greatly the satisfaction of Indonesian respondents than Japanese respondents. The social value shows that the t value is 2.419 and the P value is 0.016 < 0.05. This means that there is mean difference between Japanese respondents and Indonesian respondents. The result shows that social value average mean of Indonesian is higher than social value average
mean of Japan. Thus, the hypothesis 4c statis-tically is supported.
Hypothesis 5c: Monetary value will affect more greatly the satisfaction of Japanese re-spondents than Indonesian rere-spondents. The monetary value shows that the t value is 1.120 and the P value is 0.264 > 0.05. This means that there is no mean difference between Japa-nese respondents and Indonesian respondents. Thus, the hypothesis 5c statistically is not sup-ported.
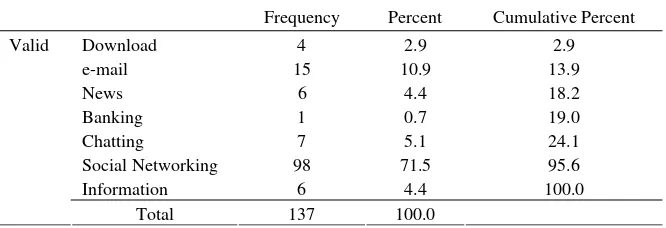
Respondents were asked to check which mobile Internet services they currently use to find out preferred mobile Internet services in each country. The result is as summarized in table 8 for Japanese respondents and in table 9 for Indonesian respondents.
DISCUSSION, CONCLUSION, AND LIMITATION
Table 8. Frequently Used Services by Japanese Respondents
Frequency Percent Cumulative Percent
Valid Download 16 11.9 11.9
Game 7 5.2 17.2
e-mail 85 63.4 80.6
Location 2 1.5 82.1
Weather 5 3.7 85.8
News 7 5.2 91.0
Shopping 1 0.7 91.8
Social Networking 8 6.0 97.8
Information 1 0.7 98.5
Others 2 1.5 100.0
Total 134 100.0
Table 9. Frequently Used Services By Indonesian Respondents
Frequency Percent Cumulative Percent
Valid Download 4 2.9 2.9
e-mail 15 10.9 13.9
News 6 4.4 18.2
Banking 1 0.7 19.0
Chatting 7 5.1 24.1
Social Networking 98 71.5 95.6
Information 6 4.4 100.0
Total 137 100.0
Indonesian respondents perceived func-tional value of mobile Internet usage. Emo-tional value is one of the values that could satisfy Indonesian respondents with the mobile Internet usage. Related to social value for In-donesian respondents, they get the benefit of mobile Internet usage when they can feel that they are connected to others by using mobile Internet easily. The results indicate that Indo-nesian respondents perceived monetary value by using mobile Internet.
The results proved that the average mean of functional value of Japanese is higher than Indonesian average mean. It aligns with the Lee et al. (2002) research result, which stated that Japanese users regard the functional value higher than other values and functional value closely related to satisfaction. This result is
aligned with Kim et al (2004) study that found Japanese tended to have utilitarian patterns.
The independent sample t-test shows that there is no mean difference between Japanese respondents and Indonesian respondent. The hypothesis 5c is statistically not supported. This case indicates that Japanese respondents and Indonesian respondents perceived that using mobile Internet usage at the same per-spective regarding to monetary value.
To analyze the usage patterns from a cross-cultural perspective, this study proposed a framework of the value structure that com-posed of four dimensions of value. This study also focused on identifying differences in value structures across two countries. It is be-lieved that a value-based approach allowed us to gain insights into the cultural differences that affect usage of the mobile Internet. There are two research questions to be discussed as follows:
1. Do functional value, emotional value, social value, and monetary value affect mobile Internet services satisfaction in Indonesia and Japan, respectively?
The result shows that functional value, emotional value, social value, and monetary value simultaneously affect satisfaction of Indonesian respondents. The functional value, emotional value and monetary value simulta-neously affect satisfaction of Japanese respon-dents. However, social value does not signifi-cantly affect satisfaction of mobile Internet usage of Japanese respondents.
The Japanese social values have a nega-tive correlation, it does not significantly affect on satisfaction when they tested this variable with other variables simultaneously. This point of view indicates that Japanese respondents may not want to use mobile Internet for so-cializing each other. This indicator aligns with the previous research results from Lee et al. (2002), which stated that social value does not significantly affect satisfaction for the Japa-nese respondents.
The social value average mean score for Indonesian is higher than Japanese average mean score. This results support Subagyo’s (2009) statement that Indonesian people are the people with high social networking char-acteristic. While new technologies are tied to an expansion in the range of partners and means to communicate, most communication gets channeled into a narrow and highly selec-tive set of relationship for Japanese (Ito, 2005).
From these results, it can be concluded that different people have different aims in using the mobile Internet. Their aims in using mobile Internet are influenced by their own culture. Japan and Indonesia have the similar-ity regarding to functional value, emotional value, and monetary value because each of these three values significantly affects the sat-isfaction of mobile Internet usage but not for social value. The reason is because of the dif-ferent culture of Indonesia and Japan regard-ing to the important of social value. Hofstede (1980) defined culture as, “the collective pro-gramming of the mind which distinguishes the members of one human group from another.”
2. Is there any difference in value struc-tures between Indonesia and Japan?
From the data analysis, it could be con-cluded that value structures for the functional value, emotional value and social value are significantly different between Indonesia and Japan. The most frequently used mobile Inter-net services among Indonesian and Japanese users are different.
Japanese functional value is more likely to affect satisfaction and Indonesian social value is a high influential effect on satisfaction. Japanese respondents are exhibiting more utilitarian in pattern of mobile Internet usage. On the other hand Indonesian respondents are exhibiting more hedonic in pattern of mobile Internet usage. It can be explained from the result that shows Indonesian emotional value is significantly higher than Japanese emotional value. The emotional value is one of the indi-cators that people tend to use mobile Internet to fulfill their emotional need by accessing preferred website. Hedonic criteria are related to feelings and emotions such as fun, relaxa-tion, or pleasure. This means that Indonesian respondents perceived mobile Internet to ful-fill their emotional need, which is higher than other values.
Social value does not seem to affect satis-faction in Japan. This result aligns with Matusda (2005) statement. Matsuda (2005) stated that most Japanese people are becoming more selective rather than superficial in their social relationships, focusing on friends who they identify closely with. The result also sup-ports previous argument by Lee et al (2004) although mobile Internet is a convenient communication device; Japanese users may not want to use it for socializing with others. On the other hand, Indonesian mobile Internet users tend to use mobile Internet to socialize with each other.
The frequently used services of Indone-sian respondents also show that 71.5% use social networking website services. It indicates that Indonesian people tend to have active connections among people: the trust, mutual understanding, and shared values and behav-iors that bind the members of human networks and communities and make cooperative ac-tions (Cohen & Prusak, 2001).
It could be concluded that the different us-age pattern of mobile Internet could be af-fected by culture. The culture in this research is represented from the values, as a culture is
the belief and values about how a community of people should and do act (Kreitner & Kinicki, 2007).
The results of this study give contribution to managerial level about the cross- cultural knowledge in mobile Internet usage pattern particularly in Indonesia and Japan. By under-standing about their market culture and be-havior regarding to mobile Internet usage, they could execute a good strategy to win the com-petition among their competitor.
Global company players of mobile Inter-net providers should consider their strategic in order to meet the customer’s expectation in different country with different culture. Global companies, themselves, do not merely satisfy with the global perspective by their own im-age, but they also should consider the global competitive advantage in order to win the competition. From the combination of this study’s results and adaptation of local strate-gies for mobile Internet companies as global players, it is hoped that they could assess themselves how they would play their strategic in the global market and penetrate in every different local market.
This study represents some limitations as follows. First, although this study verified value structures that are different between two countries, different value structure may not be the only reason for different usage patterns. Different usage pattern also might be caused from demographic, mobile Internet infra-structure, and mobile Internet services pro-vider itself.
dif-ferences, it would be better to use discriminant analysis in the research method to reduce wider alpha 0.5 percent. Fourth, the result im-plies that frequently used mobile Internet ser-vices are affected by culture. This implies that since mobile Internet users are influenced by various factors, personalized mobile services may be preferred. Therefore, identifying criti-cal factors that highly affect usage behaviors is needed such as cultural factors, demographic or socio-economics.
REFERENCES
Afuah, A. and C.L Tucci, 2003. Internet Busi-ness Models and Strategies. New York: McGraw-Hill.
Apple Inc., 2007. “New Oxford American Dictionary 2.0.2.” [Computer Software]. Available at http://www.apple.com. Arambewela, R., J. Hall, A.M. Hede, 2005.
“Personal Values Of International Postgraduate Students From Asia: A Cross Cultural Study”. ANZMAC, Conference: Marketing Education.
Babbie, E, 2004. The Practice of Social Re-search, US: Thomson.
Bolton, R.N. and J.H. Drew, 1991. “A Multi-stage Model of Customers’ Assessments of Service Quality and Value”. Journal of Consumer Research, 17, 375-384.
Buchanan, G., S. Farrant, M. Jones, 2001. “Improving Mobile Internet Usability”. WWW10, Hong Kong, China.
Budde, P., 2009. Indonesia-Telecoms, Mobile, Broadband, and Forecasts. Australia: Communication Pty Ltd..
Budi, T.P., 2006. SPSS 13.0 Terapan; Riset Statistik Parametrik [Applied SPSS 13.0; Parametric Statistic Research], 1st ed. Yogyakarta: Andi Offset.
Chen, S., 2001.Strategic Management of e-Business. England: John Wiley and Sons, LTD.
CIA (Central Intelligence Agency). “The World Fact Book”. Available at https://
www.cia.gov/library/publications/the-world-factbook/geos/ja.html. Accessed at September 2, 2009.
Cohen, D. and L. Prusak, 2001. In Good Com-pany. Boston: Harvard Business School Press.
Cooper, D.R., and P.S. Schindler, 2001. Busi-ness Research Methods, 7th eds. New York: McGrawHill.
Fitzpatrick, M., 2007. “Why Mobile Japan Leads the World”. The Guardian. Avail-able at http://www.guardian.co.uk/ technology/2007/sep/27/
guardianweeklytechnologysection.mobile phones. Accessed at September 2, 2009. Ghozali, I., 2006. Aplikasi Analisis
Multivari-ate Dengan Program SPSS [Application of Multivariate Analysis Using SPSS Pro-gram], 4th eds. Semarang: UNDIP. Gupta, A. K., and V .Govindarajan, 2001.
“Converting Global Presence into Global Competitive Advantage”. Acaderny of Management Executive, 15(2), 45-58. Hair, J.F., W.C. Black, B.J. Babin, R.E.
Anderson, R.L. Tatham, 2006. Multivari-ate Data Analysis,6th eds. New Jersey: Pearson Prentice Hall.
Hari, S., 2009. “Menkominfo: Tarif Internet Pasti Turun 2009 [Ministry of Communi-cation and Information: Internet Tariff Shall Down in 2009]”. Available at http://bisnis.vivanews.com/news/read/317 05-menkominfo__tarif_internet_pasti_ turun_2009. Accessed at September 2, 2009.
Harris, P., R. Rettie, and E. Cheung, 2005. “Adoption and Usage of M-Commerce: A Cross-Cultural Comparison of Hongkong and United Kingdom”. Journal of Elec-tronic Commerce Research, 6 (3), 210-224.
Hofstede, G., 1980. Culture’s Consequences: International Differences in Work-Related Values. CA: Sage.
Hofstede, G., G. J. Hofstede, and M. Minkov, 2010.Cultures and Organizations: Soft-ware of the Mind (Rev. 3rd ed.). New York: McGraw-Hill.
Ibrahim, A., D. Zaidah, and D. Ibrahim, 2006. “Significance of Cross Cultural Back-ground on Internet Usage among Univer-sity Students”. Unitar e-Journal, 2 (2), 11-21.
Ito, M., O. Daisuke, and M. Matsuda, 2005. Personal, Portable, Pedestrian: Mobile Phones in Japanese Life. Cambridge: MIT Press.
ITU (International Telecommunication Un-ion), 2009. Measuring the Information So-ciety: The ICT Development Index. Swit-zerland : Geneva.
Jhangiani, Ira, 2006. A Cross-Cultural Com-parison of Cell Phone Interface Design Preferences from the Perspective of Na-tionality and Disability. Virginia: Blacks-burg.
Johnson, M.D. and C. Fornell, 1991. "A Framework for Comparing Customer Sat-isfaction Across Individuals and Product Categories". Journal of economic psy-chology,12, 267-286.
Kalakota, R. and M. Robinson, 2001. E-Busi-ness 2.0 Road Map for Success. Massa-chusetts: Addison-Wesley.
Kalakota, R. and M. Robinson, 2002. M-Busi-ness: The Race to Mobility. New York: R. Donnelley and Sons Company, McGraw-Hill Companies Inc.
Kim, J., I. Lee, Y. Lee, and B. Choi, 2004. "Exploring E-business Implications of the Mobile Internet: A Cross-national Survey of Hong Kong, Japan and Korea". International Journal of Mobile Com-munication, 2 (1), 1-21.
Kreitner, R and A. Kinicki, 2007. Organiza-tional Behavior. New York: McGraw-Hill.
Lachman, R., 1983. “Modernity Change of Core and Peripheral Values of Factory Workers”. Human Relations, 36, 563-580. Lee, Y., J. Kim, I. Lee, and H. Kim, 2002. "A
Cross-cultural Study on the Value Struc-ture of Mobile Internet Usage: Compari-son between Korea and Japan". Journal of Electronic Commerce Research, 3 (4), 1-21.
Matsuda, M., 2005. "Mobile Communications and Selective Sociality" in Ito, M., Per-sonal, Portable, Pedestrian: Mobile Phones in Japanese Life. Cambridge: MIT Press.
Miniwatts Marketing Group, 2009. “Asia Mar-keting Research, Internet Usage, Popula-tion Statistics and InformaPopula-tion”. Internet World Stats.
Mulder, N., 2000. Indonesian Images, the Culture of the Public World. Yogyakarta: Kanisius Publishing House.
NTTDocomo, 2009. “DOCOMO to Add Ser-vice Option for Flat-rate Data SerSer-vice- Maximum charge reduced for use at selected access points”. Available at http://www.nttdocomo.com/pr/2009/0014 58.html, accessed at November 8, 2009. Oliver, R. L.,1981. "Measurement and
Evaluation of Satisfaction Processes in Retail Settings". Journal of Retailing, 57 (Fall), 25-48.
Pedersen, P.E., 2001. “An Adoption Frame-work for Mobile Commerce”. 1st IFIP Conference of E-Commerce, Minitrack on Mobile Commerce, Switzerland.
Sellen, A.J., and R. Murphy, 2002. The Future of the Mobile Internet: Lesson from look-ing at Web Use. CA: Hewlett-Packard Company.
Pub-lishing.
Straub, D., W. Loch, R. Aristo, E. Karahanna, and M. Strite, 2002. “Toward a Theory-Based Measurement of Culture”. Journal of Global Information Management, 10 (1), 13-23.
Subagyo, Y., 2009. Pemberdayaan Masyara-kat Melalui POSDAYA Untuk Mengatasi Krisis Sosial [Society Empowerment Through ‘POSDAYA’ to Overcome So-cial Crisis]. Jakarta: Himpunan Pandu dan Pramuka Wreda.
Sweeney, J.C. and G. N. Soutar, 2001. “Con-sumer Perceived Value: The Development of a Multiple Item Scale”. Journal of Re-tailing, 77, 203-220.
Telecomworldwire, 2009. "The ARC Group Expects a Rise in Mobile Services Reve-nue to 2008- Brief Article”. Available at http://findarticles.com/p/articles/mi_m0E CZ/is_2004_Jan_15/ai_112215143/. Ac-cessed at July 19, 2009.
Tsuja, P.M.Y., and M. Matsumoto, 2003. Les-sons Learned from the Adoption of Mobile Internet Services in Japan. Giti: Waseda University.
Wijaya, T., 2009. Analisis Data Penelitian Menggunakan SPSS [Analysis of Re-search Data using SPSS]. Yogyakarta: UniversitasAtma Jaya.
Williams, M., 2006. “More Mobile Internet Users than Wired in Japan”. Available at http://www.infoworld.com/d/networking/ more-mobile-internet-users-wired-in-japan-259, accessed at November 8, 2009. Zubair, A. C., 1998. “Tinjauan Moral dan
Kultural Terhadap Hedonisme di Kalang-an Generasi Muda [Moral Kalang-and Cultural Review of Hedonism in Young Genera-tion]”. Available at http://filsafat.ugm.ac. id/downloads/artikel/hedonisme.pdf. Accessed at November 8, 2009.