Natural and human impact on the land use and soil properties
of the Sikkim Himalayas piedmont in India
P. Prokop
*, D. P
1
oskonka
Department of Geoenvironmental Research, Institute of Geography and Spatial Organization, Polish Academy of Sciences, Jana 22, 31-018 Krakow, Poland
a r t i c l e
i n f o
Article history:
Received 4 December 2012 Received in revised form 6 December 2013 Accepted 22 January 2014 Available online 20 February 2014
Keywords: Deforestation Land degradation Fluvial activity Tea plantation
a b s t r a c t
Natural and human causes of change in land use and soil properties were studied in the Sikkim Hima-layas piedmont over the last 150 years, with a special emphasis on the period 1930e2010. Analysis of historical reports, combined with the visual interpretation of topographic maps and satellite images, indicates that the land reforms related to the location of tea gardens caused rapid deforestation of the higher elevated terraces in the late 19th century. Continuous population growth between 1930 and 2010 caused a shift in the major land use changes from the terraces to thefloodplains. As a consequence, a gradual extension of tea plantation and forestry development helped in stabilizing the land use of the terraces, while the parallel deforestation of mountain catchments andfloodplains for rice cultivation intensifiedfluvial activity. The enlargement of river-channel area by about 42% between 1930 and 2010 excluded a large part of thefloodplains from cultivation and increased risk of soil degradation. The replacement of natural forest by monocultural tea and rice cultivation influenced the physical and chemical properties of the soil. Statistically significant changes were observed only in some chemical properties of the topsoil. Tea cultivation reduced the total carbon content by 26% and total nitrogen content by 33% in the surface soil horizon. The influence of rice tillage on the soil properties is masked by thefluvial activity. The combined effect offlooding and rice cultivation is reflected in the lower content of total carbon and nitrogen in the surface of the soil, namely, 76% and 77% respectively. Taking into account the long-term nature of the plantation, the soil still has the capability to support tea production. The productivity of rice depends partly on fertilization levels and partly on the natural deposition of fresh sediment eroded from mountains.
Ó2014 Elsevier Ltd. All rights reserved.
1. Introduction
The humaneenvironment interactions are characterized by great diversity, with much feeding back, and many nonlinear pro-cesses, thresholds and time lags (Rudel et al., 2005; DeFries, 2008; Lambin and Meyfroidt, 2010; An, 2012). Human impacts are most frequently related to changing patterns of land use and are of special importance in environmental studies (Dale et al., 1998; Geist and Lambin, 2002; Carr et al., 2006). While landforms and soils are subject to formation, change and even destruction by natural forces over a geological time scale, land use and land cover (LULC) changes resulting from human activity usually occur more rapidly and have a strong impact on vegetation, water resources and soil (Lambin et al., 2003; Vanacker et al., 2003; Geist and Lambin, 2006; Davidar et al., 2010). On a smaller scale, there is a wide variety of humaneenvironment relationships, with different
patterns across regions and nations. The densely settled piedmont zones of young mountains constitute an example of areas where human activity is superimposed on changes induced by natural forces (Tiwari, 2000; Liebault and Piegay, 2002; Starkel et al., 2008). The tectonically active Sikkim Himalayas, with lithology which is prone to mass movement, receive the highest annual rainfall along the whole Himalayan front (Starkel, 1972; Dhar and Nandargi, 2000; Soja and Starkel, 2007). Their piedmont, as a transitional zone down to the lowland plains, is under the strong influence of the adjacent mountains. The nature and extent of the Himalayas impact on their piedmont is largely a product of adjustments in
fluxes of water and sediment (Starkel and Basu, 2000; Grujic et al., 2006; Ghosh and Carranza, 2010). Both are frequently accelerated by various forms of human activity such as agriculture, logging, mineral extraction or road building at the mountain margin (Froehlich and Starkel, 1993; Tiwari, 2000). Increasedfluvial sedi-ment transport increases the flood risk, river bank erosion and shifting of their braided courses, leading to direct changes in the LULC system of the piedmont (Froehlich and Walling, 2007; Sarkar,
*Corresponding author. Tel./fax:þ48 124224085. E-mail address:[email protected](P. Prokop).
Contents lists available atScienceDirect
Journal of Environmental Management
j o u r n a l h o m e p a g e : w w w . e l s e v i e r . c o m / l o c a t e / j e n v m a n
2008; Starkel et al., 2008). Therefore piedmont of the Sikkim Himalayas creates specific environmental conditions either favourable or restrictive for certain forms of human activity.
The present-day economy of the piedmont depends mainly on tea estates established in the late 19th century (Ray, 2002). Culti-vation of other crops (e.g. rice, millet, areca nut) is largely for local consumption. A significant part of the piedmont area constitutes reserved forest, national parks and wildlife sanctuaries. Forestry based on commercially valuable trees and tourism is an important contributor to the economy, as well as being an employer of large numbers of people (Government of West Bengal, 2008e2009;
Madhusudan, 2011).
The presented paper attempts to determine the relative importance of human activity as compared to natural processes in the transformation of the environment of the Sikkim Himalayas’
piedmont over the last 150 years, with special emphasis on the period 1930e2010. The natural and human impact is analyzed by looking at land use change, and quantifying these changes by comparing the soil properties under the mononocultural cultiva-tion of tea and rice against the properties of the natural forest soil.
2. The study area
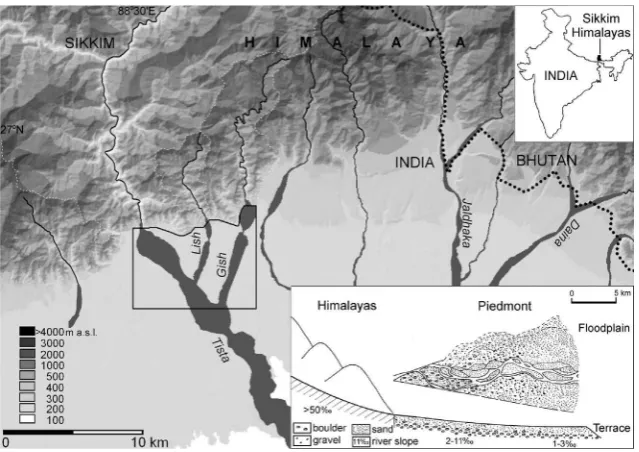
The study area is located in the piedmont of the Sikkim Himalayas in the Jalpaiguri District of the West Bengal State in India (Fig. 1). A hydrologic and geomorphic approach was employed to delineate 176.6 km2at the outlet of the Tista River from the Himalayas. The area represents a system of Quaternary fans decreasing in elevation from 200e300 m a.s.l. at the base of the mountain to about 100 m a.s.l. over a distance of 15 km (Nakata, 1972; Chakraborty and Ghosh, 2010). The fan surface, fragmented by the wide braided channels of the Tista and its tributaries, creates two major landforms, terrace and floodplain, occupying an area of 93.3 km2(53%) and 83.3 km2(47%) respec-tively. The relative height of the terrace surface increases above the present river bed, from 6e10 m at the front of the mountain to 25e30 m downstream.
The climate is subtropical monsoonal, with the warm rainy season spanning from June to October and the dry cooler season
from November to May. The mean annual air temperature reaches 23C, and
fluctuates between 16C in winter (January) and 28C in summer (August). The frontal zone of the mountains and piedmont receives about 4000e6000 mm rainfall annually, more than 80% of which falls during the summer monsoon. During this period, 10e15 days of rainfall, of up to 100 mm per day, is observed every year (Soja and Starkel, 2007; Bookhagen, 2010).
The Tista river drainage area of 8640 km2covers the whole of the Sikkim Himalayas. In the piedmont, it receives water from the Lish and Gish, draining 51 km2 and 157 km2 respectively of the Himalayan margin. Every year, at the mountain’s edge, the Tista discharge may reach 3000e5000 m3s 1. The peak discharge in the devastatingflood of 1968 was calculated at 18,745 m3s 1, about 45 km downstream of the mountain (Murray and Bochin, 1973). The 1952 records show a maximum discharge of 255 m3s 1for the Lish and 630 m3 s 1 for the Gish (Dutt, 1966). Several days of continuous rainfall cause regionalfloods every 20e30 years, while the high frequency of severe hourly rainfall causes flash floods almost every year (Starkel and Basu, 2000; Sarkar, 2008). During such events, the water level rises in the river channels up to 5e6 m and a heavy sediment load is deposited on thefloodplains (Dhar and Nandargi, 2000). In the past three decades, the river beds along the margins of the Himalayas have experienced aggradations of about 6 cm year 1in the case of the larger trans-Himalayan Tista, and between 9e14 cm year 1in the case of the smaller Lish and Gish (Sarkar, 2008). Thick alluvial cover creates good conditions for water infiltration and during the winter season the braided chan-nels are totally dry.
Soils from relatively stable terraces and active floodplains revealed two distinct stages of pedogenic development, A-(Bw)-C and A-C, with the dominant soil classified as Inceptisols (Dystru-depts) and Entisols (Fluvaquents and Endoaquents) respectively (Soil Survey Staff, 2010). Good drainage conditions of Inceptisols result in rapid leaching and enhancement of the weathering pro-cess, giving rise to a humus horizon, thereby lowering the pH (4e5) and development structural Bw (Cambic) horizon. The Entisols of active floodplains, imperfectly drained, without any diagnostic horizon except ochric epipedon, show little alteration of the orig-inal deposits and higher pH (5e7), because they receive new
Fig. 1.Location of the study area in part of the Sikkim Himalaya and piedmont, with a schematic longitudinal profile. White dashed lines indicate watershed divides, a black dotted
sediments faster than the assimilation of previous material into the genetic horizons (NBSS and LUP, 1991).
The terrace area is currently covered with natural tropical moist deciduous Sal (Shorea robusta) forest and tea plantations (Champion and Seth, 1968). Thefloodplains are occupied by wide braided river channels and rice cultivation. About 56% of the total population (56,000 inhabitants) of the area lives in nine tea gar-dens, whilst the remainder of the population is settled along the main road and railway in the Himalayan foothills (Government of India (2011)).
3. Material and methods
3.1. Database development
Historical reports and maps from the colonial British adminis-tration were used as the sources of information concerning the LULC and population trends of the Himalayan piedmont in the 19th andfirst three decades of the 20th century. The changes in LULC were derived from the Survey of India topographic maps at a scale of 1:63,360 for the year 1930, panchromatic photo images acquired by the American Corona satellite for the year 1970, and satellite images downloaded from Google Earth Pro for the year 2010. Maps and satellite images were supported by tea garden plans/cadastral maps at scales of 1:3,960 for various years between 1930 and 2000. These cadastral maps are renowned for being reliable, detailed and useful for land use and soil studies (Ghosh et al., 2004; Sarkar et al., 2006). Geometric corrections were performed to rectify all the maps and images using the UTM-45N projection system. A visual interpretation technique, combined with several field surveys conducted between 2007e2011, was used for LULC mapping. The applied method of interpretation is superior to automatic classifi -cation when the research output needs to be compared with map data in a study concerned with detecting change (Petit and Lambin, 2002; Pelorosso et al., 2009). In addition, visual interpretation al-lows the delimiting of realistic objects, such as patches with irregular shapes, which can represent important contrasts in ecological structure or process in the landscape. Thus, visual interpretation integrates environmental knowledge into image analysis making the results more environmentally meaningful (Jensen, 2007; Shao and Wu, 2008; Hersperger and Bürgi, 2009). In order to standardize the values of maps from three different time periods, seven consistent LULC categories were defined: forest, grassland, tea plantation, rice cultivation, other crop, built-up area and river channel. Logical rules in GIS were used for determination where areas had the same land use class in each time period (sta-ble), locations where there had been one point of change between two land use classes on either sides of that area of change (step-ped), areas where frequent change has occurred between two categories (cycle); and where there was a high turnover between many different classes (dynamic).
Soil data, based on the USDA soil classification system, were digitized from a 1:250,000 scale soil map developed by the Na-tional Bureau of Soil Survey and Land Use Planning (NBSS and LUP, 1991).
3.2. Soil sampling and analysis
The soil sampling scheme was based on the assumption that soil differentiation between two main landforms, terrace andfl ood-plain, depends on long-term natural soil forming factors (NBSS and LUP, 1991). Subsequently, within these two main landforms, the sources of soil variability were the LULC changes. The sampling sites were therefore located in areas of“stable”LULC (delimited on a land use stability map prepared earlier), ensuring the same land
use (forest, tea and rice) during the period 1930e2010. Within stable LULC areas of terrace, samples were taken close to the mountain margin, in the middle and in the lower part of the alluvial fan. Within stable LULC areas of floodplain, samples were taken using the same scheme but also at different distances from the main rivers, in order to take into account sediment heterogeneity. Soils under built up areas, grassland and other crops were not examined in detail because of their low contribution in the study area and the high dynamic of these land use changes during the investigated period.
Twenty soil profiles were analysed from the major landforms: terrace with natural forest and tea plantations as well asfloodplain with natural forest and rice cultivation. The natural forests served as a control against which changes in soil properties were compared. Significant differences between the means of soil properties were identified using thet-statistics, with a level of probability of 5%.
Physical (grain size composition, bulk density, compression strength) and chemical (organic matter (OM), carbon (C), nitrogen (N), sulphur (S), pH) soil properties were analysed. The rationale for the selection of soil quality indicators was the detection of long-term cultivation impact on soil properties (Larson and Pierce, 1991; Panwar et al., 2011). Also important was the possibility of comparison of the soil properties changed due to cultivation with the soil properties under tea- and rice-based agricultural systems in other regions of India and Southeast Asia. The grain size composi-tion of each sample was determined using the combined sieving method and a Fritsch laser particle sizer Analysette 22, after pre-treatment with H2O and ultrasonic disaggregation. Soil bulk den-sity was calculated by drying the soil ring samples (100 cm3) at 105C before weighing them. Soil compression strength (attrib-utable to soil compaction) was measured by using a base surface cone penetrometer, and the readings of ten random repeated penetrations were averaged. The concentration of soil organic matter (OM) was determined using the wet digestion method (Walkley and Black, 1934). Total C, N and S were determined for the A soil horizon (topsoil) by combustion in a CHNS vario EL III Element Analyzer. The pH values in H2O and KCl were measured electrometrically in a 1:2.5 soil/water and a soil/KCl suspension, respectively. The colour of the soil was determined according to the Munsell system.
4. Results
4.1. Land use changes
4.1.1. General tendencies in LULC changes up to 1930
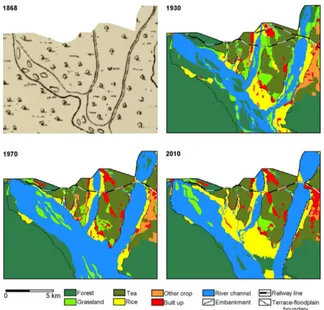
The LULC of the Sikkim Himalayas piedmont, before being ceded by Bhutan to the British East India Company in 1864, was charac-terized by large tracts of forest intersected by numerous rivers with
floodplains overgrown by scattered trees and reed jungle (O’Donel et al., 1864e68; Hunter, 1876,Fig. 2). Owing to the difficulty of pro-curing water in the dry winters, the area was only seasonally settled and population density did not exceed 5e10 inhabitants km 2 (Government of Bengal, 1872). Environmental conditions in this sparsely populated area led to the piedmont initially being catego-rized as wasteland by the Government of Bengal.
142, covering an area of the Sikkim and adjacent Bhutan Himalayan piedmont of approximately 483 km2(The Indian Tea Association, 1930). The development of plantations induced a growing de-mand for a workforce and the migration of labourers towards the extensive tracts of cultivable land east of the Tista (Allen et al., 1906). As a result, the population density in the piedmont zone had reached 60 inhabitants km 2by 1931 (Government of Bengal, 1931). The migration of people also initiated the replacement of
floodplain forest by rice cultivation to support their growing food needs. The formation of the LULC framework wasfinished when the 1865 Forest Act, provided the legal instrument for registering forest as“reserved”by the Forest Department. The‘reservation’process started from several tracts of natural forest with a total area of 460 km2, and continued during the period of independence (Banarjee et al., 2010).
4.1.2. LULC changes between 1930 and 2010
The majority of the area (74.4% in the period 1930e1970 and 77.0% in the period 1970e2010) was not subject to any change
(Fig. 2,Tables 1and2). The main processes of LULC change between 1930 and 2010 were deforestation and the expansion of both agriculture and river channels. During this period, the forest cover decreased by 24.5%, and the rate of deforestation was significantly higher in the period 1930e1970. About 85.2% of the forest loss occurred at the expense of river channel widening or migration. The rest of the deforestation was the effect of conversion to grassland, followed by the extension of built up area and rice cultivation. Changes in the area of rice cultivation occupying the
floodplains were also dependent on the widening or narrowing of river channels in response toflooding events.
Extensiveflooding by the Tista and its tributaries in 1954 and 1968 was an important factor in the widening of river channels by about 70.2% during the period 1930e1970. The subsequent reduc-tion in channel areas between 1970 and 2010 is the result of a re-covery process in response to their earlier destabilization. Nevertheless, river channels occupied an area some 41.8% larger in 2010 than in 1930. These calculations may to some extent have
Fig. 2.Spatial distribution of LULC for 1930, 1970 and 2010 with map from 1868 (O’Donel et al., 1864e1868). Black lines indicate terrace-floodplain boundary.
Table 1
Area proportion (%) of LULC classes for the entire study area and within geomorphic units.
LULC Entire area Terrace Floodplain
Year 1930 1970 2010 1930 1970 2010 1930 1970 2010
Forest 41.2 32.3 31.1 55.9 54.7 54.8 24.4 6.7 4.1
Grassland 8.5 4.9 3.2 6.4 4.9 3.3 10.9 4.8 3.1
Tea 13.7 14.4 16.5 25.5 26.9 31.2 e e e
Rice 8.9 6.0 13.9 e e e 19.2 12.9 29.8
Other crop 4.0 3.2 1.0 7.5 6.1 1.9 e e e
Built up 2.9 3.8 4.8 4.1 6.9 8.6 1.4 0.3 0.3
River channel 20.8 35.4 29.5 0.6 0.5 0.2 44.1 75.3 62.7
Table 2
Predominant types of LULC changes (claiming over 1% of the total area).
Type of LULC change 1930e1970 1970e2010
No change 74.4 77.0
Forest to grassland 1.1
Forest to river channel 7.3 3.2
Grassland to rice 1.1
Grassland to river channel 4.0 1.6
Other crop to built up 1.3
Rice to river channel 5.0
River channel to forest 2.0
River channel to grassland 1.3 1.4
been affected by the construction of embankments and retaining walls which have restricted the extension of river channels in recent decades. Thefirst embankments were constructed only to protect bridges crossing the Lish and Gish rivers and some parts of the Tista. In 1978 the left bank of the Gish was protected between the margin of the mountain and its outlet to the Tista. The length of all embankments has recently been increased to 20 km, so that they protect 30% of the river banks.
Besides changes in overall land use, a different pattern of LULC changes may be observed between terrace and floodplain as geomorphic units represent a proxy for soils and hydrology. Tea plantations are located only on high terraces with well drained and acidic soil (Table 2). Rice cultivation, on the other hand, requires submersion conditions and is concentrated only on floodplains with shallow, slightly acidic soils. The reserved forest within the terrace shows stable cover of about 55% of the total terrace area, between 1930 and 2010. In contrast, over the same time period, about 19% of the totalfloodplain area was deforested. Grasslands occupy both the terraces near built up areas and thefloodplains along rivers, and does not show a strong correlation with geo-morphology and soils. Built up areas, on the other hand, are located mainly on higher elevated terraces, together with other crops planted in domestic gardens. In the 1930s, built up areas also expanded into the distal part of the extensive Tistafloodplain. The 1968flood changed this situation, and now only temporary huts are constructed within areas prone to inundation.
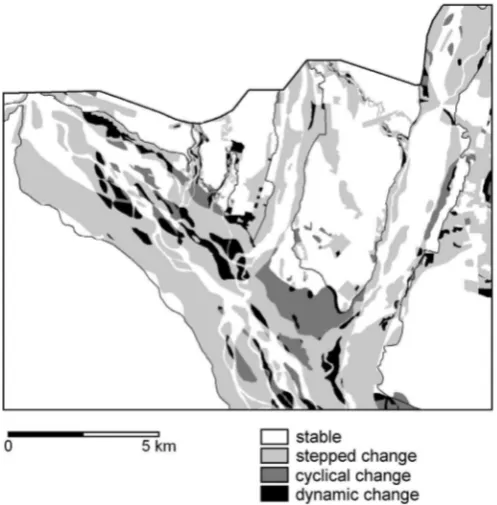
4.1.3. LULC stability
The study of LULC changes in the period 1930e2010 revealed that stable land use dominates in the investigated region and covers 60.3% of the total area (Fig. 3). The stable land use area mainly consists of large blocks of reserved forest, tea gardens and some settlement cores. About 1/3 of the study area has undergone stepped changes, in the form of the conversion of forest or grass-land to tea bushes at the margin of the tea gardens. Extensive changes in this category are concentrated along river banks and are related to the widening of braided river channels. Cyclical changes
occur only in places within distal areas of the large river fl ood-plains, such as Tista and Gish, where the margins of these wide
floodplains are occupied by ricefields. During extremeflooding, the cultivated land is affected by debris deposition and thus excluded from cultivation. Usually, after some time, the sediment is removed or mixed with the soil, and the land is again taken under cultiva-tion. The area affected by cycle changes covers 4.9% of the region. Dynamic changes in land use occupy only 4.2% of the total area. Land undergoing high turnover between many different land use classes (dynamic changes) is scattered across the Tista river chan-nels, where sand bars are frequently degraded and built up by
flowing water.
4.2. Impact of LULC change on soil properties
4.2.1. Effect of land-use systems on the physical and chemical properties of soil at different depths
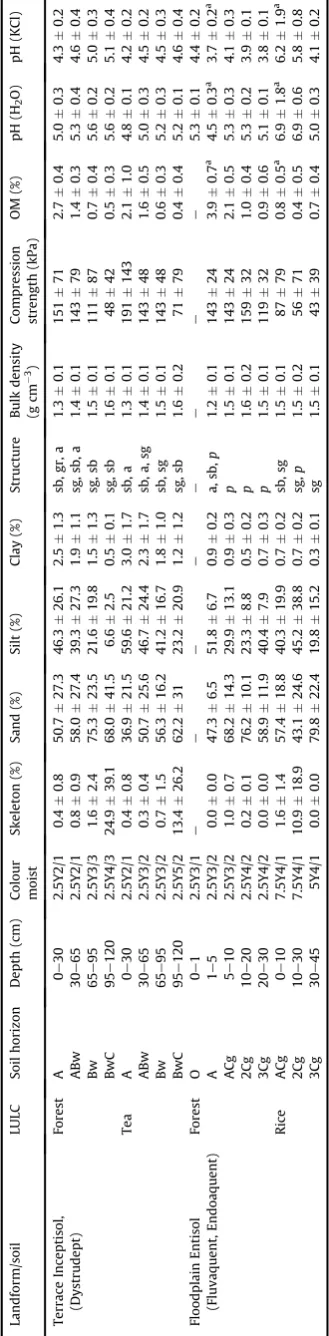
Soils within the terraces are deep and well drained (Table 3). Their grain-size composition is characterized by the dominance of a sandy fraction and low clay content (<5%). The decrease in silt and clay content with depth, as opposed to sand distribution, indicates intensive weathering of the surface soil horizon. Soil colour, in both the forest and tea profiles, changes with depth from 2.5Y2/1 (black) to 2.5Y5/2 (dark greyish yellow). The organic (O) layer in the forest soils was absent or at best thin, a probable consequence of the rapid decomposition of the OM under warm and moist conditions. Within the terraces, plant roots were found up to a depth of 80e 100 cm, corresponding to the Bw horizon.
Soils within the floodplains are shallow and poorly drained, with visible gleyic features. The textural alternation of thefiner silty loam and coarser sandy loam layers reflectsflood events with se-vere erosion, the reworking of older sediments and the deposition of fresh ones. Forest soil colour under a horizon of undecomposed litter Oi changes with depth from 2.5Y3/2 (brownish black) to 2.5Y4/2 (dark greyish yellow). Soil horizons under rice contain more skeleton due to the proximity of a river, although their humus horizon (A) is more homogeneous as a consequence of continuous soil tillage. Withinfloodplains, plant roots were found mainly in the topsoil layer.
Within the terraces, soil compression strength decreases and bulk density increases with depth, reflecting the decreasing silt, clay and OM content of the subsurface horizons. Higher mechanical resistance, as well as bulk density values of topsoil in tea gardens than in the forest, most likely attributable to compaction resulting from the human traffic and loss of soil OM accompanying cultiva-tion, were not statistically significant. Differentiation of soil compression strength and bulk density within thefloodplains
re-flects mainly sediment layers heterogeneity.
The OM content of surface soil layer was greatest in forest (2.7e 3.9%), followed by tea plantation (2.1%) and rice cultivation (0.8%). As a general trend, the OM decreased with an increase in soil depth. Only in the case of somefloodplain soils, which had been frequently affected by the deposition of heterogenic sediment, was the alter-nation of layers with a lower and higher content of OM observed.
Terrace soils were acidic, the pH increasing with depth. The general acidic reaction of soils was probably due to the leaching of bases resulting from very high rainfall and acid OM content. The values of pH in soil profiles were slightly lower under tea, in comparison with soil under forest. Floodplain soils are acidic to neutral, but usually with decreasing pH, the lower the depth. The values of pH were significantly lower in soil under forest (4.5 in H2O), in comparison with soil pH under rice cultivation (6.9 in H2O), located within easy reach offlowing water.
Although soils under other land use types were not analysed in detail, it is however important to note that the highest topsoil
compaction was observed under built up areas and grasslands, in comparison with other land uses within terrace. Compaction is related to high human and car traffic within built up areas and grasslands. The latter are frequently used as transport corridors between settled areas or as recreational land. Compacted soils can exert a local influence on plant growth, and, together with the artificial surfaces of built up areas, can increase the frequency of runoff generation as well as its intensity. Soils under other crops usually only amounts to small areas of domestic garden.
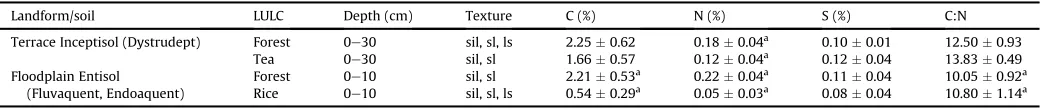
4.2.2. Effect of land use systems on the total carbon and selected nutrient content of A soil horizon
The most extensive human influences on soil properties are the changes which affect the topsoil (A horizon) as a result of defor-estation, tillage and fertilization. Significant differences (p<0.05) in OM between the forest and the other LULC lead to a reduction in total soil carbon and nutrient content (Table 4). In general, the total C and total N content of the surface layer was significantly greater in the forest (2.21e2.25%) than under tea plantation (1.66%) and rice cultivation (0.54%). The total S content in all soils was very low and cultivation has not significantly changed the sulphur concentration. The C:N ratios of the cultivated soils were greater (10.80e13.83) than those of the forest soil (10.05e12.50), probably reflecting the fact that cultivation-induced reductions in total N were generally smaller than the concurrent reductions in total C.
5. Discussion
The landscape of the Sikkim Himalaya piedmont is formed by a combination of natural and anthropogenic influences that occur on varying temporal and spatial scales. The changes in the area of tea gardens, rice cultivation, other crop cultivation and built up areas are directly related to human impact. Land occupied by these four categories increased from 29.5% to 36.2% between 1930 and 2010. The cultivation of tea is a long-term monoculture. About 43% of the tea bushes are more than 50 years old (Tea Board of India, 2010). The land for the plantations belongs to the Government, but is granted to individual and corporate lessees. Each lease is renewable after 30 years, and is subject to the condition that the land be used only for tea production (Bhowmik, 2002). The extension of tea cultivation therefore increases the stability of the LULC. In addition, most of the tea estates occupy further land where no activity is performed (between 10 and 35% of the total area granted), which could potentially be put under tea cultivation. Decisions concerning the extension of cultivation (mainly related to the market prices of tea and funds for investment available to lessees often result in change in two other land use categories. A larger area under tea requires new labourerseeither immigrants or local people. This induced population growth in turn leads to an expansion of built up areas, and of rice cultivation for meeting the increased demand for food.
Over the past few decades, the built up area there has only marginally increased, from 2.9% in 1930 to 4.8% in 2010, despite a growth in population density from 60 inhabitants km 2in 1931, to 105 inhabitants km 2in 1971 and 320 inhabitants km 2 in 2011 (Government of India, 2011). This represents the effect of the concentration of 56% of the total population into tea gardens. Tea estates provide residential quarters for their employees along with some community facilities, such as schools and hospitals. Most of the workers reside within the plantation area, restricted by so-called“labour lines”, delimited during the formation of the gar-den. The large reserved forest complexes and frequently inundated
floodplains further restrict the expansion of built up areas. The development of forestry has had the opposite effect to that of the human activity described earlier, as it is focused on the
preservation of the natural forest for the controlled harvesting of commercially valuable trees. A crucial factor facilitating the pro-tection of the forest against illegal timber exploitation is probably the extent of employment in the tea plantations. It creates sufficient non-farm jobs to pull people away from the forest and thus help in the stabilization of the LULC pattern of piedmont (Rudel et al., 2005).
Our analysis indicates thatfluvial activity and not man, is the main agent of deforestation (cf.Table 2). Topographic maps from the 1930s show that the rivers studied maintained their braided pattern, with stabilized sand bars by the forest. The braided pat-terns reflected natural erosive conditions, which resulted in high
flood discharges and sediment deposition. Between 1930 and 2010, channel widening is clearly visible, as is a decrease in the sand bars covered mainly by grass. Comparison of the topographical maps and satellite images indicates that the area of river channels increased by about 41.8% between 1930 and 2010. In this case, it is possible to investigate three potential factors controlling change in river morphology: natural short-term variations in the rainfall regime, and human-induced LULC cover changes in mountain catchments and/or within thefloodplains.
The monsoon is highly variable in intensity from year to year. However, trend analysis for the annual and seasonal rainfall series (1871e2010) shows these to be very stable, with no long-term change in the rainfall over the Sikkim Himalaya and its piedmont (Guhathakurta and Rajeevan, 2008). This confirms the general view that monsoon rainfall is trendless and mainly random in nature, over a long period of time (Mooley and Parthasarathy, 1984).
Changes in LULC from forested to agricultural use, in headwater areas, are known to increase discharge and sediment supply, which influences downstream channel morphology in complex ways (Liebault and Piegay, 2002; Vanacker et al., 2003; Price and Leigh, 2006; Wohl, 2006). In the case of the large Tista catchment, it is difficult to estimate the human impact on forest cover (Hofer and Messerli, 2006; Starkel et al., 2008), but it is possible to investi-gate LULC changes in the small catchments of the Lish and Gish draining the Himalayan margin. Widespread deforestation started in their mountain catchments in the mid-19th century, as the result of agriculture, surface coal mining and settlement expansion (Basu and Ghatowar, 1988, 1990). Between 1930 and 2010, the forest area decreased in the Lish mountain catchment, from 74.8%e66.5%, and in the Gish mountain catchment, from 83.4%e77.8%. At the same time, the landslide area in the Lish and Gish mountain catchments has increased by 223.3% (from 3.0%e9.7%) and by 22.5% (from 4.9%e6.0%), respectively (Basu and Ghatowar, 1988, 1990). Enlargement of the landslide area was probably the most important factor in generating large surface runoff volumes and sediment during rainfall events, as has already been observed in the Andean mountain region (Vanacker et al., 2005).
Channel geometry might also be strongly influenced by local controls in the piedmont zone, such as the riparian vegetation cover. Dense vegetation increases roughness and, by means of the binding effects of the roots, increases bank resistance to erosion (Millar, 2000). Clearance of riparian forest, for rice cultivation, facilitated the enlargement of river channels, thereby increasing
the risk of soil degradation over a larger area than had been the case several decades earlier.
Changes in LULC patterns, especially the replacement of natural forest by monocultural tea and rice cultivation, influenced the physical and chemical properties of soil at landscape level (Larson and Pierce, 1991). Increases in bulk density and compression strength, or reductions in the OM, C, N, and S content, as well as pH, had suggested that, under current management practices, long-term tea and rice cultivation results in a loss of soil quality. How-ever, statistically significant changes were observed only in some chemical properties of the topsoil, which is of prime importance for soil management, fertility and crop production.
Contrasts in soil OM, C and nutrient status between natural forest and tea within the terraces were smaller than the contrast between natural forest and rice in thefloodplains. Tea cultivation has significantly changed the chemical properties of the surface soil horizon through a reduction in C and N content by 26% and 33% respectively, in comparison with natural forest soil within the terrace area. The influence of rice cultivation on the soil properties is masked by thefluvial activity. The combined effect offlooding and rice cultivation is reflected in the lower content of C by 76% and N by 77% in the surface soil horizon, as compared with forest soil within thefloodplain.
The decline in soil OM and C during long-term tea production probably reflects a reduction in the amount of organic matter being returned to the soil, in the form of fallen leaves and plant debris (Saha et al., 2000). The nutrient requirements for commercial tea production are particularly high because the harvestable young leaves contain the largest percentage of nutrients in the plant (Dang, 2005). N is the most important nutrient element for tea cultivation, because it is required in large quantities, accounting for approximately 4e5% of the dry weight of the harvested shoots (Natesan and Ranganathan, 1990). Assuming tea yields of approx-imately 1600 kg ha 1 year 1 in the piedmont zone (Banerjee, 2005), about 75 kg ha 1 year 1 of N is removed with the tea leaves. The annual application of 100 kg ha 1 of N fertilizer (tea garden manager’s personal communication) can partly restore the soil’s nitrogen content.
The decline in soil OM and C during rice production is the combined effect of a reduction in the amount of organic matter being returned to the soil, and of continuous tillage operations (Chaudhury et al., 2005). The N content reduction mainly follows depletion through processes of ammonia volatilisation and deni-trification in submersion conditions (Choudhury et al., 1997). The rice crop also removes large amounts of N for its growth and grain production. Existing statistics show that the productivity of rice in the piedmont is about 1600 kg ha 1, and is considerably lower than the average productivity of 2300 kg ha 1in the West Bengal State (Mukhopadhyay et al., 2008). Low level of fertilizer use, combined with the removal 16 kg ha 1year 1and 8 kg ha 1year 1of N, with rice grains and straw respectively, results in a significant reduction in nitrogen in the soils (Chaudhury et al., 2005; Choudhury and Kennedy, 2005).
Taking into account the long-term nature of the plantation, the soil still has the capability to support tea production. Studies from Table 4
Effect of LULC on total carbon and selected nutrient content of A soil horizon.
Landform/soil LULC Depth (cm) Texture C (%) N (%) S (%) C:N
Terrace Inceptisol (Dystrudept) Forest 0e30 sil, sl, ls 2.250.62 0.180.04a 0.100.01 12.500.93
Tea 0e30 sil, sl 1.660.57 0.120.04a 0.120.04 13.830.49
Floodplain Entisol (Fluvaquent, Endoaquent)
Forest 0e10 sil, sl 2.210.53a 0.220.04a 0.110.04 10.050.92a
Rice 0e10 sil, sl, ls 0.540.29a 0.050.03a 0.080.04 10.801.14a
a
other tea-based planting systems show that soil OM, C and N content can be expected to decline rapidly in thefirst few decades after deforestation. Later, as the age of the tea plantations increases, the rates of OM decomposition and renewal from fallen leaves, plant pruning, and decaying roots usually reach equilibrium, with little or no net change in soil C and N (Li et al., 1997; Dang, 2007). In contrast, the highly dynamic rice-based cropping system, com-bined with the low-level use of fertilizers and frequentflooding, leads to a fast decline in soil chemical quality properties. These can partly be compensated for by the deposition of new sediment eroded from the mountains. In this case, the considerable spatial heterogeneity in sedimentological and hydrological characteristics, often on very local scales, is fundamental for soil development and properties.
6. Conclusions
The piedmont of the Sikkim Himalayas is characterized by a shift from a natural to a human-dominated landscape during the last 150 years. The role of natural and human-induced factors in the transformation of land use and soil properties has varied over time and landform utilised. Natural forces related to the tectonically active Himalayas, with their deep weathered mantle and high monsoon rainfall, are the most powerful factors of water and sedimentflux into the piedmont zone. Forest vegetation, fluvial activity adjusted to the natural rainfall-runoff regime and sparse population were the prevailing features of the piedmont up until the late 19th century. Land reforms related to the location of tea gardens led to rapid deforestation of the higher elevated terraces with suitable soils for commercial tea production. The introduction of forestry finalized the formation of a new LULC framework. Continuous population growth between 1930 and 2010 resulted in a shift in the major LULC changes, from the terrace to thefloodplain. While a gradual extension of tea plantation and forestry develop-ment helped stabilize the LULC within the terrace area, the parallel deforestation of mountain catchments andfloodplains disturbed the dynamic equilibrium between forest vegetation and fluvial activity. Increased supplies of bedload to the headwater channels, combined with a reduction in the hydraulic roughness of river banks in the piedmont, resulted in the accretion of river beds and channel widening, which has extended downstream over a period of decades. The extension of river channels excluded large areas of
floodplain from cultivation and increased the risk of soil degradation.
The replacement of natural forest by monocultural tea and rice cultivation increased soil bulk density and compression strength, as well as reducing the OM, C, N, and S content However, statistically significant changes were observed only in the reduction of the OM, C and N in the cultivated topsoil, when compared with soil in a natural forest. Taking into account long-term tea cultivation, the soil still has the capability to support tea production. On the basis of experience from other tea-based agricultural systems, one can as-sume that the plantation system has reached a state of equilibrium with little or no net change in soil C and N. In contrast, the highly dynamic rice-based cropping system, combined with low-level use of fertilizers and frequent flooding, leads to a fast decline in the quality of chemical properties in the soil. These can be partly compensated for by the deposition of new sediment eroded from the mountains.
The Sikkim Himalayas piedmont is an example where, in a human-dominated landscape with high population density, natural forces still play an important role in LULC changes. High rainfalls,
flooding or river bank erosion are not new extreme phenomena for this region. However, with settlement development and changing LULC patterns, the region’s vulnerability to such hazards has
increased. The current observations seem to be indicative of land use trends in the Eastern Himalayan piedmont generally, particu-larly as the environmental conditions associated with similar land use systems are expanding several hundred kilometres along the Himalayan foothills to the east.
Acknowledgements
This paper is the outcome of research project No. 2012/05/B/ ST10/00309 of the National Science Centre (Poland) in cooperation with the Indian National Science Academy. We express gratitude to Prof. S. Sarkar from Department of Geography, North Bengal Uni-versity, who facilitated data collection and helped in organising
fieldwork.
Appendix A. Supplementary data
Supplementary data related to this article can be found athttp:// dx.doi.org/10.1016/j.jenvman.2014.01.034.
References
Allen, B.C., Gait, E.A., Howard, H.F., Allen, C.G.H., 1906. Gazetteer of Bengal and North-east India. Mittal Publication, New Delhi.
An, L., 2012. Modeling human decisions in coupled human and natural systems: review of agent-based models. Ecol. Model. 229, 25e36.
Banerjee, B., 2005. Tea Production and Processing. Oxford/IBH, New Delhi. Banarjee, A., Ghosh, S., Springate-Baginski, O., 2010. The creation of West Bengal’s
forest underclass an historical institutional analysis of forest rights depriva-tions. IPPG Discuss. Pap. 51, 1e26.
Basu, S.R., Ghatowar, L., 1988. Landslides and soil-erosion in the Gish drainage basin of the Darjeeling Himalaya and their bearing on North Bengalfloods. Stud. Geomorphol. Carpatho-Balcanica 22, 105e122.
Basu, S.R., Ghatowar, L., 1990. The impact of landslides onfluvial processes in the Lish basin of the Darjeeling Himalayas. Geogr. Pol. 59, 77e87.
Bhowmik, S.K., 2002. Productivity and labour standards in tea plantation sector in India. In: Sivananthiran, A., Venkata Ratnam, C.S. (Eds.), Labour and Social Issues in Plantations in South Asia. International Labour Organisation, New Delhi, pp. 133e166.
Bookhagen, B., 2010. Appearance of extreme monsoonal rainfall events and their impact on erosion in the Himalaya. Geomatics. Nat. Hazard Risk 1, 37e50.
Carr, D.L., Suter, L., Barbieri, A., 2006. Population dynamics and tropical deforesta-tion: state of the debate and conceptual challenges. Popul. Environ. 27, 89e113.
Chakraborty, T., Ghosh, P., 2010. The geomorphology and sedimentology of the Tista megafan, Darjeeling Himalaya: implications for megafan building processes. Geomorphology 115, 252e266.
Champion, H.G., Seth, S.K., 1968. A Revised Survey of Forest Types of India. Manager Publication, Delhi.
Chaudhury, J., Mandal, U.K., Sharma, K.L., Ghosh, H., Mandal, B., 2005. Assessing soil quality under long-term rice-based cropping system. Commun. Soil. Sci. Plant Anal. 36, 1141e1161.
Choudhury, A.T.M.A., Kennedy, I.R., 2005. Nitrogen fertilizer losses from rice soils and control of environmental pollution problems. Commun. Soil. Sci. Plant Anal. 36, 1625e1639.
Choudhury, A.T.M.A., Zaman, S.K., Bhuiyan, N.I., 1997. Nitrogen response behavior of four rice varieties under wetland culture. Thai J. Agric. Sci. 30, 195e202.
Dale, V.H., King, A.W., Washington-Allen, R.A., McCord, R.A., 1998. Assessing land-use impacts on natural resources. Environ. Manag. 22, 203e211.
Dang, V.M., 2005. Soileplant nutrient balance of tea crops in the northern
moun-tainous region, Vietnam. Agric. Ecosyst. Environ. 105, 413e418.
Dang, V.M., 2007. Quantitative and qualitative soil quality assessments of tea en-terprises in Northern Vietnam. Afr. J. Agric. Res. 2, 455e462.
Davidar, P., Sahoo, S., Mammen, P.C., Acharya, P., Puyravaud, J.P., Arjunan, M., Garrigues, J.P., Roessing, K., 2010. Assessing the extent and causes of forest degradation in India: where do we stand? Biol. Conserv. 143, 2937e2944.
DeFries, R., 2008. Terrestrial vegetation in the coupled human-earth system: con-tributions of remote sensing. Annu. Rev. Environ. Resour. 33, 369e390.
Dhar, O.N., Nandargi, S., 2000. A study offloods in the Brahmaputra basin in India. Int. J. Climatol. 20, 771e778.
Dutt, G.N., 1966. Landslides and soil erosion in the Kalimpong Subdivision, Darjeeling district and their bearing on the North Bengal Flood. Bull. Geol. Surv. India, Ser. B 15, 62e69.
Froehlich, W., Starkel, L., 1993. The effects of deforestation on slope and channel evolution in the tectonically active Darjeeling Himalaya. Earth Surf. Process. Landform. 18, 285e290.
(Eds.), Predictions in Ungauged Basins: PUB Kick-off Proceedings of the PUB Kick-off Meeting Held in Brasilia, 20e22 November 2002, vol. 309. IAHS
Pub-lication, pp. 137e145.
Geist, H.J., Lambin, E.F., 2002. Proximate causes and underlying driving forces of tropical deforestation. BioScience 52, 143e150.
Geist, H.J., Lambin, E.F. (Eds.), 2006. Land Use and Land Cover Change: Local Pro-cesses, Global Impacts. The IGBP Book Series. SpringereVerlag, Berlin.
Ghosh, B.C., 1970. The development of tea industry in the district of Jalpaiguri. In: Sanyal, J.C., Ghose, G.C., Chakraborty, J.C. (Eds.), Jalpaiguri District Centenary Souvenir 1869e1968. Newman Printers, Calcutta, pp. 281e310.
Ghosh, S., Carranza, E.J.M., 2010. Spatial analysis of mutual fault/fracture and slope controls on rocksliding in Darjeeling Himalaya, India. Geomorphology 122, 1e
24.
Ghosh, A.K., Sarkar, D., Dutta, D., Bhattacharyya, P., 2004. Spatial variability and concentration of arsenic in the groundwater of a region in Nadia district, West Bengal, India. Arch. Agron. Soil. Sci. 50, 521e527.
Government of Bengal, 1872. Census of India 1872. Government of Bengal, Calcutta. Government of Bengal, 1931. Census of Bengal and Sikkim, vol. 5. Government of
Bengal, Calcutta, p. 6.
Government of India, 2011. Census of India 2011. Government of India, New Delhi. Government of West Bengal, 2008e2009. State Forest Report West Bengal.
Direc-torate of Forests, Kolkata.
Grujic, D., Coutand, J., Bookhagen, B., Bonnet, S., Blythe, A., Duncan, Ch, 2006. Cli-matic forcing of erosion, landscape and tectonics in the Bhutan Himalaya. Ge-ology 34, 801e804.
Guhathakurta, P., Rajeevan, M., 2008. Trends in rainfall pattern over India. Int. J. Climatol. 28, 1453e1469.
Hersperger, A.M., Bürgi, M., 2009. Going beyond landscape change description: quantifying the importance of driving forces of landscape change in a Central Europe case study. Land Use Policy 26, 640e648.
Hofer, T., Messerli, B., 2006. Floods in Bangladesh: History, Dynamics and Rethinking the Role of the Himalayas. United Nations University Press, Tokyo. Hunter, W.W., 1876. A Statistical Account of Bengal, vol. 10. Trubner Co., London. Jensen, J.R., 2007. Remote Sensing of the Environment: an Earth Resource
Perspective, second ed. Prentice Hall, Upper Saddle River.
Lambin, E.F., Meyfroidt, P., 2010. Land use transitions: socio-ecological feedback versus socio-economic change. Land Use Policy 27, 108e118.
Lambin, E.F., Geist, H.J., Lepers, E., 2003. Dynamics of land-use and land-cover change in tropical regions. Annu. Rev. Environ. Resour. 28, 205e241.
Larson, W.E., Pierce, F.J., 1991. Conservation and enhancement of soil quality. In: Dumanski, J., Pushparajah, E., Latam, M., Myers, R. (Eds.), Evaluation for Sus-tainable Land Management in the Developing World, Proceedings of the In-ternational Workshop on Evaluation for Sustainable Land Management in the Developing World. International Board for Soil Research and Management, Bangkok, pp. 175e203.
Li, C., Frolking, S., Crocker, G.I., Grace, P.R., Klir, J., Korchens, M., Poulton, P.R., 1997. Simulating trends in soil organic carbon in long-term experiments using DNCD model. Geoderma 81, 45e60.
Liebault, F., Piegay, H., 2002. Causes of 20th century channel narrowing in mountain and piedmont rivers of southeastern France. Earth Surf. Process. Landform. 27, 425e444.
Madhusudan, K., 2011. Nature tourism development and impact assessment in peripheral areasea study of North Bengal (India). South Asian J. Tour. Herit. 4,
90e99.
Millar, R.G., 2000. Influence of bank vegetation on alluvial channel patterns. Water Resour. Res. 36, 1109e1118.
Mooley, D.A., Parthasarathy, B., 1984. Fluctuations in all-India summer monsoon rainfall during 1871e1978. Clim. Change 6, 287e301.
Mukhopadhyay, D., Majumdar, K., Pati, R., Mandal, M.K., 2008. Response of rainfed rice to soil test-based nutrient application in Terai alluvial soils. Better Cropse
India 2, 20e22.
Murray, J.A., Bochin, N.A., 1973. Instructions for Compilation of the Chapter on Catastrophic Floods for the UNESCO Publication. In:“Annual Summary of In-formation on Natural Disasters”: Forms with Explanatory Notes. UNESCO, Paris. NBSS & LUP, 1991. West Bengal Soils, Map Scale 1:500 000. Government of India,
Nagpur, Calcutta.
Nakata, T., 1972. Geomorphic History and Crustal Movements of the Foot-hills of the Himalayas. In: The Scientific Reports of the Tohoku University 7th Series Ge-ography, vol. 22, pp. 39e177.
Natesan, S., Ranganathan, V., 1990. Contents of various elements in different parts of the tea plant and in infusions of black tea from southern India. J. Sci. Food Agric. 51, 125e139.
O’Donel, J.H., Esq., Assistants Surveyors, 1864e68. District Julpigoree and the Native
State of Cooch Behar Map, Scale, 1 Inch¼4 Miles. Surveyor General’s Office, Calcutta.
Panwar, P., Sharmistha, P., Reza, S.K., Sharma, B., 2011. Soil fertility index, soil evaluation factor, and microbial indices under different land uses in acidic soil of humid subtropical India. Commun. Soil. Sci. Plant Anal. 42, 2724e2737.
Pelorosso, R., Leone, A., Boccia, L., 2009. Land cover and land use change in the Italian central Apennines: a comparison of assessment methods. Appl. Geogr. 29, 35e48.
Petit, C.C., Lambin, E.F., 2002. Impact of data integration technique on historical land use/land cover change: comparing historical maps with remote sensing data in the Belgian Ardennes. Landsc. Ecol. 17, 117e132.
Price, K., Leigh, D.S., 2006. Morphological and sedimentological responses of streams to human impact in the southern Blue Ridge Mountains, USA. Geo-morphology 78, 142e160.
Ray, S., 2002. Transformations on the Bengal Frontier: Jalpaiguri, 1765e1948.
Routledge Curzon, London.
Rudel, T., Coomes, O., Moran, E., Achard, F., Angelsen, A., Xu, J., Lambin, E., 2005. Forest transitions: towards a global understanding of land use change. Glob. Environ. Change 15, 23e31.
Saha, A.K., Saha, N., Pal, S.K., 2000. Distribution of organic carbon and nitrogen in some Tarai soils of West Bengal. Agropedology 10, 132e138.
Sarkar, S., 2008. Flood hazard in the Sub-Himalayan North bengal, India. In: Singh, S., Starkel, L., Syiemlieh, H.J. (Eds.), Environmental Changes and Geomorphic Hazard. Bookwell, New Delhi, Shillong, pp. 247e262.
Sarkar, D., Gangopadhyay, S.K., Sahoo, A.K., 2006. Soil resource appraisal towards land use planning using satellite remote sensing and GISea case study in
Patloinala micro-watershed, district Puruliya, West Bengal. J. Indian Soc. Remote Sens. 34, 245e260.
Shao, G., Wu, J., 2008. On the accuracy of landscape pattern analysis using remote sensing data. Land. Ecol. 23, 505e511.
Soil Survey Staff, 2010. Keys to Soil Taxonomy, eleventh ed. United States Depart-ment of Agriculture, Natural Resources Conservation Service, Washington D.C., USA.
Soja, R., Starkel, L., 2007. Extreme rainfalls in Eastern Himalaya and southern slope of Meghalaya Plateau and their geomorphological impacts. Geomorphology 84, 170e180.
Starkel, L., 1972. The role of catastrophic rainfall in the shaping of the relief of the Lower Himalaya (Darjeeling Hills). Geogr. Pol. 21, 103e147.
Starkel, L., Basu, S. (Eds.), 2000. Rains, Landslides and Floods in the Darjeeling Himalaya. INSA, New Delhi.
Starkel, L., Sarkar, S., Soja, R., Prokop, P., 2008. Present-day Evolution of the Sikkimese-Bhutanese Piedmont. Prace Geograficzne IGiPZ PAN, Warszawa, p. 219. Tea Board of India, 2010. List of New Registration of Tea Estate During 1900e2010.
Licensing Department, Kolkata.
The Indian Tea Association, 1930. Maps of Tea Districts with Complete Index to Tea Gardens. The Indian Tea Association, Calcutta.
Tiwari, P.C., 2000. Land-use changes in Himalaya and their impact on the plains ecosystem: need for sustainable land use. Land Use Policy 17, 101e111.
Vanacker, V., Govers, G., Barros, S., Poesen, J., Deckers, J., 2003. The effect of short-term socio-economic and demographic changes on landuse dynamics and its corresponding geomorphic response with relation to water erosion in a tropical mountainous catchment, Ecuador. Landsc. Ecol. 18, 1e15.
Vanacker, V., Molina, A., Govers, G., Van Esch, L., Poesen, J., Dercon, G., Deckers, J., 2005. River channel response to short-term human-induced change in land-scape connectivity in Andean ecosystems. Geomorphology 72, 340e353.
Walkley, A., Black, I.A., 1934. An examination of the Degtjareff method for deter-mining soil organic matter and a proposed modification of the chromic acid titration method. Soil. Sci. 37, 29e38.