USING REMOTE SENSING MULTI-TEMPORAL IMAGE TO
ANALYSE THE LAND USE CHANGES AND ITS IMPACT ON THE
PEAK DISCHARGE IN GARANG WATERSHED CENTRAL JAVA
Ahmad Cahyadi ([email protected])
Program On BEASISWA UNGGULAN BPKLN KEMDIKBUD RI, Master Program On Planning and Management for Coastal Area and Watershed,UGM Yogyakarta
Henky Nugraha Emilya Nurjani
Department of Environmental Geography, Faculty of Geography, UGM Yogyakarta
Ardila Yananto
Muhammad Sufwandika Wijaya
Department of Cartography and Remote Sening, Faculty of Geography, UGM Yogyakarta
ABSTRACT
Change due to land use in the city of Semarang as an impact of population growth and economic activity has led to urban sprawl. Rob flooding, land subsidence, seawater intrusion and contamination of ground water in the northern part of Semarang lead to the
development of the southern part. Consequently, this leads to changes in land use so that the amount of rain water runoff will increase. This may cause the danger of flash floods in the greater city of Semarang. This study were aimed to: (1) determine the changes that occur in the Garang watershed lands during 1994 and 2001, and (2) determine the impact of land use changes on the size of the peak discharge occurring in the Garang watershed. The data used in this study were the 1994 Landsat TM, Landsat ETM 2001, and Citra Alos AVNIR 2008, Garang watershed soil map, slope map of Garang watershed stream network, and daily rainfall data at Ungaran Station of 1952 until 2009. It was found that developed land has been increasing more than doubled from 2001 to 2008, agricultural land increased by nearly 50% and the forest area were decreased from year to year. However, the peak discharge at the Garang watershed has not increased to the extreme though there was a slight change.
Keywords: land use change, peak discharge, urban sprawl
ABSTRAK
Perubahan penggunaan lahan di Kota Semarang akibat pertumbuhan penduduk dan aktivitas ekonomi telah menyebabkan terjadinya urban sprawl. Banjir rob, land subsidence,
74
1994 dan 2001, dan (2) mengetahui dampak perubahan penggunaan lahan terhadap besarnya debit puncak yang terjadi di DAS Garang. Data yang digunakan dalam penelitian ini adalah Citra Landsat TM tahun 1994, Citra Landsat ETM tahun 2001, dan Citra Alos AVNIR 2008, peta tanah DAS Garang, peta kemiringan lereng DAS Garang, peta jaringan sungai DAS Garang, dan data curah hujan harian Stasiun Ungaran tahun 1952 sampai dengan tahun 2009. Ditemukan bahwa luas lahan terbangun bertambah lebih dari dua kali lipat dari tahun 2001 sampai dengan 2008, lahan pertanian meningkat hampir 50% dan luas hutan mengalami penurunan dari tahun ke tahun. Namun demikian, debit puncak di DAS Garang tidak bertambah secara ekstrem meskipun mengalami sedikit perubahan.
Kata kunci: debit puncak, perubahan penggunaan lahan, urban sprawl
Population growth and development of economic activity in Semarang Cities and surrounding areas has led to urban sprawl. Coastal flooding that often occurs and land subsidence in the northern part of Semarang has led to the development of Semarang city dominant to the southern parts. It is also associated with the presence of a good source of groundwater in the Southern, while in the northern part of Semarang many are not feasible due to consumption of contaminated or becomes salty (seawater intrution).
The development in the southern part needs to get serious attention because it is upstream of the rivers that flow across the city, including Garang River. Changes in land use from unbuilt-up area to built-up area can disrupt the hydrological cycle. The more runoff so that the danger of flash floods will increase. Windarto (2010) mentions that the date January 25, 1990 recorded more than 45 people died and economic losses reached 8.5 billion dollars. Therefore, it would require an analysis of land use change and its impact on the Garang Watershed with peak discharge were strongly associated with the danger of flash floods in the city of Semarang.
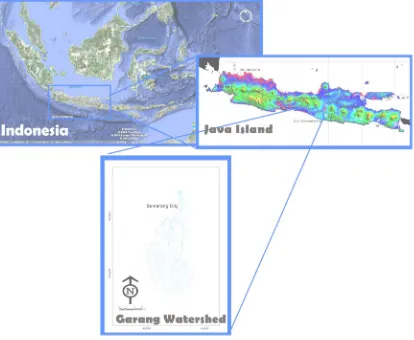
The area of this study is Garang watershed, Central Java. Garang watershed is the watershed that encompasses two regency i.e Semarang Regency and Semarang Municipality. Tributary contained in the river basins are Kreo River, Garang River and Kripik River. Garang watershed has a total area of about 220 km2.
75
RESEARCH METHOD Land use Classifications
Classifications were performed for temporal data, Landsat TM 1994, Landsat ETM 2001, and ALOS AVNIR 2008. Classifications were done by using ENVI 4.5 software. This process was done by performing spectral classification based on the value of each land use.
Determination of Peak Discharge
Peak discharge was determined using the Rational Formula. The amount of flow is
proportional to the runoff coefficient (C), proportional to the rainfall intensity (I) and drainage area (A), (Chow, 1964 in Gunawan, 1991). Thus, by the rational method peak discharge expressed as:
Q0, 278. . .C I A (1) where :
Q : Peak Discharge (m3/s), C : Runoff Coefficient I : Rainfall Intensity (mm/hr) A : Drainage area (km2)
Determination of Runoff Coefficient
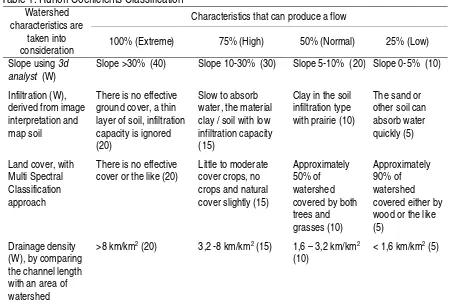
Table 1. Runoff Coefficients Classification Watershed
characteristics are taken into consideration
Characteristics that can produce a flow
100% (Extreme) 75% (High) 50% (Normal) 25% (Low)
There is no effective ground cover, a thin layer of soil, infiltration capacity is ignored
There is no effective cover or the like (20)
76
Runoff coefficient (C) was determined by using a data from soil map (infiltration), slope, land use resulting from the spectral classification process of land use and river network map to determine the value of drainage density. Data analysis was done by using Weight Score of the pixel values that have been reclassified. Scoring can be seen in Table 1.
Determination of Return Period
Rainfall intensity calculations performed with the Mononobe formula (Hadisusanto, 2011) with the following formula:
I = (R24/24) x (24/Tc)2/3 (2) where :
I = rainfall intensity (mm/hr) Tc = time of concentration (hours)
R24 = daily rainfall or rain during 24 hours (mm)
Tc values can be determined using Kirpich’s formula (in Hadisusanto, 2011) as follows:
Tc = 0,01947 L0,77S-0,385 (3) where :
Tc = time of concentration (hours) L = channel length (m)
S = slope of the watershed, S = ∆H/L
∆H = different elevation between the highest in the upper part and the lowest elevation in the outlet (m)
R24 obtained from Ungaran Raingauge Station 1952-2008. The value of R24 for each year sorted then determined when repeated using Weibull method (Hadisusanto, 2011). This is the formula used to determine return period.
Return Period = ((n+ 1)/ m) (4)
where :
n = Number of data used
m = The sequence number in ascending order of R24
RESULTS AND ANALISYS
Land Use Changes in Garang watershed
77
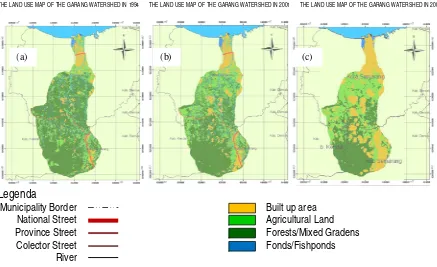
THE LAND USE MAP OF THE GARANG WATERSHED IN 1994 THE LAND USE MAP OF THE GARANG WATERSHED IN 2001 THE LAND USE MAP OF THE GARANG WATERSHED IN 2008
Legenda
Municipality Border National Street Province Street Colector Street River
Built up area Agricultural Land Forests/Mixed Gradens Fonds/Fishponds
Figure 2. The land use map of the Garang watershed in (a) 1994 (b) 2001 and (c) 2008
Table 2. Land Use Area in Garang Watershed
Land use Area (km2)
1994 2001 2008
Built up area 20,6 34,0 48,8
Agricultural Land 49,9 67,4 69,3
Forests/Mixed
Gardens 134,3 103,0 85,8
Ponds/Fishponds 0,8 1,1 1,6
TOTAL 205,6 205,6 205,6
The results analysis of runoff coefficient shows that although rapid changes in land use with major changes, the runoff coefficient tends to increase along with the existing land cover changes. Runoff coefficient values in a row from 1994, 2001, 2008, were 0.6068; 0.6256; and 0.6376. Based on these results, it can be seen in the time span of 7 years, the average runoff coefficient increased approximately by 1%. However, the runoff coefficient of 4 years has been relatively high, where more than 60% of rainfall that fell in Garang watershed will become runoff that could cause flooding.
78
Peak Discharge Changes in Garang Watershed
The highest elevation in the upper part is 2037.5 meters above seawater level. So the height
difference (ΔH) the highest elevation on the watershed with lowest elevation is 2037.5 5 meters a.s.l.
(outlet located at 0 5 meters a.s.l.). The length of the main river is 77.05 km. This means that the slope of the watershed is 2.64% or 0.0264. Time of concentration (Tc) in Garang watershed is 2.24 hours. Table 3 present the results of rainfall intensity (I) calculation for several return period.
Table 3. The Rainfall Intensity in Garang Watershed for Several Return Period Return Period
(years)
Rainfall Intensity R24 (mm/ hr)
Tc (hours)
I (mm/ hr)
1 16.5 2.24 26.5
2 20.2 2.24 32.2
5 24.9 2.24 39.9
10 28.6 2.24 45.7
15 30.7 2.24 49.1
20 32.2 2.24 51.5
25 33.3 2.24 53.3
50 37.0 2.24 59.1
100 40.6 2.24 64.9
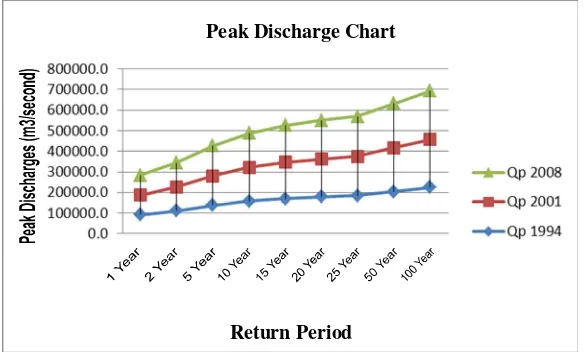
The results of peak discharge analysis shows that increases in peak discharges in Garang watershed due to land use changes is not too high. Nevertheless, there is a tendency to continue to rise from 1994 to 2008. Therefore, issues of land use change should still be an issue that has to be concerned seriously.
Figure 3. The peak discharge in Garang watershed for several return period
79
Table 4. The Peak Discharge in Garang Watershed With Several Return Period Return Period
(year)
Qp 1994 (m3/s)
Qp 2001 (m3/s)
Qp 2008 (m3/s)
1 919,9 948,4 966,5
2 1117,7 1152,3 1174,4
5 1385,0 1427,9 1455,3
10 1586,3 1635,5 1666,8
15 1704,3 1757,1 1790,8
20 1787,6 1843,0 1878,4
25 1850,1 1907,4 1944,0
50 2051,4 2115,0 2155,6
100 2252,8 2322,6 2367,1
CONCLUSION
From the results of the analysis, it can be conclude that in Garang watershed built up area increased more than doubled from 2001 to 2008, agricultural land rose nearly 50% and the forest has
decreased from year to year. Peak discharge shows that the increase in peak discharge in Garang watershed due to land use changes is not too high. Nevertheless, there is a tendency to continue to rise from 1994 to 2008. Therefore, issues of land use change should still be an issue that has to be concerned seriously.
REFERENCES
Windarto, J. , (2010). ”Flood early warning system develop at garang river Semarang using information technology base on SMS and Web”. International Journal Of Geomatics And Geosciences, 1 (1).
Hadisusanto, N. (2011). Aplikasi hidrologi. Yogyakarta: Jogja Media Utama.
Gunawan, T. (1991). Penerapan teknik pengindraan jauh untuk menduga debit puncak