ISSN: 2094-1749 Volume: 3 Issue: 2, 2011
128
Short-Term Dynamics of the Active and Passive Soil
Organic Carbon Pools in a Volcanic Soil Treated With Fresh
Organic Matter
Wilfredo A. Dumale, Jr.1, 2, *, Tsuyoshi Miyazaki 2, Taku Nishimura 2 and Katsutoshi Seki3
1
Department of Plant Science, Nueva Vizcaya State University, Bayombong 3700, Nueva Vizcaya, Philippines
2
Department of Biological and Environmental Engineering, Graduate School of Agricultural and Life Sciences, The University of Tokyo, 1-1-1 Yayoi, Bunkyo-ku, Tokyo 113-8657 Japan
3
Faculty of Business Administration, Toyo University, 5-28-20 Hakusan, Bunkyo-ku, Tokyo 112-8606, Japan
* Corresponding author,
e-mail: [email protected]; [email protected]
Abstract
In a 110-day constant temperature experiment (20° C), we determined the effect of fresh organic matters (FOM): 0 (control); 1.81 g leaf litter (LL) carbon kg-1; and 2.12 g chicken manure (CM) carbon kg-1 in the stable soil organic carbon [mineral-associated organic carbon (MAOC)], labile soil organic carbon [soil microbial biomass carbon (SMBC)], and carbon dioxide (CO2) evolution of a volcanic ash soil from Tsumagoi, Gunma Prefecture, Japan (138°30’ E, 36°30’ N).
Overall, CO2 evolution and SMBC increased after the treatment of soil with FOM, whereas MAOC decreased below its original level three days after FOM application. These data support the view that fresh OM promotes increases in SMBC and CO2 in the rapidly cycling active carbon pool and further suggest that the MAOC fraction, though stable as conventionally believed, can be a source of CO2. Our findings challenge the convention that only labile SOC is the source of short-term CO2 evolution from soils.
Keywords:
mineral-associated organic carbon, soil microbial biomass carbon, soil organic carbon, CO2 evolutionIntroduction
129
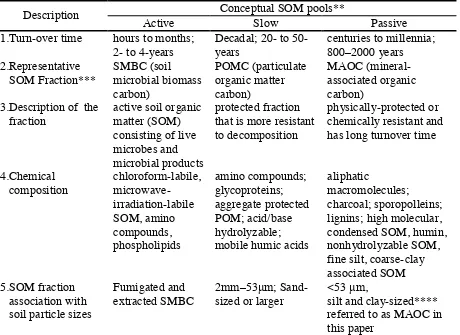
conceptual pools: active, slow, and passive, which differ in turnover times (Parton et al., 1988). The relationships of the measurable fractions of these conceptual pools and their measurable fractions with the particle size fractions were summarized by Dumale et al. (2009) (Table 1). The mineral-associated organic carbon (MAOC) is the measurable fraction of the passive SOC pool (Sherrod et al., 2005). The MAOC fraction can be measured by physically separating the <53 mm particle size fraction, which is the silt-and clay-sized fraction (Haile-Mariam et al., 2008). The associated SOC of the combined silt and clay is the MAOC (Cambardella and Elliot, 1992).
Table 1. Matrix table indicating relationships of conceptual SOM pools, their measurable fractions, and particle size fractions (Dumale et al., 2009)
Conceptual SOM pools**
** The term “pool” is used to refer to the theoretically separated, kinetically delineated components of SOM
*** The term “fraction” is used to describe measurable organic matter components associated with the pool
**** Silt and clay-sized particles were <53 m diameter based on the USDA Soil Texture Classification System
ISSN: 2094-1749 Volume: 3Issue: 2,2011
130
is attributed to the stabilization mechanisms through surface interactions (Baldock and Skjemstad, 2000; Lützow et al., 2006; Rumpel et al., 2002). The silt- and clay-associated C was
older in the light fraction (LF) and particulate organic matter (POM) (Haile-Mariam et al., 2008).
Further, the clay-associated residues have the highest mean residence times (MRT).
Most of the input of carbon to soil from different sources is subject to microbial attack, explaining the extra CO2 mineralization soon after addition to soil. A part, however, are retained and stabilized into the soil over long period of time. Previously, it was suggested that this extra CO2 originates from the labile SOC fraction. However, from more recent studies, it seems unlikely that only the labile pool is affected, since it cannot fully account for the extra CO2 released (Hamer and Marschner, 2005). The extra CO2 evolution can originate from the various pools of SOM (Kuzyakov, 2006). Some studies have found that organic matter (OM) application does not increase SOC (Foereid et al., 2004; Fontaine et al., 2004; Fontaine et al., 2003; Bell et al., 2003; Campbell et al., 1991). Others have reported gains in SOC after years of OM addition
to soil (Gerzabek et al., 2001; Gerzabek et al., 1997; Dalenberg and Jager, 1989).
We separated the soil microbial biomass carbon (SMBC) as a measure of the labile soil organic carbon using a modification of the fumigation extraction technique (Vance et al., 1987) and the
mineral-associated organic carbon (MAOC) fraction as a measure of the stable soil organic carbon using combined chemical dispersion and physical fractionation (Sherrod et al., 2005;
Haile-Mariam et al., 2008; Cambardella and Elliot, 1992).
Our objectives are to (1) determine the short–term influence of fresh organic matter (FOM) application on the dynamics of MAOC, and (2) study the dynamics of SMBC and CO2 evolution in soils applied with fresh organic matters. We hypothesized that although the MAOC is stable soil organic carbon due to physical protection in the silt and clay fractions, it does contribute to C turnover in the short-term, although conventionally believed to turn over in centuries to millennial time scales.
Materials and Methods
Soil sampling and FOM preparation
131
Table 2. Some physico-chemical properties of the Tsumagoi soil, Gunma Prefecture, Japan.
Depth (cm)
Soil texture
Particle density (gcm-3)
Bulk density (gcm-3)
Total C (gkg
-1
)
Total N (gkg-1)
C/N ratio
Land use/ Common vegetation
0–5 2.48 0.44 70.57 4.76 14.83
5–20
sandy
loam 2.48 0.5 88.9 5.7 15.6
Agricultural experimental field; cabbage
Incubation experiment
Transparent 500-mL glass bottles with plastic lid were used for incubation. (Figure 1). Three holes, one 12.5-mm diameter and two 10-mm diameter, were bored on the lid in triangular fashion. A “cock-rubber stopper” assembly, inserted into the 10-mm holes, served dually as air outlet of “old air” inside the bottles and air inlet of “new moist air” after every sampling day. This “cock-rubber stopper” assembly was made by inserting a three-way plastic cock (Top Corp., Japan) into a 14 x 15.5 x 10.5 mm rubber stopper.
Figure 1. The experimental unit. Acrylic tubing fitted with a septum mounted on cable grand
ISSN: 2094-1749 Volume: 3Issue: 2,2011
132
inlet and outlet “cock-rubber stopper” assembly (B); the triangular boring in the bottle lid (C); the “cock-rubber stopper” assembly (D); and the assembled experimental unit (E).
Also, a self-designed 35-mm length acrylic tubing sealed with a rubber septum was fitted in the 12.5-mm diameter hole in the bottle lid through a cable grand. This tubing served as the gas sampling port for CO2 evolution measurement. All assembled incubation bottles were tested leak-free by immersing in a pail of water.
Each experimental unit consisted of 20-g soil samples adjusted to 50% of the soil’s water-holding capacity. Incubation was conducted for 110 days at 20°C constant temperature. Prior to sealing each incubation bottle, FOM was evenly incorporated to the soil according to treatment rates. Experimental units allowed for three replicates per treatment on each sampling day. Parameters were measured by destructive sampling at 3, 13, 21, 44, 70, 85, and 110 days after FOM application. For MAOC, measurement was also conducted at day zero.
Separation and measurement of the MAOC fraction
Combined chemical dispersion and particle size separation methods based on the work of several authors (Sherrod et al., 2005; Haile-Mariam, et al., 2008; Cambardella and Elliot, 1992; Bell et al., 2003) were used to separate the combined silt- and clay-sized fractions which contain the MAOC.
On each sampling day, 5-g subsample was placed in 100-mL plastic bottle and dispersed with 50 mL of sodium hexametaphosphate (5 g/L). The suspension was shaken in a reciprocating shaker (Yamato shaker model SA-31, Yamato Scientific Co., Ltd., Japan) overnight at 240 rpm. The soil suspensions were sieved in a 53-µm screen (Tokyo Screen Co. Ltd., Japan). During sieving, the particles retained in the screen were repeatedly rinsed with distilled water to ensure thorough separation of the <53 m particle size fraction.
The resulting suspension was dried overnight at 70° C. The dried samples were finely ground manually using mortar and pestle and passed through an 80-µm sieve (Tokyo Screen Co. Ltd., Japan). MAOC was measured by dry combustion using a Sumigraph NC-90A NC analyzer (Sumika Inc., Japan).
Gas sampling and CO2 evolution measurement
Gas samples for CO2 evolution measurement were drawn from incubation bottles using a 10-mL plastic syringe (Nipro, Japan) fitted with 0.70 x 38.00 mm needle (Nipro, Japan). Transparent 7-mL capacity glass vials were used as sample containers. Prior to sampling, the vials were vacuumed by subjecting to 2 millibars suction for about 10 min and sealed with a rubber septum.
133
inlet and outlet cocks mounted in the bottle lid. The inlet cock was connected to an air source passing through a tank of distilled water to moisten the air and maintain moisture inside the
incubation bottles. The outlet cock was simultaneously opened while moist air flowed through
the inlet cock at 2.5 kgf cm-2 for 3 min to ensure flushing out of “old air” from the bottles.
SMBC fumigation, extraction, and measurement
The soil microbial biomass carbon (SMBC) fumigation and extraction technique used was
slightly modified from the fumigation-extraction method described by Vance et al. (1987). Each
sampling day, 5-g subsamples were placed in small Petri dishes and placed inside a glass
desiccator containing 40 mL of ethanol-free chloroform (CHCl3) in a small beaker. To enhance
vapor production, the beaker of CHCl3 was immersed in a cup of hot water. The desiccator was
sealed and placed in the dark at 25°C for 24 h. After 24 h the beaker of CHCl3 was removed, and
the residual CHCl3 vapor in the soil was removed by repeated evacuation using a vacuum pump
connected to the desiccator.
For extraction, the samples were transferred to 100-mL plastic bottles, diluted with 50 mL of
potassium sulfate (0.5 M K2SO4), and shaken in an oscillating shaker at 240 rpm. After 30 min,
the suspension was filtered using Whatman No. 42 filter paper followed by membrane filtration using 0.2-µm Millex syringe-driven filter units. A separate set of unfumigated samples was also prepared for use as control. The filtered samples were analyzed using a Total Organic Carbon Analyzer (Shimadzu TOC-VCSN, Shimadzu, Inc.). SMBC was calculated using the formula,
SMBC = 2.64Ec, where Ec is the difference between the organic carbon extracted from the
fumigated and non-fumigated samples (Vance et al., 1987).
Statistical treatment of data
Data were subjected to statistical analysis following the split-split plot design to compare and determine any significant differences between and among treatment means. The analysis of variance (ANOVA) was done using the SAS software (SAS Institute). Comparisons of means were done using the least significant difference (LSD) or the Duncan’s multiple range test (DMRT) where appropriate.
Results and Discussion
CO2 evolution rate and cumulative CO2 evolution
The addition of leaf litter and chicken manure increased the CO2 flux in soil (Figure 2). Soils that
received chicken manure had exceptionally higher CO2 production than did soils that received
leaf litter. The peak of CO2 production occurred during the first three days of incubation, except
for soils from the 0–5-cm layer that received chicken manure, which peaked at day 13 of
incubation. The 6–20-cm layer that received chicken manure exhibited the highest CO2
production, reaching as high as 122 mg kg-1 day-1 during the first three days after OM
application. In the 0–5-cm layer, CO2 production peaked at 74.6 mg kg-1 day-1 at 3 to 13 days
0–5-ISSN: 2094-1749 Volume: 3Issue: 2,2011 incubation period. For soils that received chicken manure, the carbon equivalent reached as high as 527 and 828 mg carbon kg-1 for the 0–5- and 6–20-cm layers, respectively.
0-5 cm No OM (control) 5-20 cm No OM (control) 0-5 cm Chicken manure 5-20 cm Chicken manure 0-5 cm Leaf litter 5-20 cm Leaf litter
Figure 2. Carbon dioxide evolution rate (mg kg-1 day-1) of Tsumagoi soil, Gunma Prefecture, Japan over 110 days of incubation following application of leaf litter and chicken manure.
Soils that received chicken manure produced 199.7% and 531.9% more CO2 than did controls from the 0–5- and 6–20-cm soil layers, respectively. Approximately, 32–64% of the total evolved CO2 was released during the first 21 days after FOM addition. In soils that received leaf litter, both the 0–5- and 6–20-cm layers had total evolved CO2 levels similar to those of the controls. Thus, in contrast to chicken manure, leaf litter has negligible effects on CO2 production when applied to soil. In the 0–5-cm layer, CO2 evolution rate in the control was highest 0–3 days after FOM addition (Table 3). Beyond this period, CO2 evolution rates were statistically lower until the end of incubation. CO2 evolution rates were comparable during the 4–110-day periods. This is exactly the trend in the leaf litter-applied 0–5-cm layer. In the chicken manure-applied soils, CO2 evolution rates significantly varied, and highest during the early stage of incubation (0–13 days after FOM addition), when rate was in the range 68.24 to 74.55 mg kg-1 day-1. Starting from two weeks after FOM application, CO2 evolution rate significantly dropped by more than half of the 4–13-day period level, decreasing with time until the end of incubation. From 14–110 days after FOM addition, evolution rates did not significantly differ.
135
also statistically the same. In the leaf litter-applied soils, CO2 evolution rate during the 0–3-day period (23.03 mg kg-1day-1) was significantly highest than anytime during the incubation period. Rates during the period 4–110 days after FOM application, ranging from 3.87 to 8.75 mg kg -1
day-1, were all statistically the same. In the chicken manure-treated soils, rates were significant from each other in the 0–3-, 4–13, and 14–21-day periods. Starting from 22 days after incubation, CO2 evolution rates did not vary significantly. These results were in agreement with earlier reports. Addition of manure increased CO2 flux of the soils and that the largest difference between manured and control soils occurred at week 1, when the manured soils had from 42 to more than 400 % higher CO2 fluxes (Calderon et al., 2004). Similarly, after a short lag phase (3 days) after cellulose addition, the cellulose decomposition followed an exponential dynamic until the rate of CO2 production had markedly decreased (at day 17) likely due to cellulose exhaustion (Fontaine et al., 2004). Conversely, cumulative values of evolved CO2-C increased rapidly from day 0 to 14, thereafter the increase was less for the rest of the incubation (Rudrappa et al., 2006). Maximum CO2 production rate in the urine+dairy farm effluent-applied soils incubated at 28° C was attained starting immediately after application until day 5 (Clough and Kelliher, 2005).
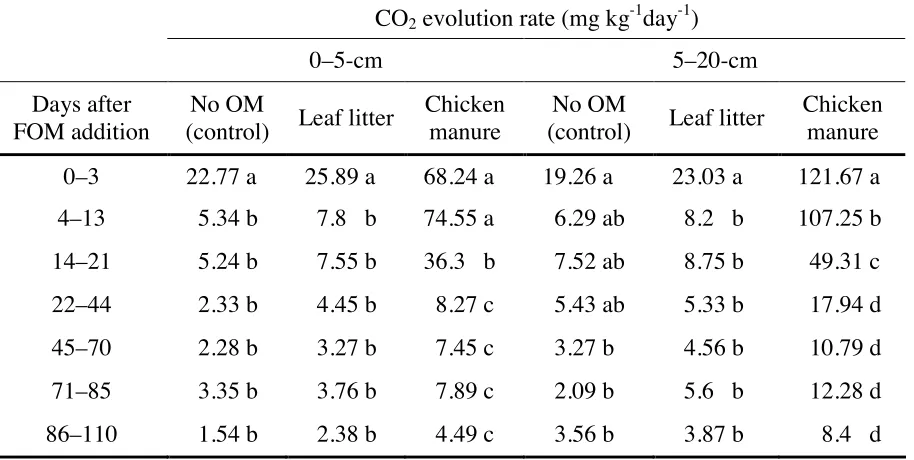
Table 3. Effects of time and fresh organic matter application on the CO2 evolution rate in the 0– 5- and 5–20-cm layers of Tsumagoi soil, Gunma Prefecture, Japan.
CO2 evolution rate (mg kg-1day-1)
0–5-cm 5–20-cm
Days after FOM addition
No OM
(control) Leaf litter
Chicken manure
No OM
(control) Leaf litter
Chicken manure
0–3 22.77 a 25.89 a 68.24 a 19.26 a 23.03 a 121.67 a
4–13 5.34 b 7.8 b 74.55 a 6.29 ab 8.2 b 107.25 b
14–21 5.24 b 7.55 b 36.3 b 7.52 ab 8.75 b 49.31 c
22–44 2.33 b 4.45 b 8.27 c 5.43 ab 5.33 b 17.94 d
45–70 2.28 b 3.27 b 7.45 c 3.27 b 4.56 b 10.79 d
71–85 3.35 b 3.76 b 7.89 c 2.09 b 5.6 b 12.28 d
86–110 1.54 b 2.38 b 4.49 c 3.56 b 3.87 b 8.4 d
In a column, means followed by different letters are significant at 5% level using DMRT
ISSN: 2094-1749 Volume: 3 Issue: 2, 2011
136 Sources of CO2 efflux from soils
According to Kuzyakov (2006), there are four main contributors to CO2 efflux classified as microbial: (1) microbial decomposition of soil organic matter in root free soil without undecomposed plant remains, frequently referred to as “basal respiration”; (2) microbial decomposition of soil organic matter in root affected or plant residue affected soil, called “rhizosphere priming effect” or “priming effect”; (3) microbial decomposition of dead plant remains; and (4) microbial decomposition of rhizodeposits from living roots, called “rhizomicrobial respiration”.
Root respiration is and the dissolution of calcium carbonate (CaCO3) also contributes to CO2 efflux from soils. However, this CaCO3 contribution during pedogenesis is only marginal since soil-CO2 flux measurements are usually done in sub-annual, annual, and decadal time scales.
Soil microbial biomass carbon
The soil microbial biomass as an active soil organic matter (SOM) fraction and agent of CO2 production in soil is divided into two main groups: heterotrophic and autotrophic organisms. The most important heterotrophs in the soil can be subdivided into two broad groups: (1) soil microorganisms (bacteria, fungi, actinomycetes and protozoans) and (2) soil macrofauna, the contribution of which to total CO2 efflux from soils is usually a few percent (Ke et al., 2005;
Konate et al., 2003; Andren and Schnurner, 1985). Most of the CO2 evolved by heterotrophic
soil organisms is respired by microorganisms such as bacteria, non-mycorrhizal and mycorrhizal fungi, and actinomycetes. This component of soil CO2 flux is collectively called microbial respiration (Kuzyakov, 2006).
137
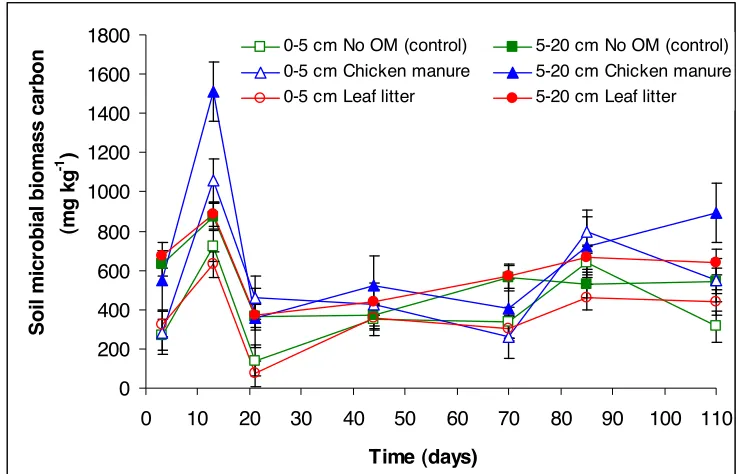
0-5 cm No OM (control) 5-20 cm No OM (control) 0-5 cm Chicken manure 5-20 cm Chicken manure 0-5 cm Leaf litter 5-20 cm Leaf litter
Figure 3. Changes in the soil microbial biomass (SMBC) (mg kg-1) of Tsumagoi soil, Gunma
Prefecture, Japan over 110 days of incubation following application of leaf litter and chicken manure.
The peak in SMBC at 13 days after the addition of FOM was followed by a drop at day 21. From day 21, different patterns in SMBC were observed. SMBC in the 0–5-cm layer of control and leaf litter-applied soils generally increased again at 44 days after incubation and peaked 85 days after FOM application while in the chicken manure-applied soil, SMBC continued to drop until day 70 and peaked at day 85. In 5–20-cm layer control, SMBC peaked at day 70, while for the leaf litter- and chicken manure-applied soils, SMBC continued to increase until the end of incubation.
ISSN: 2094-1749 Volume: 3Issue: 2,2011
138
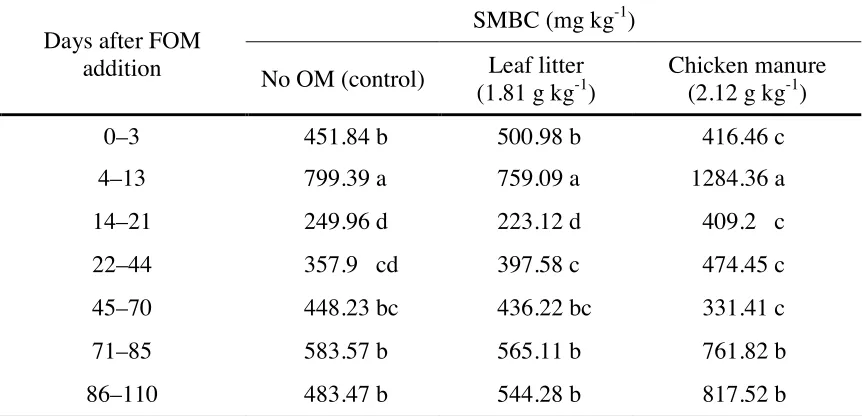
Table 4. Effect of time and fresh organic matter application on the soil microbial biomass carbon (SMBC) of Tsumagoi soil, Gunma Prefecture, Japan.
SMBC (mg kg-1)
Days after FOM
addition No OM (control) Leaf litter
(1.81 g kg-1)
Chicken manure (2.12 g kg-1)
0–3 451.84 b 500.98 b 416.46 c
4–13 799.39 a 759.09 a 1284.36 a
14–21 249.96 d 223.12 d 409.2 c
22–44 357.9 cd 397.58 c 474.45 c
45–70 448.23 bc 436.22 bc 331.41 c
71–85 583.57 b 565.11 b 761.82 b
86–110 483.47 b 544.28 b 817.52 b
In a column, means followed by different letters are significant at 5% level using DMRT
According to Fontaine et al., (2004) the supply of cellulose highly stimulated the microbial
activity. In their experiment, the production of unlabelled extra CO2 induced by glucose was
completed after 3 days and amounted to about 15-19 % of the microbial biomass-C. Further, the addition of cellulose as small as <5 % of the native soil C induced a two-fold increase of total biomass, which was not sustainable, since it decreased starting from day 21 until the end of
incubation. The soils amended with chicken manure showed exceptionally high CO2 production,
indicating the presence of readily available C for microbial consumption and cell division. This is revealed by the lower C/N ratio of the chicken manure compared to that of the leaf litter.
The occurrence of two distinct peaks in SMBC was seen in all treatments. The first SMBC peaks
occurred 13 days after FOM application. These peaks coincided with the period of high CO2
evolutions. Several authors stated the direct relationship between CO2 production and SMBC
(Kuzyakov et al., 2000). Similar results have been reported in previous studies (e.g. Calderon et al., 2004).
However, the timing of occurrence of the second SMBC peaks was different. The second SMBC peaks in the 0–5-cm depth occurred at day 70 in all treatments, while in the 5–20-cm layer, SMBC in chicken manure-applied soils continued to increase from day 70 until the end of incubation; the control had second peak at day 70 and the leaf litter-applied soil had sustained SMBC increase from day 22 until day 110.
139
The occurrence of a second peak suggests that soil microorganisms started to use an alternative source of energy, since the readily-available components of the applied manure could have been used up, leading to a drop in SMBC at 21 days after FOM application. In this scenario, although the actual microbial structure that caused the first SMBC peak was not identified, we propose that the dominant microbial structure that caused the first SMBC peak was different from that in the second peak.
Several authors observed similar trend in terms of the surge in SMBC early in the incubation period. Annual application of manure caused a rapid increase in SMBC following application and potentially mineralizable C reached maximum fluxes within a month after manure application (Lee et al., 2007). The microbial population is easily activated even by trace amounts of readily-available source of energy. Trace amounts of simple and easily degradable substances such as glucose or amino acids, and more complex soil and root extracts, could shift the soil microorganisms from dormancy to activity, causing more to be evolved as CO2 than was contained in the substrate (De Nobili et al., 2001). This response of the microbial biomass is presumably in anticipation of the coming of a bigger source of energy available for further reproduction and respiration. This could partly explain the response of SMBC almost immediately after FOM application. In conditions without any external application of readily-available substrates, favorable conditions of soil moisture or aeration would trigger this initial microbial response.
Kinetics and dynamics of the mineral-associated organic carbon
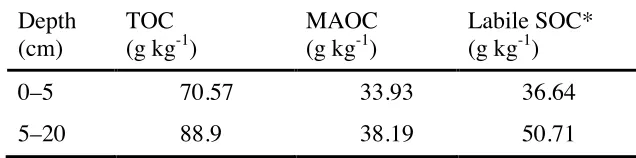
Original MAOC level was lower in the 0–5-cm layer (33.93 g kg-1) than in the 5–20-cm layer (38.19 g kg-1) of the Tsumagoi soil (Table 5).
Table 5. Initial total organic carbon (TOC) and mineral-associated organic carbon (MAOC) of the 0–5- and 5–20-cm layers of Tsumagoi soil, Gunma Prefecture, Japan.
Depth (cm)
TOC (g kg-1)
MAOC (g kg-1)
Labile SOC* (g kg-1)
0–5 70.57 33.93 36.64
5–20 88.9 38.19 50.71
* TOC less MAOC
ISSN: 2094-1749 Volume: 3 Issue: 2, 2011
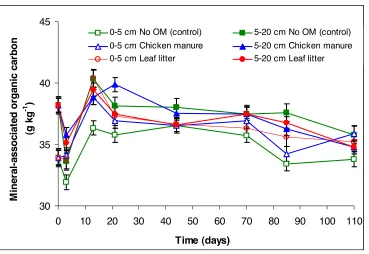
0-5 cm No OM (control) 5-20 cm No OM (control) 0-5 cm Chicken manure 5-20 cm Chicken manure 0-5 cm Leaf litter 5-20 cm Leaf litter
Figure 4. Mineral-associated organic carbon (MAOC) (g kg-1) of Tsumagoi soil, Gunma Prefecture, Japan over 110 days following application of leaf litter and chicken manure.
Results showed that the mineral-associated organic carbon changes from time to time within a short time scale, indicating that there are sites within the mineral phase that are accessible to the microorganisms. It may be safe to say that the mineral phase is also continually interacting with the soil organic matter, as indicated by the significant differences in MAOC at particular time periods.
Between measurement dates during the incubation period, “add and subtract” changes in the MAOC particularly in the early stage of incubation were observed. These changes could have been due to the labile SOM that moves and associates with the particle size fractions. SOM is a continuum of materials from very young to very old with ongoing transfers between pools (Haile-Mariam et al., 2008). This means that SOM moves between particle size fractions. Owing
to artificial, biological, and other pedoturbations, the transfer of SOC between the particle size fractions is a continuous process in the soil continuum. However, it is assumed that the transfer of SOC from the silt- and clay sized fractions should be less than the transfer from the sand fractions to the finer-sized fractions, due to the physical protection of SOM by the silt and clay fractions (Hassink, 1997; can Veen and Kuikman, 1990). The organo-silt and organo-clay fractions in FOM are slow to mineralize due to physical protection (Mando et al., 2005). This
could result to the heterogeneity of SOC in the fine soil fractions because SOC from the sand-size fraction, from where SOM moves to the silt- and clay-sand-sized fractions, is dominated by particulate plant material that has a lower extent of decomposition (Guggenberger et al., 1995)
141
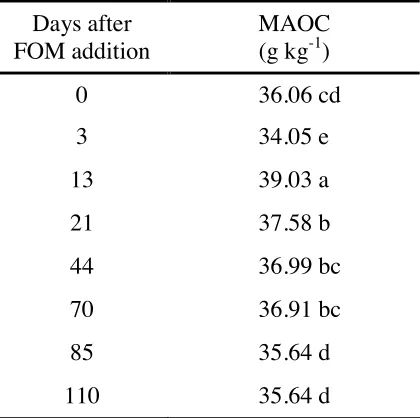
Most notable was the significant decline of the MAOC three days after FOM addition compared with the day zero level (Table 6). Two possible fates of the lost MAOC can be interpreted – (1) some microbial structures utilized this MAOC for microbial cell division, and (2) microbial degradation to CO2. This cannot be verified using the experimental design used in this
experiment because to prove this may require isotopic fractionation of evolved CO2 and
comparing the isotopic signature of the MAOC. This finding, however, proved that the stable MAOC may be a source of microbial energy in the short-term, although this stable fraction is conventionally believed to have long mean residence and turnover times.
Table 6. Effect of time on the mineral-associated organic carbon (MAOC) of Tsumagoi soil, Gunma Prefecture, Japan.
Days after FOM addition
MAOC (g kg-1)
0 36.06 cd
3 34.05 e
13 39.03 a
21 37.58 b
44 36.99 bc
70 36.91 bc
85 35.64 d
110 35.64 d
Means followed by different letter(s) are significant at 5% level by DMRT
Conclusions
The occurrence of second SMBC peaks in this experiment involving one-time only addition of fresh organic matters is very meaningful, and suggests a shift in the microbial community structure as the readily-available substrates from FOM became exhausted a few days after application. This suggests that the new soil microbial biomass growth found energy from a new source, which could be the MAOC, a stable SOM fraction. Regarding this process, it is suggested that most energetic compounds of FOM are used by r-strategist microorganisms that only decompose FOM. K-strategists arise only in the later stage of the FOM decomposition process when energy-rich compounds have been exhausted and only polymerized compounds remain (Fontaine et al., 2003).
Our finding of a significant MAOC decline three days after FOM application puts into question the convention that only the labile SOC contributes to CO2 evolution in soils applied with FOM.
ISSN: 2094-1749 Volume: 3Issue: 2,2011
142
as such. This could have big impact on the overall terrestrial carbon dynamics if the most stable SOC with long turnover times are lost in exchange of the less stable SOC that moves into the fine soil fractions during carbon input to soil.
References
Andren, O., and J. Schnurer, 1985. Barley Straw Decomposition with Varied Levels of Microbial Grazing by Folsomia fimetaria(L.) (Collembola isotomidae). Oecologia, 68: 57–62.
Baldock J. A., and J. O. Skjemstad, 2000. Role of the Soil Matrix and Minerals in Protecting Natural Organic Materials Against Biological Attack. Organic Geochemistry, 31:697–710. Bell, J. M., J. L. Smith, V. L. Bailey, and H. Bolton, 2003. Priming Effect and C Storage in
Semi-arid No-till Spring Crop Rotations. Biology and Fertility of Soils, 37:237–244.
Calderon F. J., G. W. McCarty, J. A. S. van Kessel, J. B. Reeves, 2004. Carbon and Nitrogen Dynamics during Incubation of Manured Soil. Soil Science Society of America Journal, 68:1592–1599.
Cambardella, C. A., and E. T. Elliot, 1992. Particulate Soil Organic Matter Changes Across a Grassland Cultivation Sequence. Soil Science Society of America Journal, 58:1167–1173. Campbell, C. A., G. P. Lafond, R. P. Zentner, and V. O. Biederbeck, 1991. Influence of Fertilizer
and Straw Baling on Soil Organic Matter in a Thick Black Chernozem in Western Canada. Soil Biology and Biochemistry, 23:443–446.
Clough T. J., and F. M. Kelliher, 2005. Dairy Farm Effluent Effects on Urine Patch Nitrous Oxide and Carbon Dioxide Emissions. Journal of Environmental Quality, 34:979–986.
Dalenberg, J. W., and G. Jager, 1989. Priming Effect of some Organic Additions to 14C-labelled
Soil. Soil Biology and Biochemistry, 21:443–448.
De Nobili, M., M. Contin, C. Mondini, and P. C. Brookes, 2001. Soil Microbial Biomass is Triggered into Activity by Trace Amounts of Substrate. Soil Biology and Biochemistry, 33:1163–1170.
Dumale, W. A. Jr., T. Miyazaki, T. Nishimura and K. Seki, 2009. CO2 Evolution and Short-term
Carbon Turnover in Stable Soil Organic Carbon from Soils Applied with Fresh Organic Matter. Geophysical Research Letters. 36:L01301.
Foereid, B., A. de Neergaard, and H. H. Jensen, 2004. Turnover of Organic Matter in a
Miscanthus field: Effect of Time in Miscanthus Cultivation and Inorganic Supply. Soil
Biology and Biochemistry, 36:1075–1085.
Fontaine S., G. Badoux, L. Abbadie, and A. Mariotti, 2004. Carbon Input to Soil may Decrease Soil Carbon Content. Ecological Letters, 7:314–320.
Fontaine S., A. Mariotti, and L. Abbadie, 2003. The Priming Effect of Organic Matter: A Question of Microbial Competition? Soil Biology and Biochemistry, 35:837–843.
Gerzabek, M. H., G. Haberhauer, and H. Kirchman, 2001. Soil Organic Matter Pools and Carbon-13 Natural Abundances in Particle Size Fractions of a Long-term Agricultural Field Experiment Receiving Organic Amendments. Soil Science Society of America Journal, 65:352–358.
143
Guggenberger, G., W. Zech, L. Haumaier, B. T. Christensen, 1995. Land-use Effects on the Composition of Organic Matter in Particle-size Separates of Soils: II. CPMAS and Solution
13
C NMR Analysis. European Journal of Soil Science, 46:147–158.
Haile–Mariam, S., H. P. Collins, S. Wright, and E. A. Paul, 2008. Fractionation and Long–term Laboratory Incubation to Measure Soil Organic Matter Dynamics. Soil Science Society of America Journal, 72:370–378.
Hamer, U., and B. Marschner, 2005. Priming Effects in Soils after Combined and Repeated Substrate Additions. Geoderma, 128:38–51.
Hassink, J., 1997. The Capacity of Soils to Preserve Organic C and N by their Association with Clay and Silt Particles. Plant and Soil, 191:77–87.
Ke, X., K. Winter, and J. Filser, 2005. Effects of Soil Mesofauna and Farming Management on Decomposition of Clover Litter: A Microcosm Experiment. Soil Biology and Biochemistry, 37:731–738.
Konate, S., X. Le Roux, B. Verdier, and M. Lepage, 2003. Effect of underground Fungus-growing Termites on Carbon Dioxide Emission at the Point- and Landscape-scales in an African Savanna. Functional Ecology, 17: 305–314.
Kuzyakov, Y., 2006. Sources of CO2 Efflux from Soil and Review of Partitioning Methods. Soil
Biology and Biochemistry, 38:425–448.
Kuzyakov, Y., J. K. Friedel, and K. Stahr, 2000. Review of Mechanisms and Quantification of Priming Effects. Soil Biology and Biochemistry, 32:1485–1498.
Lee, D. K., J. J. Doolittle, and V. N. Owens, 2007. Soil Carbon Dioxide Fluxes in Established Switchgrass Land Managed for Biomass Production. Soil Biology and Biochemistry, 39:178–186.
Li, L. X. Zhang, P. Zhang, J. Zheng and G. Pan, 2007. Variation of Organic Carbon and Nitrogen in Aggregate Size Fractions of a Paddy Soil under Fertilization Practices from Tai Lake Region, China. Journal of Food Science and Agriculture, 87:1052–58.
Lützow, M. V., I. Kgel–Knabner, K. Ekschmitt, E. Matzner, G. Guggenberger, B. Marschner
and H. Flessa, 2006. Stabilization of Organic Matter in Temperate Soils: Mechanisms and their Relevance under Different Soil Conditions – A Review. European Journal of Soil Science, 57:426–45.
Mando, A., B. Quattara, A. E. Somado, M. C. S. Woperis, L. Stroosnijder, H. Breman, 2005. Long-term Effects of Fallow, Tillage and Manure Application on Soil Organic Matter and Nitrogen Fractions on Sorghum Yield under Sudano-Sahelian Conditions. Soil Use and Management, 21:25–31.
Mtambanengwe, F., P. Mapfuno, and H. Kirchmann, 2004. Decomposition of organic matter in soil as influenced by texture and pore size distribution. In Managing nutrient cycles to sustain soil fertility in sub-Saharan Africa Ed., Bationo, A. Centro Internacional de Agriculture Tropical. pp: 261–276.
Ohm, H., U. Hamer, and B. Marschner, 2007. Priming Effects in Soil Size Fractions of a Podzol Bs Horizon after Addition of Fructose and Alanine. Journal of Plant Nutrition and Soil Science, 170:551–59.
Parton W. J., J. W. B. Stewart, and C. V. Cole, 1988. Dynamics of C, N, P, and S in Grassland Soils: A Model. Biogeochemistry, 5:109–131.
ISSN: 2094-1749 Volume: 3 Issue: 2, 2011
144
Rudrappa L., T. J. Purakayastha, D. Singh, and S. Bhadraray, 2006. Long-term Manuring and Fertilization Effects on Soil Organic Carbon Pools in a Typic Haplustert of Aemi-arid Sub-tropical India. Soil Tillage and Research, 88:180–192.
Rumpel, C., H. Knicker, I. Kgel-Knabner, J. O. Skjemstad and R. F. Huttl, 1998. Types and
Chemical Composition of Organic Matter in Reforested Lignite-rich Mine Soils. Geoderma, 86:123–142.
Sherrod L. A., G. A. Peterson, D. G. Westfall, and L. R. Ahuja, 2005. Soil Organic Carbon after 12 Years in No-till Dryland Agroecosystems. Soil Science Society of America Journal, 69:1600–1608.
van Veen, J. A., and P. J. Kuikman, 1990. Soil Structural Aspects of Decomposition of Organic Matter by Microorganisms. Biogeochemistry, 11:213–233.
Vance, E. D., P. C. Brookes, and D. S. Jenkinson, 1987. An Extraction Method for Measuring Soil Microbial Biomass C. Soil Biology and Biochemistry, 19:703–707.