variability
and
uncertainty
in characterizing
Emission
Rates of
Heavy-Duty
Diesel
Construction
Equipment
Heni FITRIANII, Apif M. HAJJI2& Phil LEWIS3 lDepartment of Civil Engineering, Sriwijaya University
Jl Raya Prabumulih KM 32,lndetalaya, Ogan Ilir, Palembang, Indonesia Email: henifi [email protected]
zDepartment of Civil Engineering, Malang State University Jl. Semarang No' 5, Malang 65145,Indonesia
Email : api f.hajj i@okstate'edu
3civil Engineering and Environmental Department, oklahoma State University 214A Engineering South, Stillwater, Oklahoma
Email: [email protected]
Abstract. Nowadays,air pollution has become
a
major concern. Typicallyconstruction equipment plays a major role in emitting a huge amount of pollutants. In order to address this issue, there is a need to measure the level ofuncertainty for decision making of air quality modeling and emission inventories' This paper aims
to propose a methodology for quantifuing uncertainty of emission rates of heavy-duty diesel (IIDD) consffuction equipment. The objective of this paper is to quantifu the variability and uncertainty of emission rates of HDD construction equipment for three different pollutants (NO*, CO, and HC). The study conducts its study based on 17 backhoes obtained from the City
of
Stillwater's fleet management database. Horse power (IIP), cumulative hours, activity factor, and emission factors at steady-state condition are assigned as uncertain variables. Monte Carlo simulation was usedto model the distributions of the uncertain variables by randomly selecting input values to produce a wide range of output using cumulative distribution functions. A sensitivity analysis was also performed in order to determine which variables that have the greatest impact on the total emission rates.
Keywords: variability; uncertainty; Heavy-Duly Diesel
(HDD)
Construction Equipment; Monte Carlo Simulation; emission rates1
Introduction
Today, air pollution has become a major concern. Construction activities contribute
a significant amount of pollutants emitted to the environment. Approximately l.l.oh
of total US greenhouse gas emissions are produced by the conitruction works.rln
'ppa (zoog)
most construction activities, construction equipment
is the
primary sourcesof
emissions for oxides of Nitrogen
(No-),
carbon Monoxide(co),
Hydro carbon(HC), Particulate Matter (PM), and carbon Dioxide
(cor).
A
study conducted init.,. Unit.a States shows that construction equipment emits 30o/o of nitrogen oxides
(NO.) and 65%o
of
particulate matter.2Many
studieshave
been conductedin
quantifying emission estimatesof
construction equipment for different pollutants. Sorne studie-! quantified emissions
of construction'equipment based on real-world in use data.3a56These studies heavily relied on deterministic approach using a single value or a point estimate' However,
due to uncerlainty in quantifying emission rates of HDD construction equipment,
there is a need to measure the level of uncertainty for risk analysis with respect to human health problems. Probabilistic method is one of the techniques that can be
used
to
quuniify variability and uncefiainty. Apparently, thereis
substantialrrncertainty in quantifying emissions
of
HDD construction equipment. Failure toconsider uncertainties
in
emission ratesof
construction equipment may lead towrong decisions especially in quantifying emission inventory.
Several researches have also been conducted
in
assessing the uncerlainty andvariabitity
in
emission estimates. Frey et.al[7,8]
assignedthe
uncertaintyof
emissions for non-road category of lawn and garden equipment. Aziz et.al [9] has presented a method
for
quantifying the unceftainty and variabilityfor
emissionLstimates
with
respectto
hazardousair
pollutants.The
study
focused onquantifying emissions for NO, and HC fiom construction, farm, industrial engines
and coal-fired por.ver plants. The errission of construction equiprnent using discrete event simulation was also developed b1'' Pan [8]. However, little research has been
done
in
quantifyingthe
variability' and uncerlaintyof
etnissionsfrom
HDDconstruction equipment
for
different pollutants. This paper aimsto
propose agrethodology for qLrantifying the uncertainty of emission rates of HDD construction equipment. The objective of this paper is to quantify the variability and uncertainty
of emission rates of HDD construction equipment for each pollutant and identify key sources of unceftainty in the emission inventories. This paper fully highlights the emission rates quantification for NO*, CO and HC'
voriobility ond Unceriointy in chorocterizing Emission Rotes of Heovy.. 327
'ppe caRec (zooo)
3Frey et.al (2008)
alewis (2009)
5Lewis
et. Al (2012) 6Abolhasaniet. Al (2008)
2
Methodologyln
this study, Monte Carlo simulationis
utilizedto
evaluatethe variability andunceftainty
of
emission ratesof
HDD construction equipment. An emission rateequation was established based
on
Environmental Protection Agency's (EPA)Nonroad model. A sensitivity analysis is also conducted.
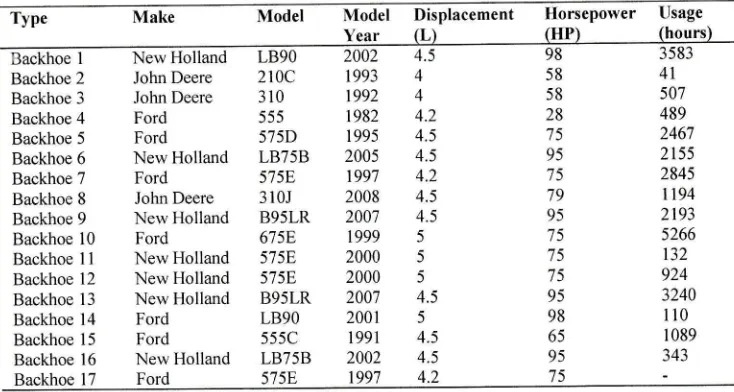
Table 1 summarizes equiprnent attribr.rtes
of
i7
backhoes examined from the Cityof
Stillwater's fleet manatement database. The data consistof
equipment brand(make), rnodel, model year, displacement, engine size (horsepower), and usage
hours. lt is imporlant to note that most backhoes are over 10 years old. Table 1 Summary of Equipment Attributes
Nlodel llodel
Displacement llorseporver llsageType
Make
Nlodel \lodel
Displacement tlorsepower l-rsageYear (L)
(HP)
(hours)3 Backhoe
2
JohnDeere 2l0C
1993
458
4158
50728
48915
246195
215515
284579
I 194Backhoe
3
JohnDeere
3,l0 555Backhoe
6
NewHolland
LB75B 2005
4 5 Backhoe8
JohnDeere 310J
2008
4.5Backhoe
9
Neu,HollandB95LR 2007 4.5
95 2193 5266 132Backhoe
12
NewHolland 5758
2000 5
'75
924Backhoe
13
NewHolland
B95LR 2007 4.5
95
32401992
1r
982
4.2Backhoe
4
FordBackhoe
5
Ford575D 1995
4.5Backhoe
7
Ford515E 1997
4.2Backhoe
l0
Ford6758 1999 5
75 Backhoe II
NervHolland
575E
2000 5
75Backhoe
14
FordBackhoe
15
FordLB90 2001
5555C l99l
4.598
ll0
65
1089Backhoe
16
NewHollald LB75B 2002 4.5
95
343 Backhoe17
Ford 57581997
4.2In
orderto
calculate the emission rates for HDD construction equipment, EPANonroad model was used as the basis for estimating the emission factors for NO*, CO, and HC.Similarly, the data for emission factor at steady state condition (EF..), transient adjustment factors (TAF), activity factor (A), cumulative hour (CH), load
factor
(LF)
and medianlife
(ML)
were obtained from EPA Construction FleetInventory Guide (EPA, 2010a, b and c).
Emission factor at steady state condition (EF..)
is
defined as a functionof
theengine's model year and engine size (horse power rating).
In
addition, transientadjustment factors are considered as the fraction of the transient emission factor to the steady-state emission factor.
Voriobility ond Uncertointy in chorocterizing Emission Rotes of Heovy.' 329
The equation for the emission rate model is defined as follows:
(1)
ER
=
EFss x TAFx HP x [1*
SHPf
:
activity factor (hr/yr):
cumulati ve hours (hours):
zero-hour, steady-state emission factors (grlhp-hr) = emissions rates for NOx. HC and CO (g/hr):
engine size (hp):
load factor (unitless):
median life (hours):
transient adjustment factor (unitless) where:A
CH
EF.,, ER
HP LF ML
TAF
The pollutants that are under consideration are NOx, CO, and HC. Monte Carlo
simuiation was conducted by using software @Risk. Monte Carlo Simulation was
used
to
enable modeling unceftain input variablesto
produce a wide rangeof
outputs using probability distribution functions.
Empirical distribr-rtions
orparametric
distribr-rtions
for
important
parametersweIe
employed'Therefore, specifyipg distribr-rtions
fol'
a1l
or
mostvariables
in
aMonte
Carlo analysis
1s r-rsefulfor
exploring
at'rdcharacterizing
thefull
range
of variability
and
uncertaittty.
The choice
of
lnputdistributlon
should
always
be
basedon
al1
information
available
for
a
parameter.
\Yhendata
for
an
important
parameterare
limited,
it
maybe
necessaryto
use subjective
judgmentin
estimating
theprobability
distribution
functions
of
input
parameters.Based on fitted distribution function using @Risk, the probability distribution
functions for each random variable are defined. Table 2 sumtnarizes all parametric
distribution f-lt data
for
random variables that include horse power, cumulativehours, and median
life.
These data are applied to quantify the emission ratesof
NO*, CO, and HC. The data
for
EF,,, transient adjustment factor (TAF), andactivity factor
(A)
are typically different depending on the typesof
pollutants(Table 3). Meanwhile, load factor is similar for specific type of equipment.
Table 2 Summary of input variables
Random variables Distribution Function Parameters
Horse power (HP) Cumulative hours
RiskTriangular RiskTriangular
(88,98, r08)
Median life (hr) Risklognormal (4667 , 100/o*4667)
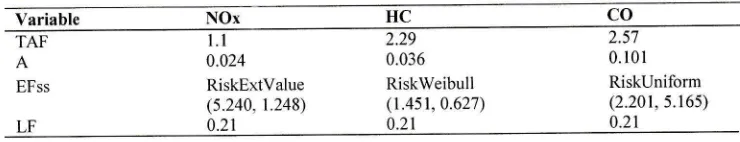
Table 3 Summary of input variables
Variable NOx
TAF A
EFss
LF
l.l
0.024 RiskExtValue (5.240. 1.248) 0.21
2.29 0.036
RiskWeibull (1.45r,0.627)
0.21
2.5'7 0.t01 RiskUnifbrm (2.20r,5.165)
0.21
Statistical goodnes s-of-fit tests including Chi-S quares (C S), Kolmo gorov-Smirnov
(KS) and Anderson-Darling (AD) are used to evaluate goodness-of-fit of random
variables
or
unceftainties. Based on the analysis, Chi-Squares (CS) appears toadequately
fit
the dataset.Furtherrnore, parametersfor
each random variable are variad depending on the probability distribution functions as indicated by mean and standard deviation. Based on the equation (1), models were then developed. MonteCarlo simulation was conducted to generate the data points using software @Risk
with particular iterations. Similarly,statistical goodness-of-fit tests were also used
to evaluate the goodness-otfit of the outputs presented in cumulative distribution
functions. Moreover, descriptive statistics
of
the outputs that include minimum,m€ximum, mean and standard deviation values were demonstrated. Sensitivity
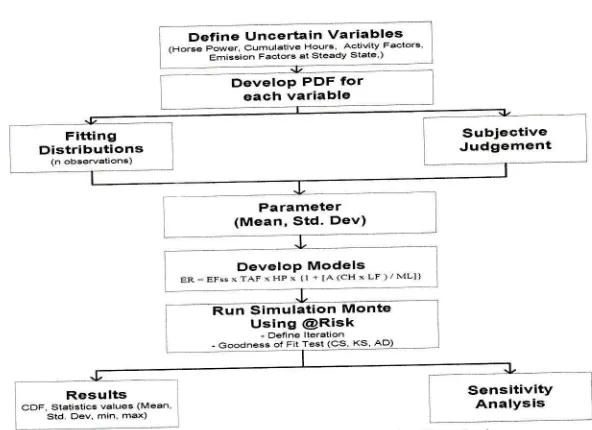
analysis was further explained. Figure
I
briefly presents the overall procedure forMonte Carlo Simulation.
Voriobiliiy ond Uncertointy in chorocterizing Emission Rotes of Heovy" 331
3
Results and DiscussionThis
section demonstratesand
evaluatesthe
variability and
uncertainty inquantifying emission rates
of
HDD
construction equipment.variability
anduncertainty
in
the
emission ratesare
assigned using parametric probabilitydistributions. Using fittecl distribution functions provided
by
software @Risk,parameters of each-uncertainty is measr-tred. Seventeen data points are generated by iO,OOO iterations to best estimate the probability distribution function of outcome'
Descriptive statistics such as minimum, maximum. mean and standard deviation
values are provided from the simulation.
Based on the analysis, emissionrates for each pollutant vary depending on the input variables as shown in Figures 2-4.Fot example. emission rates forNOx, CO, and
HC are within the
rangelrzos
gihrto1805 g/hr,519gihrtol43l
g/hr, and 34 glkrto73 1 g/hr, respectivelY'
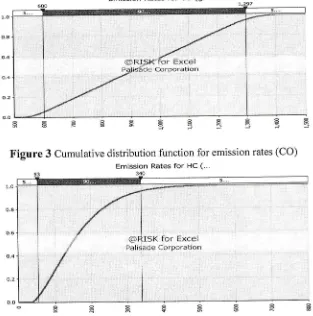
Figure 2 shows the cumulative distribution function for emission rates for NOx' It
can be seen that the range of emission rates is betrveen 268 glhr and 1805 g/hr'
Basically, this means tnaLgSN of the emission rates of NOx are less than973
lht
or, g0% of confidence interval is in the range of 416 g/hr to 913
lhr.
Define Uncertain Variables/Horse Power, Cumulatlve Hours Actlvity Facto's' Emission Factors at Steady State,)
DeveloP PDF for each variat le
DeveloP Models
ER EFss\TAFiHP\ {l + JA(CH\ LF)/NJLI)
Results
cDF. Statistlcs valueg (Mean, Std. Dew, min, max)
Figure
lProcedure for Monte Carlo Simulation1.O
o.8
o.6
0.4
o.z
o.o
Emission Rates for N()x (9...
I
,
.
(oR. Palis
I
It
{*
ISK for Excel rcle Corporation
Figure 2 cumulative distribution function for emission rates (Nox)
1.O
o,a
o.6
o.4
o.?
o.o
Emission Rates for CO (S...
Figure 3 Cr-rmulative distribution function for emission rates (CO) Emission Rates for HC (...
REEEE.E.E
€gEEFEHE?E.A
-=
1.O
o.a
0.6
0.4
o.2
o.0
OEEEEHEE
Figure
4 Cumulative distribution function for emission rates (HC)Voriobility ond Uncertqinty in chorocterizing Emission Rotes of Heovy.. 333
Emission rates for
co
were found to be greater thanNox
and HC for each gram emissions per hour. Emission rates for HC are the lowest among otherpollutants-As can be seen in Figure
3,g5o
of the emission rates forco
are less than 1300 g/hp. Ho*euer, emisJion rates for HC are within the ranges 53 glhr up to 340 g/hrior-9}%confidence interval. Detail summary statistics are presented in Table 4'
Table 4 Summary statistic of emission rates
Attributes NOx HC(g/hr)
34
Minimum Maximum
Mean Std. Deviation
268
1805 645 175
5t9 143
i
944223
'731 164 90.43
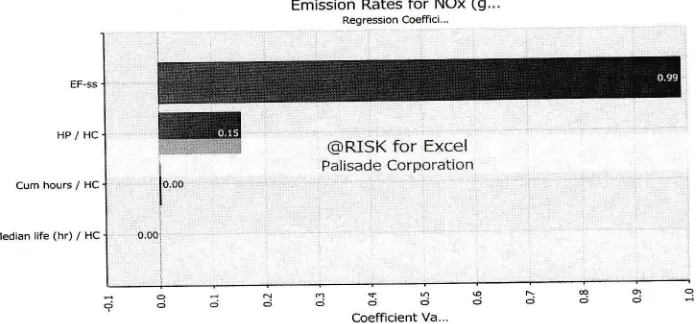
implementing sensitivity analysis
which is based on rank correiation. To illustrate how sensitive each random input
variable
is to
the outputs, Figure5
briefly explains the sensitivity analysisof
emission factors for NOx. Based on the analysis, emission factor at steady-state (EF-ss) is the most sensitive variable to the total emission rates. The higher the value of EF-ss is, the higher the value of emission rates for NOx. Horse power is
the second most sensitivi variable that affects the total emission rates. Meanwhile
cumulative hours and median
life
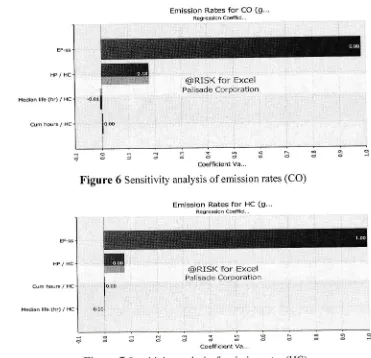
are not significant given the emission rates'Similarly, the emission rates for HC and CO follow the same trends as shown in
Figures 6 and7 respectivelY.
EF-ss
HP/ HC
Cum hours / HC
Median iife (hr) / Hc
Ynq
Coefflcient Va...
Figure 5 Sensitivity analysisof emission rates Q''fox)
8. Environmentol Protection ond Monogement Emission Rates for NOx (9...
Emission Rates for CO (S..
Regression Coeffici-..
G)RISK for Excel
Palisade Corporation
Figure 6 Sensitivity analysis of emission rates (CO)
Emission Rates for HC (S...
Regresslon Coeffici...
EF-ss
NP/HC
Median life (hr) / HC
Cum hours / HC
EF_ss
HPlHC
Cum hours / HC
Median life (hr) / HC
h9 ::;;;dcioj
Coefficient Va...
m
I
lo.@
=3:=:::E:=
coefflcient va...Figure 7 Sensitivity analysisof ernission rates (HC)
4
ConclusionsThis paper presented a procedure for quantifying the variability and uncertainty in
emissions
of
heavy-duty diesel(HDD)
construction equipment. Monte Carlosimulation is developed to enable modeling uncertain input variables to produce a
wide range of output using probability distribution functions. The results show that emission rates for CO were found to be greater than NOx and HC for each gram emissions per hour.
It
is shown thatgSoA of the emission rates are less than 1300glhr,973 g/hr and 340 glhr for CO, NOx and HC, respectively. (oRISK for Excel
Palisade Corporation
voriobility ond Unceriointy in chorocterizing Emission Rotes of Heovy..
Based
on
sensitivity analysis, emission factorsat
steady-state condition arerecognized as the most sensitive variable given the total emission rates for each
type-of pollutant. Engine size is the second influential variable in total emission
#es.
Cumulative ho"urs and medianlife
are foundbe
less sensitiveto
total emission rates for NOx, HC and CO.A
key difficulty encountered in this study was to obtain a particular probabilitydistritution function for each input uncertain parameter. This may be due to the
limited amount
of
data and someof
the assumptions usedin
developing thernodels. However, this research may contribute
to
the importanceof
assigningvariability and uncefiainty
of
emission rates which is very criticalfor
emissioninventory decision-making.
5
AcknowledgementThe authors express gratitude to Mr. David Higgins and Mr. John Maehs with the
city of
Stillwaterfor
their
suppoft and cooperationin
providing the dataof
Stillwater Fleet Construction Equipment.
References
Environmental Protection
Agency (EPA).
Potential
for
reducinggreenhouse gas emissions in the construction sector. National Construction Sector, Sector Strategies Program, U. S. Environmental Protection Agency: Washington, DC, U.S, 2009.
Environmental Protection Agency Clean
Air
Act
Advisory Committee(EPA CAAAC).
Recommencationsfor
reducing emissionsfrom
theLegacy Diesel Fleet. U.S. Environmental Protection Agency, Washington D. C,
ti.
s,2006.Frey, H. C., Rasdorf, W., Kim, K., Pang, S.-h', Lewis,P., &, Abolhassani,
S. Real-World Duty Cycles and Utilization for Construction Equipment in
North
Carolina. Raleigh,NC:
Dept.
of
Civil'
Construction, and E,nvironmental Engineering, North Carolina State University, 2008'Lewis,
P.
Estimatingfuel
use and emission ratesof
nonroad dieselconstruction equipment perJorming representative duQ cycles. Doctor
of
Philosophy, Norlh Carolina State University, Raleigh, NC, 2009. 6
t1l
l2l
t3l
t4l
t5]
Lewis, P., Leming, M.,&
Rasdorf, W' Impact of engine idling on fuel use and CO2 emissions of nonroad diesel construction equipment. Journalof
Manage ment in Engineering, 2 B(1), 3 | -38, 2012.t6]
Abolhasani, S., Frey, H. C., Kim,K',
Rasdorf, W., Lewis, P.,&
Pang,S'-H.
Real-World In-Use Activity, Fuel Use, and Emissionsfor
NonroadConstruction Vehicres: A Case Study for Excavators. Journal of the
Air
&Ifaste Management Association, 58(8), 1033-1 046, 2008.
t7l
Frey, H.C., and S. Bammi .Quantification of Variability and Uncertainty inLawn and Garden Equipment
NOx
andTotal
Hydrocarbon Emission Factors.Journal of theAir
&
waste Management Association, 52(4):435-448,2002.i8]
Frey, H.C., and S. Bamrni. Probabilistic Nonroad Mobile Source EmissionF actor s.J o urn al of E nv i r onm e n t a I En gi n e er i n g, 1 29 (2) : 1 62 -1 68, 2003'
t9l
Aziz,A.,
and H.C. Frey. Quantificationof
Hourly Variabilityin
NOxErnissions
for
Baseload coal-Fired Power Plants.Journalof
theAir
&Was te Management Association, 2003.
t10]
Pan,w.
The Application of simulation Methodologies on Estimating Gas Emissions from Construction Equipment. Master of Science, Universityof
Albefta, Edmonton, Alberla, 201 1.
tl1l
EPA. Construction Fleet InventoryGuide.
EPA-420-B-10-025, U.S.Environmental Protection Agency, Inc., Ann Arbor, MI,2010a.
t12)
EPA.Exhaustand
Crankcase Emission Factorsfor
Nonroad EngineModeling -Compression-Ignition. EPA-420-R-10-018, NR-009d, U.S. E,nvironmental Protection Agency, Ann Arbor, MI, (2010b).
t13]
EPA.Median Life, Annuat ActiviQ, and Load Factor valuesfor
NonroadEngine
EmissionsModeling.
EPA-420-R-10-016, NR-005d, U.S. Environmental Protection Agency, Ann Arbor, Ml,(2010c).