Ž .
Journal of Applied Geophysics 45 2000 187–202
www.elsevier.nlrlocaterjappgeo
Geoelectric investigations in Bakreswar geothermal area,
West Bengal, India
R.K. Majumdar
), N. Majumdar, A.L. Mukherjee
Department of Geological Sciences, JadaÕpur UniÕersity, Calcutta 700 032, India Received 27 January 1999; accepted 4 August 2000
Abstract
A cluster of hot springs in Bakreswar geothermal area, which belongs to the Chotanagpur Gneissic Complex in the eastern part of Peninsular India, is characterised by varying temperature and similar chemical composition.
Ž .
Vertical electrical sounding VES investigations in and around Bakreswar reveal the presence of two to four prominent lithologic layers under prevailing hydrodynamic conditions. The intermediate weathered zone and the fractured rocks constitute a single aquifer system of varied hydraulic conductivity under water table condition. Lithology and groundwater conditions, as inferred from the VES, as well as hydrological studies, are in agreement with the nearby bore hole lithologs. Water table contours accompanied by VES findings of the region indicate that the occurrence and movement of groundwater take place mostly within the weathered and fractured rocks under unconfined condition. 1D interpretation of VES results reveals few promising groundwater potential zones in the eastern part of the region. Wenner resistivity profiling, coupled with VES and geological studies, indicates the presence of a nearly N–S striking buried fault providing passage for hot water to emerge in the form of springs.q2000 Elsevier Science B.V. All rights reserved.
Keywords: Hot spring; VES; Resistivity profile; Aquifer; Fault
1. Introduction
Ž X Y
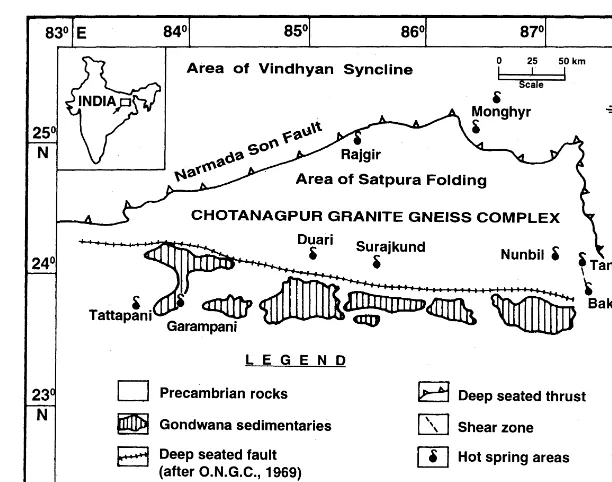
Bakreswar geothermal area 23852 48 N:878 -X Y
.
22 40 E is one of the few groups of geothermal areas in the Chotanagpur Granite Gneiss Plateau of
Ž
the eastern part of the Indian Peninsular Shield Fig.
.
1 . The geothermal areas in the terrain are charac-terised by surfacial manifestation of a cluster of
Ž .
springs with varied temperatures 35–888C and sim-Ž
ilar chemical compositions Deb and Mukherjee,
.
1969 . The springs mostly issue out of fractures in a
)Corresponding author. Tel.:q91-033-4254332.
Ž .
E-mail address: [email protected] R.K. Majumdar .
reactivated composite mass comprising
predomi-Ž .
nantly granitic rocks Precambrian with an E–W belt of sparsely occurring sedimentary outliers of
Ž
Gondwana formation Lower Permian to Middle
.
Jurassic .
Several workers have investigated Bakreswar group of hot springs from time to time, dealing with their geological mode of occurrence and chemical
Ž .
composition Ghosh, 1948; Mukherjee, 1967 ,
geo-Ž . Ž
chemistry Chowdhury et al., 1964 , genesis Chaterji
.
and Guha, 1968; Deb and Mukherjee, 1969 , natural gases with special reference to helium emanation
ŽChatterjee, 1972; Ghose and Chatterjee, 1980; Ghose
. Ž
et al., 1989, 1994 , isotopic composition Ghose and
0926-9851r00r$ - see front matterq2000 Elsevier Science B.V. All rights reserved. Ž .
( ) R.K. Majumdar et al.rJournal of Applied Geophysics 45 2000 187–202
188
Ž .
Fig. 1. Schematic setting of hot springs in Eastern India after Gupta et al., 1976; ONGC, 1969 .
.
Chatterjee, 1978; Majumdar et al., 1998 and
Ž
geothermal energy potential Mukherjee, 1982;
Ma-.
jumdar et al., 1992; Mukhopadhyay, 1996 .
Most of the previous works are restricted to surfa-cial studies and little is known about the subsurface geology related to the hot spring activity. On the basis of geophysical magnetic and electrical studies
Ž .
done by the Atomic Minerals Division Calcutta in
Ž .
the Bakreswar geothermal area, Nagar et al. 1996 have suggested the presence of a N–S trending fault extending for about 2 km in this area. Details of their investigations are not, however, published.
The weathered and fractured rocks present a good resistivity contrast with compact basement crys-tallines, and the structures, such as joint, fault, dyke, etc., in a geological terrain impose marked anomalies on the resistivity profiles. Hence, electrical resistivity investigations involving Schlumberger sounding and Wenner profiling are carried out in and around the Bakreswar geothermal area in conjunction with
geo-Ž .
logical studies to 1 identify various lithologic
lay-Ž .
ers for examining the nature of aquifer systems, 2
Ž .
probe into the hydrology of the springs, and 3
detect the possible major fault zone or buried frac-tures leading to the hot water emergence in the form of springs.
2. Tectonic set-up and general geology
The eastern part of the Peninsular India including the study area has been subjected to different cycles of plate movements with intervening periods of
iso-Ž
static readjustments during Precambrian Sarkar,
. Ž
1982 to Cenozoic times Dunn, 1939, 1941; Ghosh,
.
1948; Desikachar, 1974; Ravi Shanker, 1991 . The occurrence of several groups of hot springs in the Chotanagpur plateau can be ascribed to deep circula-tion of meteoric water along the major fractures that have been newly created or reactivated in the base-ment crystallines in response to tectonic disturbances
Ž .
in the terrain Deb and Mukherjee, 1969 .
Ž .
( )
R.K. Majumdar et al.rJournal of Applied Geophysics 45 2000 187–202 189
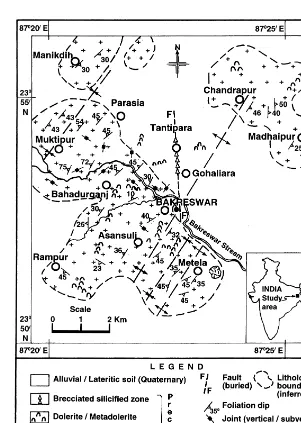
Ž .
crystallines Fig. 2 . The basement is predominantly constituted of granite gneiss with minor enclaves of amphibolite and pegmatite, and dykes of dolerite or metadolerite cropping out at places. The rocks
be-Ž
long to Chotanagpur Granite Gneiss Complex
Pre-.
cambrian .
The granite gneiss is regionally folded to form a major anticlinal structure trending NE–SW. The do-lerite dykes appear to be emplaced mostly along the
tensile fractures developed parallel to the axial plane of the fold. The basement rocks are intersected by four sets of vertical to subvertical joint trending
Ž .
NW–SE most prominent and open type , NE–SW, N–S and ENE–WSW. The most striking structural feature of the area is a N–S trending weak zone marked by repeated silicification and brecciation. It is traceable over 1.4 km from Gohaliara to Tantipara and further north. The zone disappears about 1.5 km
Ž .
( ) R.K. Majumdar et al.rJournal of Applied Geophysics 45 2000 187–202
190
north of Bakreswar and is no longer exposed at or near the spring site, not even to its south. From a consideration of the trends of silicified zone, fold axis, joint planes and alignment of seven springs in the geothermal area, it is suspected that the emer-gence of hot water and gases is controlled by inter-secting fractures trending N–S and NW–SE, as well as NE–SW.
3. Geoelectric resistivity investigations
As a part of ground reconnaissance survey, geo-electric resistivity studies have wide applications in hydrogeological and geothermal field investigations
ŽArora, 1986; Ilkisik et al., 1997; Monteiro Santos et al., 1997a,b; Raju and Reddy, 1998; Yadav and
.
Abolfazli, 1998 .
Ž .
A Schlumberger vertical electrical sounding VES study in and around Bakreswar geothermal area is aimed at ascertaining the vertical distribution of wa-ter-bearing zones, constituting the aquifer bodies in the region. Alongside, Wenner resistivity profiling investigation is carried out to delineate major subsur-face fractures and fault, and reconcile them with the distribution of the Bakreswar springs.
3.1. VES methodology
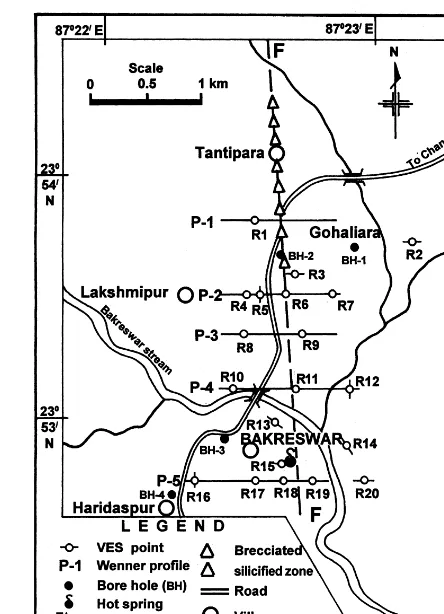
The VES study is conducted at 20 locations in and around Bakreswar, with a maximum electrode
Ž .
spacing of 440 m Fig. 3 . The field data, so obtained, are interpreted by 1D inversion tech-nique. For this purpose, a computer software viz.
Ž .
GEOELINV.EXE Christensen et al., 1993 is used.
Pre-liminary values of the model parameters, as obtained by manually matching the VES field curves with the theoretical master curves and auxiliary point charts,
Ž .
are subsequently used as input starting model in
GEOELINV.EXEfor further refinement of results by 1D
inversion algorithm. The degree of uncertainty of the computed model parameters and the goodness of fit in the curve fitting algorithm are expressed in terms of standard deviation and residual error, respectively. The resistivity of different layers and the correspond-ing thickness are reproduced by a number of itera-tions until the model parameters of all the VES
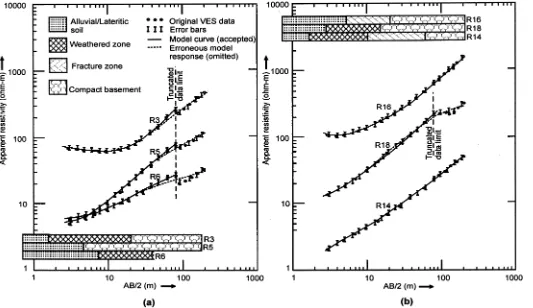
curves are totally resolved with minimum standard deviation and residual error. Analysis of the model parameters is exemplified with two VES results in Table 1, which justifies the acceptability of the final results. The nature of field data for seven VES points, viz. R3, R5, R6, R8, R9, R17 and R18, indicates the influence of 2D or 3D effects due to near-surface inhomogeneitiesrlateral contacts, such as jointrfracture zone, dyke, vein, fault or shear zone. This is also obvious from the structural
condi-Ž .
tion of the region Fig. 2 , as well as from the
Ž .
Wenner profiles Fig. 9 . Such lateral inhomo-geneities often give rise to very thin and low resis-tive false layers in VES curves, which are likely to be misinterpreted as water-bearing zones at depth
ŽBallukraya, 1996 . Monteiro Santos et al. 1997a. Ž .
have argued that under such complex situations, 1D interpretation is not always able to properly present a realistic resitivity model because of the high degree of misfit between field data and model response. Therefore, 1D interpretation for these data is done by omitting the artificial layers, i.e. by truncating the data up to the acceptable limit. The behaviour of four VES curves, viz. R3, R5, R6 and R18, is, however, documented in Fig. 4a,b by showing the full data and the truncated data.
1D inversion reserves its importance and utility, as the interpreted model parameters can serve as starting models for 2D and 3D approaches for better approximation of the subsurface geology of an area. In such cases, 1D interpretation is usually found to be fairly consistent with those observed in 2D and
Ž
3D inversions Monteiro Santos et al., 1997a,b;
.
Olayinka and Weller, 1997 .
The results of VES and electrical profilings are interpreted in terms of subsurface geology and aquifer characteristics under prevailing hydrodynamic condi-tions.
3.1.1. ObserÕations
Inversion results for all the 20 VES points are interpreted and subsequently correlated to resolve the lithological conditions in Bakreswar and its adjoin-ing areas.
( )
R.K. Majumdar et al.rJournal of Applied Geophysics 45 2000 187–202 191
Ž . Ž .
Fig. 3. Locations of geoelectric resistivity investigations and bore holes: VES Schlumberger and profiles Wenner .
show the existing hydrogeological environment in
Ž .
the region Fig. 5 . It reveals the presence of two to four prominent layers. The first layer is always constituted of soil. The second layer may be the compact basement or the water-saturated weathered
or fracture zone. The third layer, as found in 12 VES results, is the crystalline basement. In some cases
Žthree VES points , the water-saturated fractured.
Ž .
rocks form the third layer i.e. fracture zone beneath the weathered zone; below it lies the compact
resis-Table 1
Ž . Analysis of the model parameters for VES R3 and R16 as done using the computer programGEOELINV.EXEof Christensen et al. 1993
a
VES Layer no. Resistivity Dev. Thickness Dev. Depth Dev. Residual of Total residual Data Parameters
R3 1 76.7 0.24 1.6 0.76 1.6 0.76
2 55.0 0.06 18.2 0.18 19.8 0.12
3 3612.8 2.04 0.1919 0.0000 0.1919
R16 1 102.5 0.04 5.2 0.35 5.2 0.35
2 217.9 0.34 16.0 0.21 21.2 0.23
3 9999.0 0.58 0.4513 0.0000 0.4513
a
()
R.K.
Majumdar
et
al.
r
Journal
of
Applied
Geophysics
45
2000
187
–
202
192
Ž . Ž .
( )
R.K. Majumdar et al.rJournal of Applied Geophysics 45 2000 187–202 193
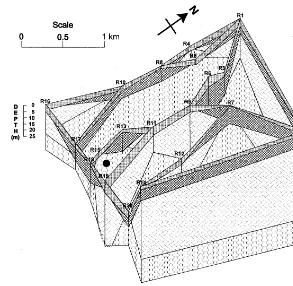
Fig. 5. Fence diagram constructed from VES interpretation shows lithological characteristics in Bakreswar and its surrounding areas.
Ž .
tive basement 4th layer . There are two
characteris-Ž .
tic features emerging from the fence diagram: 1 fracture zones are well developed in the eastern part of the area and constitute fairly thick unconfined aquifer system either singly or together with the
Ž .
weathered zones, and 2 basement is relatively deep in the eastern part in comparison with that in the west. This is the likely evidence of faulting. It is
Ž .
further indicated by Wenner profiles Fig. 9 . The lithological conditions as conceived from the
Ž .
fence diagram Fig. 5 are summarised in three
Ž .
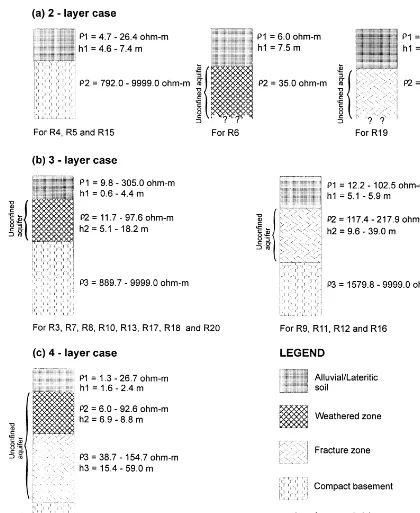
concise models Fig. 6 .
In all the cases, the top-most layer is composed of alluvial or lateritic soil with low to moderate
thick-Ž .
ness. The first model Fig. 6a shows a two-layer case, where the compact basement lies immediately below the soil cover at depths ranging from 4.6 to 7.4 m. In two cases, i.e. R6 and R19, the weathered or the fracture zone occurs at depths of 7.5 and 8.5 m, respectively, and is suspected to extend to a deeper level. Here, the hard basement is not found
from the VES results, as these sounding points lie on the downthrown side, as well as close to the dis-turbed zone of the fault. The second model exhibits a
Ž .
three-layer case Fig. 6b , where the weathered or
Ž .
the fracture zone 2nd layer forms an unconfined aquifer overlying the compact basement. These wa-ter-bearing zones show a wide variation in thickness and depth of occurrence. The fracture zone is notably thicker than the weathered profile. Basement crys-tallines are encountered in the depth range of 7.4–
Ž
44.1 m. In the third model, i.e. four-layer case Fig.
.
6c , the weathered zone, in combination with the
Ž .
fractured basement i.e. fracture zone lying immedi-ately below, chiefly constitutes the unconfined aquifer system with moderate to appreciably high thickness. Here, depth of compact basement ranges from 24.7 to 69.9 m.
( ) R.K. Majumdar et al.rJournal of Applied Geophysics 45 2000 187–202
194
Ž
Fig. 6. Proposed models of subsurface lithological divisions in and around Bakreswar geothermal area summarised from Fig. 5 and VES .
( )
R.K. Majumdar et al.rJournal of Applied Geophysics 45 2000 187–202 195
Ž . Ž . Ž . Ž .
( ) R.K. Majumdar et al.rJournal of Applied Geophysics 45 2000 187–202
196
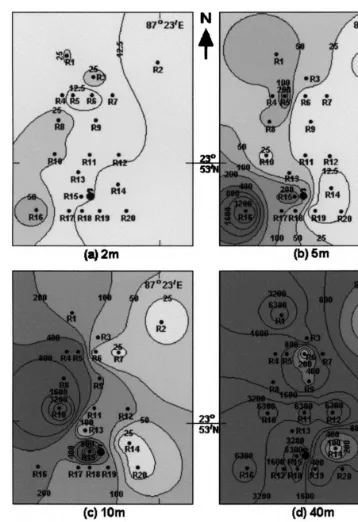
3.1.2. ResistiÕity contour
Resistivity contours for 2, 5, 10 and 40 m depth levels are drawn to examine the variation in resis-tivity at the respective depths due to subsurface ani-sotropy. Contours are drawn by ‘inverse distance’ gridding method that uses a weighted averaging technique to interpolate grid nodes from the XYZ data; X and Y are the cartesian coordinates of a location in a map, and Z is the parameter studied
Ži.e. resistivity . The method can be used for irregu-.
larly spaced data as in the present case. Resistivity contours for various depths fairly represent the sub-surface lithological variation under the existing
hy-Ž .
drological condition Fig. 7 . Contours for 2-m depth
Ž
level shows mostly low resistivity values -25 V .
m of the topsoil composed of alluvial sediments,
Ž .
laterite, silty clay and clay Fig. 7a . At a depth of 5 m, the contours are mostly in the range of 25–100 V
Ž .
m Fig. 7b . It is interesting to note that low
resistiv-Ž .
ity contours 25–50 V m pass through the silicified zone, the hot spring area and the adjacent Bakreswar
Ž .
stream in Fig. 3 , indicating availability of ground-water at this depth. Contour pattern for 10-m depth
Ž .
level Fig. 7c shows gradual rise in the resistivity values, thereby indicating the increasing effect of basement rocks. However, some low resistivity
con-Ž .
tours 25–100 V m are found in the northeastern and southeastern parts of the area around the VES points R2, R3, R6, R7, R13, R14 and R20. Fig. 7d
shows a sudden rise in resistivity values at 40-m depth, implying the effect of resistive basement at
Ž
this depth level. Low resistivity contours 100–200
.
V m still persist near the VES points R2 and R14.
Such low values account for the groundwater poten-tiality of weathered and fractured rocks in some restricted zones even at 10- and 40-m depths.
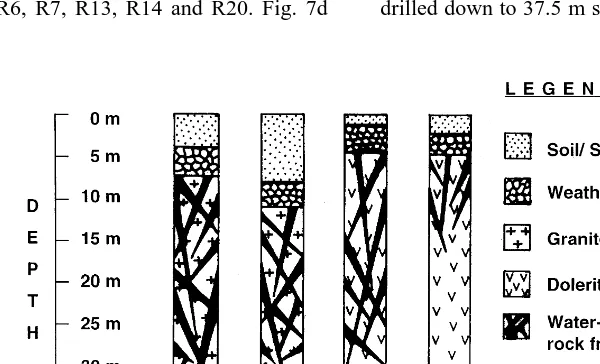
3.2. Bore hole lithology
Lithologs of four bore holes, viz. BH-1, BH-2,
Ž .
BH-3 and BH-4, sunk by PHED 1990, 1993 in and around the Bakreswar geothermal area are shown in Fig. 8 and their locations are also marked in Fig. 3. In all the bore holes, the fractured basement is encountered at depths ranging from 4 to 7.3 m. Litholog of BH-1 drilled down to a depth of 40.5 m at Gohaliara shows the succession of a 4.26-m-thick layer of sticky clay at the top, followed by weathered
Ž .
zone of thickness 3 m, granite gneiss 27 m
Ž .
and dolerite downwards Fig. 8a . Test yields at 15.5- and 35-m depths are 0.227 and 0.454 m3rh, respectively, thereby indicating the presence of wa-ter-bearing fractures in the basement gneiss.
Interpre-Ž
tation of VES result of the nearby location R2 in
.
Fig. 3 also qualitatively accords with the original subsurface field condition. The bore hole BH-2, drilled down to 37.5 m slightly off the silicified zone
Ž .
( )
R.K. Majumdar et al.rJournal of Applied Geophysics 45 2000 187–202 197
adjacent to Gohaliara, exposes a sequence of soil
Ž . Ž .
cover 8.5 m succeeded by weathered zone 2.13 m and granite gneiss having yield prospects of 0.908 and 1.362 m3rh at depths of 12.12 and 30 m,
Ž .
respectively Fig. 8b . Higher yield from greater depth indicates considerable fracture permeability in the gneissic basement. VES result of R1 near the
Ž .
silicified zone see Fig. 3 approximates the bore hole data and indicates the presence of water-bearing fractures in the crystalline basement. At Bakreswar, litholog of the 40-m-deep bore hole BH-3 exhibits a
Ž .
downward succession of soil 1.2 m , weathered
Ž .
zone 2.8 m and dolerite capable of yielding 1.362 and 1.816 m3
rh of groundwater from 14 and 27 m
Ž .
( ) R.K. Majumdar et al.rJournal of Applied Geophysics 45 2000 187–202
198
Ž .
depths, respectively Fig. 8c . The lithological condi-tions revealed by the bore hole corroborate the result
Ž .
of nearby VES investigation at R13 Fig. 3 . Litholog of BH-4 at Haridaspur lying southwest of Bakreswar, as shown in Fig. 3, exhibits a succession of soil
Ž2.12 m , weathered zone. Ž2.12 m. and dolerite
Ž .
downwards Fig. 8d . Here, basement fractures are
Ž .
encountered at very shallow depth 4.24 m with a
Ž 3 .
low yield potential 0.227 mrh at 14.5-m depth . The litholog of this bore hole testifies to the result of
Ž .
nearby VES point R16 in Fig. 3 , which shows comparatively high resistivity of the fractured base-ment, as well as poor groundwater condition in the subsurface layer. Wenner curve of the profile P-5 near this bore hole also shows high resistivity values, indicating the presence of basement rocks at shallow
Ž .
depth Fig. 9 .
The bore hole lithologs reveal that groundwater occurs mostly in the fracture zones, and to some extent, within the overlying weathered rocks occur-ring at shallow depth and, thus, they significantly substantiate the VES findings as regards lithology, occurrence and distribution of weathered, as well as fractured rocks, and their groundwater potentiality.
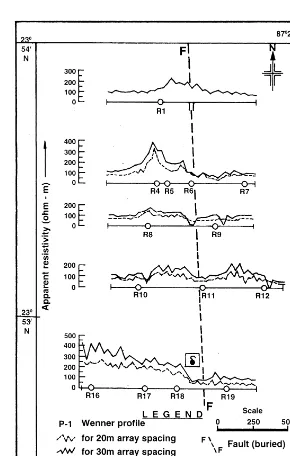
3.3. ResistiÕity profiling
Five Wenner resistivity profiles, viz. P-1, P-2, P-3, P-4 and P-5, are taken along E–W direction for array spacings of 20 and 30 m at intervals of 20 and
Ž .
30 m, respectively Fig. 3 . Resistivity responses along the different profiles are shown in Fig. 9. Profile P-1 is taken for 30-m array spacing across the N–S trending exposed silicified zone between Go-haliara and Tantipara lying north of Bakreswar. The noteworthy feature of the Wenner curve is that the resistivity value drops just over the exposures of the silicified rocks, indicating the conductive nature of the otherwise highly resistive silicified zone. It is possibly due to water content in the fractures of the sheared and jointed silicified zone. Good water yields in the dug wells and tube wells constructed at few places along this tract lend support to this observa-tion.
In profiles P-2 and P-3, high and low values of resistivity response are observed. In profile P-2, a resistivity high is noticed over VES point R4 for
both the spacing of 20 and 30 m. This ‘high’ may be associated with any structural feature, such as dyke. In profile P-4, the western part of the Wenner curve for 30 m spacing shows a characteristically
Ž .
low resistivity value near R10 in Fig. 9 , which can be attributed to the incursion of water from the adjacent Bakreswar stream into the fractures of gneissic basement. What is interesting in the eastern part of the curve is that the resistivity response falls
Ž .
abruptly to 1.8 V m repeatedly checked from the preceding value of 125 V m at a point about 230 m east of the southerly flowing streamlet that merges into the Bakreswar stream to the northeast of spring site. Such feature is, however, lacking in the curve of 20-m spacing. It follows that the very low value in resistivity response is probably due to 3D effects.
( )
R.K. Majumdar et al.rJournal of Applied Geophysics 45 2000 187–202 199
In profile P-5, taken about 200 m south of the spring site, overall resistivity value for 30-m spacing is higher than that of 20-m spacing. Resistivity re-sponse is clearly higher in its western part than that of the eastern part, presumably due to the existence of highly resistive dolerite intrusive under the soil cover. Results of VES at R16 and litholog of nearby BH-4 altogether confirm the occurrence of dolerite at shallow depth. The resistivity responses in most of
the profiles for 20-m array spacing show a number of peaks with varying magnitude, indicating a high degree of lithological inhomogeneity even at shallow depth.
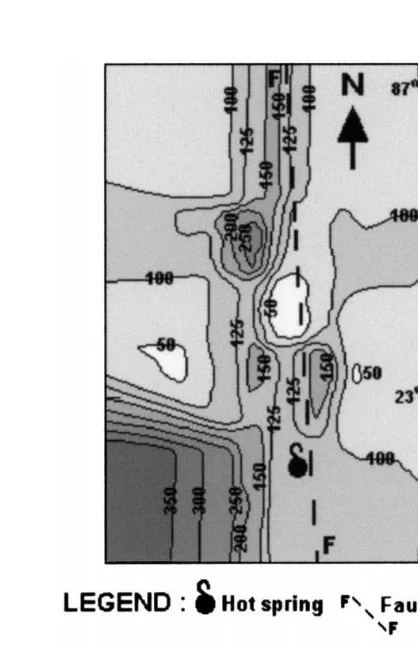
3.3.1. Apparent resistiÕity contour
Taking the apparent resistivity values of the five profiles for 30-m array spacing, a contour diagram is drawn for better comprehension of the lateral
( ) R.K. Majumdar et al.rJournal of Applied Geophysics 45 2000 187–202
200
Ž .
face discontinuity in the basement Fig. 10 . The contours are mostly extended along N–S direction and the resistivity decreases towards the eastern part of the area.
Near the central part of the area, a N–S trending linear tract encompassing the sheared silicified zone
Ž .
and the spring site lying further south can be
Ž
discerned from the contour pattern ;125–150 V .
m . The area lying on the east of this tract shows low resistivity values, as compared to the area to the west, thereby indicating variation in overburden thickness on the two sides of the tract. Moreover, geological traverse along several profiles in an E–W direction across this linear zone reveals the thicken-ing of the overlythicken-ing sediments towards the east. It is evident from the VES results and the nature of the profile curves that the basement rocks occur at greater depth in the eastern part of the area than in the western part. Relying on the presence of a brecciated silicified zone and variation in the depth of base-ment, as revealed from geoelectric and geological investigations, a nearly N–S trending buried fault with the downthrown block in the east is strongly suspected.
4. Hydrology of the geothermal area
For a better understanding of the hydrology of Bakreswar geothermal area, geological and geophys-ical investigations, coupled with bore hole inventory, are carried out. It is revealed that the occurrence and movement of shallow non-thermal groundwater take place mostly in the weathered and fractured rocks, constituting a single aquifer system in the area.
Ž
Groundwater occurs in water table condition
uncon-.
fined state . Water table condition in Bakreswar and the surrounding villages is studied from the inven-tory of several dugwells in March 1997. For the purpose, dumpy level survey is done in this region. Water table contour pattern generated from those dugwell data indicates varying hydraulic
conductiv-Ž .
ity of the heterogeneous aquifer system Fig. 11 . Hydraulic gradients are mostly towards the spring site from the relatively high topographic areas in the north, northeast and southwest, suggesting thereby, mixing of non-thermal groundwater with deep-seated hot water.
A comparative study of thermal and chemical behaviours of the hot springs and the non-thermal groundwater of the adjoining localities by Mukherjee
Ž .
and Majumdar 1999 and isotopic signatures, viz. d18O, d2H and tritium contents of surface water,
non-thermal groundwater, as well as hot spring water
ŽMajumdar et al., 1998 , however, indicate insignifi-.
cant mixing of spring water with non-thermal groundwater at the spring site. Orifices of spring discharge are restricted in nature, being controlled by fractures within the shallow basement crystallines. From geological and geoelectric investigations, it can be inferred that a nearly N–S trending buried fault zone provides the major outlets for the emergence of hot water. d18O and d2H contents of spring water bear resemblance with those of local meteoric water, even though its tritium content is remarkably lower than in local meteoric water. From such observa-tions, it can be reasonably inferred that circulation of meteoric water along deep-seated active fractures augments its temperature, which, under suitable hy-drogeological conditions, emerges as hot springs.
5. Conclusions
The geoelectric investigations, coupled with geo-logical and hydrogeogeo-logical studies, reveal the fol-lowing characteristics of the Bakreswar geothermal area and the adjoining areas in relation to geological setting, aquifer condition and groundwater move-ment.
Ž .1 The area of investigations consists of two to
four prominent lithologic layers; the bottom-most
Ž
layer is the compact basement crystallines
predomi-.
nantly granite gneiss having mostly high resistivity. Groundwater is mainly confined in the intermediate
Ž .
weathered and fracture zones fractured basement , forming an unconfined aquifer system. The ground-water conditions of the region, as discerned from the VES study, significantly correspond with the bore hole data.
Ž .2 VES findings unearth few promising grou-ndwater-bearing zones of appreciably high thickness
Ž . Ž .
( )
R.K. Majumdar et al.rJournal of Applied Geophysics 45 2000 187–202 201
Ž .3 Resistivity profiling and sounding results
indi-cate the presence of a nearly N–S trending buried fault with downthrown block in the east. Surface manifestation of the fault is represented by a zone of repeated brecciation and silicification about 1.5 km north of the Bakreswar geothermal area.
Ž .4 Springs are fracture-controlled and located in the disturbed zone of the fault.
Ž .5 Water table contour configuration in and around Bakreswar shows a wide variation in hy-draulic conductivity of the aquifer due to varied lithological conditions. Convergence of hydraulic gradients towards the spring site is suggestive of mixing of shallow non-thermal groundwater with deep-seated hot water. But temperature behaviour and contrasting tritium contents of the groundwater and the spring water indicate insignificant participa-tion of the former in the spring site.
Acknowledgements
R.K.M. and A.L.M. are grateful to the
Depart-Ž
ment of Science and Technology Government of
.
West Bengal , and N.M., to the University Grants
Ž .
Commission Government of India , for financial support. Thanks are also acknowledged to the De-partment of Geological Sciences, Jadavpur Univer-sity for providing research facilities, and to Mr.
Ž
Susanta Kumar Samanta Senior Research Fellow of
.
this Department for offering his kind service in the preparation of computerised diagrams. The authors are obliged to Prof. A. Tabbagh and other two unknown referees for their critical review and rec-ommendations for the improvement of this paper. Moreover, the authors are indebted to Prof. Niels B. Christensen, one of the editors of this journal, for his constructive comments and valuable suggestions for the overall enrichment of this paper.
References
Arora, C.L., 1986. Geoelectric study of some Indian geothermal Ž .
areas. Geothermics 15 5r6 , 677–688.
Ballukraya, P.N., 1996. Differentiating conductive and resistive inhomogeneities: a new approach in groundwater exploration.
Ž .
Curr. Sci. 71 11 , 926–931.
Chaterji, G.C., Guha, S.K., 1968. The problems of origin of high temperature springs of India. Proc. 23rd IGC 17 pp. 141–149. Chatterjee, S.D., 1972. Origin of rare gases emanation from
Ž .
thermal springs of Bakreswar. Sci. Cult. 38 3 , 126–129. Chowdhury, A.N., Bose, B.B., Banerjee, G., 1964. Studies on
geochemistry of thermal springs at Bakreswar. Proc. 22nd IGC, Part 12 pp. 143–160.
Christensen, N.B., Sirensen, K.I., Nielsen, P.H., 1993. GEOELINV.EXE: Tolkningsprogram til geoelektriske sonderinger. Programmet maa anvendes i forbindelse undervisningen i Geo-fysik 2 — Miljogeofysisk Metodik, samt anden undervisning og forskning ved Geologisk Institut Geofysisk Afdeling. Deb, S., Mukherjee, A.L., 1969. On the genesis of a few groups
of thermal springs in the Chotanagpur Gneissic Complex, India. J. Geochem. Soc. India 4, 1–9.
Desikachar, S.V., 1974. Himalayan orogeny and plate tectonics — a geological interpretation. Misc. Publ., Geol. Surv. India 34, 29–39, Part 1.
Dunn, J.A., 1939. Post Mesozoic movements in the northern part of the Peninsular India. Mem. Geol. Surv. India 73, 137–142. Dunn, J.A., 1941. Mineral resources of Bihar. Mem. Geol. Surv.
India 78.
Ghose, D., Chatterjee, S.D., 1978. Measurement of deuterium Ž2 .
content D in thermal spring waters. Indian J. Phys. 52B, 154–159.
Ghose, D., Chatterjee, S.D., 1980. Genesis of the abundance of helium formation in natural gas emanating from thermal
Ž . springs. Proc. Indian Natl. Sci. Acad., Part A 46 1 , 81–83. Ghose, D., Das, N.K., Sinha, B., Das, S.K., Chatterjee, S.D., 1994. Heat and helium release from thermal spring and influ-ence of volcanic eruption. Proc. Indian Natl. Sci. Acad. 60A Ž .2 , 481–486.
Ghose, D., Das, S.K., Chatterjee, S.D., 1989. Occurrence of krypton and xenon in the Bakreswar thermal spring gases. Naturwissenschaften 76, 520–521.
Ghosh, P.K., 1948. Mineral springs of India. Proc. 35th Ind. Sc. Cong., Part 2 pp. 221–250.
Gupta, M.L., Narain, H., Saxena, V.K., 1976. Geochemistry of thermal waters from various geothermal provinces of India. Proc. Grenbole Symp., Int. Assoc. Hydrol. Sc.. pp. 47–58. Ilkisik, O.M., Gurer, A., Tokgoz, T., Kaya, C., 1997.
Geoelectro-magnetic and geothermic investigations in the Ihlara valley geothermal field. J. Volcanol. Geotherm. Res. 78, 297–308. Majumdar, N., Mukherjee, A.L., Majumdar, R.K., Navada, S.V.,
Sharma, S., 1998. Isotope studies on Bakreswar geothermal area, Birbhum district, West Bengal. Proc. All Ind. Sem. on Development of water resources in India during 50 years since Independence, Ind. Assoc. Hydrol., June 1998, Calcutta. pp. 98–115.
Majumdar, R.K., Mukherjee, A.L., Bose, S., 1992. Geophysical and geochemical investigations at Bakreswar thermal springs area in West Bengal for geothermal energy. Proc. 29th IGC,
Ž .
Kyoto, Japan. abstract .
( ) R.K. Majumdar et al.rJournal of Applied Geophysics 45 2000 187–202
202
Victor, L.A., 1997b. 1D joint inversion of AMT and resistivity data acquired over a graben. J. Appl. Geophys. 38, 115–129. Mukherjee, A.L., 1967. Major chemical constituents in water from thermal spring areas in the eastern part of Peninsular India and Ž . their probable sources. Geochem. Soc. India Bull. 2 3 , 45–59.
Mukherjee, A.L., 1982. Utilisation of geoheat and water from Bakreswar thermal springs, Birbhum district. In: Banerjee,
Ž .
A.K. Ed. , Proc. Conference on Mineral Development in West Bengal. Oxford and IBH Pub., Calcutta, pp. 131–136. Mukherjee, A.L., Majumdar, R.K., 1999. Hydrology and
convec-tive heat flow of Bakreswar thermal springs area, Birbhum district, West Bengal. Proc. Golden Jubilee Seminar on Explo-ration Geophysics. Geol. Surv. India — Spec. Pub. 49 pp. 219–228.
Mukhopadhyay, D.K., 1996. Geothermal parameters and thermal energy potential of Bakreswar, Tantloi group of hot springs in Birbhum district, West Bengal and Dumka district, Bihar. Proc. Sem. on Geothermal Energy in India. In: Pitale, U.L.,
Ž .
Padhi, R.N. Eds. , Geol. Surv. India Pub. 45 pp. 87–98. Nagar, R.K., Vishwanathan, G., Sagar, S., Sankaranarayanan, A.,
1996. Geological, geophysical and geochemical investigations in Bakreswar — Tantloi thermal field, Birbhum and Santhal Parganas districts, West Bengal and Bihar, India. Proc. Sem.
on Geothermal Energy in India. In: Pitale, U.L., Padhi, R.N. ŽEds. , Geol. Surv. India — Spec. Pub. 45 pp. 349–360.. Olayinka, A.I., Weller, A., 1997. The inversion of geoelectrical
data for hydrogeological applications in crystalline basement areas of Nigeria. J. Appl. Geophys. 37, 103–115.
ONGC, 1969. Tectonic map of India published by Oil and Natural Gas Commission, Dehradoon, India, scale 1:20000.
PHED, 1990, 1993. Annual report of drilling operations for Ž .
groundwater exploration in Birbhum west in Jan. 1990 and April 1993 by Public Health Engineering Department, Suri, Birbhum district, West Bengal.
Raju, N.J., Reddy, T.V.K., 1998. Fracture pattern and electrical resistivity studies for groundwater exploration. Environ. Geol. 34, 175–182.
Ravi Shanker, 1991. Thermal and crustal structure ofASONATAB: a zone of mid continental rifting in Indian Shield. J. Geol. Soc. India 37, 211–220.
Sarkar, A.N., 1982. Precambrian tectonic evolution of eastern India: a model of converging microplates. Tectonophysics 86, 363–397.