A model for tip vortex roll-up in the near field region of three-dimensional foils
and the prediction of cavitation onset
J.-A. Astolfia,*, D.H. Frumanb, J.-Y. Billarda
aLaboratoire d’Hydrodynamique de l’Ecole Navale, 29240 Brest Naval, France bGroupe Phénomènes d’Interface, E.N.S.T.A, 91120 Palaiseau, France
(Received 22 January 1998; revised 26 October 1998; accepted 3 November 1998)
Abstract – A research program known as “Action Concertée Cavitation” initiated in France in 1991 was aimed at investigating Tip Vortex Cavitation (TVC) in various experimental facilities operating over a large range of Reynolds numbers. An original method to analyze the numerous data collected during the program was developed. From this method, a correlation model of the roll-up process close to the tip (near field region) of elliptical loading foils is proposed. It is based on the experimental evidence of a linear relationship, during the roll-up process, betweenaand(Ŵt)0.5, whereais the local vortex core radius,Ŵthe local vortex intensity andtthe convection time. The core radius and the vortex intensity are modeled with power laws in such a way the linear relationship is satisfied. With the hypothesis of an axisymmetric vortex, the minimum of the pressure coefficient on the vortex path is computed. It agrees well with the experimental critical cavitation number obtained for lift coefficients ranging from 0.2 to 0.6 and for Reynolds numbers ranging from 4×10⁵to 6×10⁶. Moreover, the model shows that the actual vortex diffusion appears to be faster than that predicted by laminar flow hypothesis. This can be explained by an apparent viscosity of about two orders of magnitude larger than the molecular viscosity during the roll-up process. Finally, as the model is based on a limited number of parameters to describe a complex phenomenon, it indicates also some important trends which should be examined by those seeking to mitigate the occurrence of cavitation on lifting surfaces as designers of pumps, propellers and other fluid machinery.Elsevier, Paris
tip vortex cavitation / prediction
1. Introduction
Wing tip vortices are very strong coherent structures which have a great impact on aerodynamic and hydrodynamic applications. Many numerical and experimental works have been mainly concerned with the diffusion of the tip vortex in the far field region, beyond the position where the roll-up is achieved, see, for instance, Chigier and Corsiglia [1]; Baker et al. [2]; Zeman [3] and Devenport et al. [4]. More recent research has concentrated on the near field region, over a distance of a wing chord from the tip, because the first cavitation events occur in this region, initiating the development of Tip Vortex Cavitation (TVC) [5–10].
The main objective of the TVC studies is to predict cavitation inception for prototypes operating at Reynolds numbers larger than 107 by extrapolating the results obtained in reduced scale cavitation tunnels where
Reynolds numbers are usually of less than 106. To do so, a cooperative research program known as ‘Action
Concertée Cavitation’ (ACC) (see [11]) was initiated in France in 1991 [12]. Using the same experimental procedures in different experimental facilities operating over a large range of Reynolds number, the aim was to investigate the effect of foil planform [13], foil section [14], Reynolds number [15], upstream turbulence [16], foil unsteadiness [17], foil confinement [18,19] and oxygen and nuclei content [20,21]. Cavitation inhibition was also investigated by polymer solution ejection at the foil tip [22]. A considerable amount of data pertaining
to the inception cavitation number, the axial and tangential velocity profiles of the vortex in the near field region of a variety of foils with an elliptical loading is today available (see [11]). The aim of velocity measurements is to determine the minimum pressure on the vortex path to be compared to the critical cavitation numberσ for which the cavitation appears (inception,σ=σi) or vanishes (desinence,σ=σd).
From several tangential velocity profile measurements, Fruman et al. [7], determined a, the local core radius, andŴ, the local vortex intensity at several locations along the vortex path. With the assumption of an axisymmetric vortex flow and the radial equilibrium equation, the local core vortex pressure coefficient was estimated along the vortex path,CP ∼(Ŵ/a)2. The position and the value of the minimum pressure coefficient
CPmin were then determined and compared to the critical cavitation number. In spite of the simplifying
assumption of an axisymmetric vortex flow and although the actual pressure for cavitation depends on the spectrum of bubbles present in the inception region [20], it has been found that−CPminwas in good agreement
with the desinent cavitation number particularly if a susceptibility pressure is used in the definition of the critical cavitation number—instead of the vapor pressure—to take into account the water quality (see [12]). However, as it can be seen,CPmin is strongly dependent on a reliable estimation ofaandŴ.
In order to extrapolate the results from reduced scale cavitation tunnel to prototypes, great efforts have been made to scale the experimental data (as a, Ŵ) with the flow conditions as Reynolds number, Re, and the lift coefficient Cl, for instance. On this point, several authors such as Billet and Holl [5] and Fruman et al. [7] assume that the vortex core a is related to the boundary layer thickness δ. This hypothesis leads to a dependence on the Reynolds number, a ∼δ ∼cRe−n, with n=0.2 for a fully turbulent boundary layer (c is the root chord) andn=0.4 for the original McCormick [23] hypothesis which appears reasonable for a transitional boundary layer as suggested by Maines and Arndt [10]. ConcerningŴ, Fruman et al. [7] assume that it is related toŴ0, the root circulation which isŴ0=0.5U∞Clc, for hydrofoils with an elliptical loading, whereU∞is the free stream velocity. Both scaling hypotheses on a and Ŵ together withCP ∼(Ŵ/a)2, lead to the relation, CPmin = −KCPminC
2
lRe
2n, where n is a positive exponent depending on the boundary layer
development on the foil surface andKCPmin a positive constant probably governed by the local geometry of the
foil tip. Concerning critical cavitation number, several authors have predicted that it should follow the relation
σd ∼KσdC
2
lRe
m where K
σd is a positive constant depending on the hydrofoil section. Platzer and Souders
[24] proposedm=0.36 in agreement with Mc Cormick’s result. More recently, Billet and Holl [5], Fruman et al. [7] and Maines and Arndt [10] suggested that a better correlation of inception data is achieved with
C2
lRe
0.4for hydrofoils with an elliptical loading. From these numerous studies, it appears that reliable methods
to study TVC data are still needed. For instance, methods to estimate the minimum pressure coefficient on tip vortices make an interesting way to predict cavitation inception (see [25,26] and recently, [27]). Moreover, these methods could suggest trends to delay cavitation inception.
In this paper, a method is developed to analyze the numerous data collected during the ACC program. From the analysis of the experimental values ofaandŴ, a correlation model describing the tip vortex roll-up process (aandŴevolution) in the region extending from the foil tip up to a maximum chord downstream is proposed. Based on the scaling relationships hypothesized above (a∼δ, Ŵ∼Ŵ0 and CP ∼(Ŵ/a)2) the value and the location of the minimum pressure coefficient on the vortex path could be predicted. Moreover, it provides a very concise presentation of numerous experimental tests and should be very useful for further TVC data analysis.
2. Summary of previous results
2.1. Experimental procedure
Since the main objective of the paper is to propose a model based on a large amount of measurements of the axial and tangential tip vortex velocity profiles, as well as foils characteristics, such as lift coefficient and critical cavitation numbers, it seems appropriate to provide some information on the experimental procedures— instrumentation, facilities and methods—used to obtain the data and their uncertainty bounds. A large part of the data used in the present work, were obtained in our laboratory and the results were compared to independent tests conducted in the other laboratories. For more details in the experimental procedures, readers should refer to the paper by Fruman et al. [7].
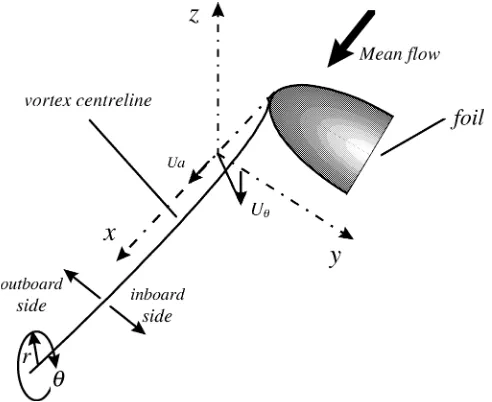
The experiments were conducted in different size cavitation tunnels, with test section dimensions ranging from about 0.1 m to 1 m. In all of the tunnels but one, the hydrofoils were mounted horizontally on one of the vertical walls of the test section and axial and vertical (or tangential) velocities were measured along an axis parallel to the span of the foil for up to twelve stations located between the foil tip and a chord downstream, (see figure 1 for coordinate definition).
A two component DANTECTMLDV system operating in the back scattering mode was used to measure the velocities. For the optical configurations used in our facility, the measuring volume was 0.5 mm long and 0.04 mm wide. The velocity profiles are defined with spatial steps which were as small as 40µm in the core region where the variation of the velocity is very large. In order to quantify tip vortex characteristics at each stage of the roll-up process, a local vortex intensity,Ŵ(x), and a local viscous core radius,a(x)can be inferred from the information contained in the tangential velocity profiles using the following procedure:
(i) The angular momentum, product of the tangential velocity by the distance to the vortex axis, is plotted as a function of the distance to the vortex axis. In general, outboard of the foil, a nearly constant value is achieved well outside the viscous core. This value is then selected asŴ(x)(2π )−1.
(ii) The vortex core radiusa(x)is defined by the position of the maximum of the tangential velocity.
Figure 1. Schematic of the test arrangement showing the coordinate system. The origin is at the foil tip.UaandUθare the axial and tangential (vertical)
(iii) Using the value ofŴ(x), a(x), and Uθmax it is easy to verify if the experimental velocity profile can be
approached by a Lamb type vortex,
Uθ(x, r)=
Ŵ(x)
2π r 1−e
−1.255r2/a2
(1)
by verifying that
0.714Ŵ(x)
2π a(x)Uθmax
≈1. (2)
It has been shown that in most cases, and especially in the near-field region, the fit of the experimental velocity profile by a Lamb profile was satisfactory [7].
(iv) With the hypothesis of an axisymmetric vortex, an estimate of the pressure coefficient can then be obtained using the simplified radial equilibrium equation (in which it has been assumed that the radial velocity is negligible) either by numerical integration of the experimental tangential velocity profile or by using analytical integration of a Lamb profile,CP = −0.044[Ŵ/(U∞a)]2.
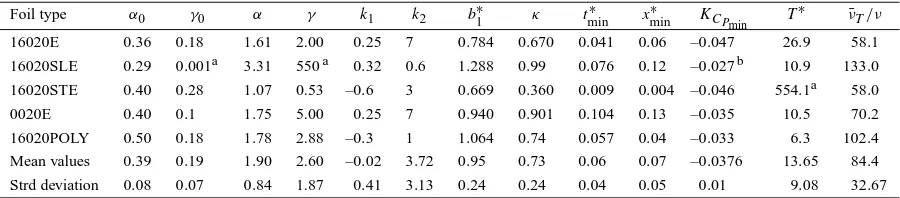
The geometric characteristics of the foils, the Reynolds numbers, Re, the incidence angles, the lift coefficients, Cl, and the desinent cavitation numbers, σd, are summarized in table I. Data for foils with an elliptical loading but with different cross sections and planforms will be used in this work [7,14,22]. For a NACA 16-020 cross section (maximum thickness located at mid-chord), one foil has an elliptical planform (E) while the two others were shaped like a quarter of ellipses; one with a straight leading edge (SLE) and the other with a straight trailing edge (STE). They are respectively referred to as 16020E, 16020SLE and 16020STE. Because of the peculiar lift characteristics of the 16020E foil, experiments have been also conducted by tripping the boundary layer laminar-turbulent transition [15]. For a NACA 0020 cross section (maximum thickness located at 30% of the section chord length), only the elliptical shape was studied and will be referred to as 0020E. Moreover, the results obtained when ejecting a polymer solution from the tip of the 16020E foil will be referred to as 16020E POLY [22].
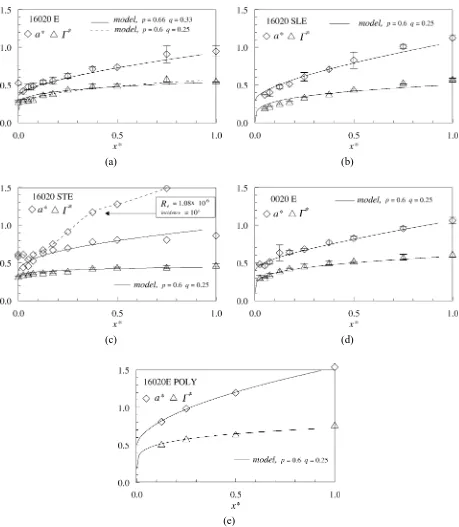
2.2. Evolution of the tip vortex core radius and intensity
It can be shown (see figures 2(a)–2(e)) that for a variety of foils, incidence angles and/or Reynolds numbers the evolution of the core radius,a, scales withδ, the turbulent boundary layer thickness of a flat plate of length equal to the maximum chord,c, with a constant of proportionality depending on the foil shape. This allows us to define a nondimensional core radius,
a∗=a
δ =
a
0.37cRe−0.2. (3)
Re=U∞c/ν is the Reynolds number,U∞is the upstream flow velocity andν is the fluid kinematic viscosity.
In the same way, the local vortex intensity Ŵ, scaled with the mid-span circulation Ŵ0 (computed from the
measured lift coefficient,Cl) allows us to define a nondimensional vortex intensity,
Ŵ∗= Ŵ Ŵ0
= Ŵ
0.5ClU∞c
. (4)
From repeated applications of the procedure to measure the vortex core radius and the local vortex intensity, the standard deviations fora∗andŴ∗were estimated at 13 and 10%, respectively.
2.3. Critical desinent cavitation number
The desinent cavitation number,σd, is defined as follows,
σd=
p∞−pv 0.5ρU2
∞
(5)
wherep∞is the reference pressure at which tip vortex cavitation disappears,pvis the vapor pressure at ambient temperature andρis the fluid specific mass. As an example, figure 3 displaysσddivided byRe0.4as a function of the square of the lift coefficient. Despite some scatter, the data can be quite well fitted by a straight line of the form
σd
Re0.4 ≈KσdC
2
l. (6)
The values ofKσd are summarized in table I.
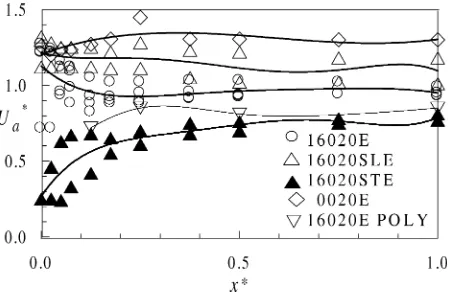
2.4. Axial velocities
The distribution of core vortex axial velocities scaled with the free-stream velocityU∞are shown in figure 4
(a) (b)
(c) (d)
(e)
Figure 2. Nondimensional tip vortex radius and intensity as a function of the nondimensional distance from the foil tip. Symbols and vertical bars are the averaged experimental values and the standard deviations obtained from experimental conditions given in table I. Continuous or dashed lines
Figure 3. Desinent cavitation number divided by the Reynolds number to the power 0.4 as a function of the square of the lift coefficient for three foils. The continuous and dashed lines are linear fits through the 16020E and 0020E foil data, respectively. Experimental conditions are given in table I.
Figure 4. Nondimensional axial velocity in the vortex core as a function of the nondimensional distance from the foil tip. Experimental conditions are given in table I.
3. Model formulation
3.1. a∗andŴ∗formulation
It will be assumed thata∗andŴ∗can be well represented by a power law of the nondimensional time needed for a fluid particle to travel the distance from the foil tip (transit time),t∗=tU
∞/c:
a∗=α0 1+αt∗p, (7a)
Ŵ∗=γ0 1+γ t
∗q
. (7b)
3.2. Transit time
∗)is the axial velocity in the vortex core scaled withU
∞andr is the radial distance to the
vortex axis. Based on experimental evidence, it is assumed to be of the form
Ua∗= Ua U∞
= 1+k1e−k2x ∗
(9)
where k1 positive (respectively negative) indicates a jet (respectively a wake) behavior. The value of k1
quantifies the excess or the defect of the velocity at the foil tip and is assumed in the present model to be independent of the Reynolds number and of the lift coefficient. The constantk2is positive and quantifies the
free-stream velocity recovery downstream the foil tip. Integrating Eq. (8), we have
t∗= −1
which allows a direct computation oft∗as a function ofx∗.
3.3. Vortex core pressure estimate
The tangential velocity profiles can be fitted quite well by a Lamb velocity model in the very near field region. As discussed by Fruman et al. [7], the pressure coefficient can be rather well estimated by integrating the simplified radial equilibrium equation
wherepr=0 is the pressure in the vortex axis and p∞ the reference pressure far away from the vortex core.
According to Eqs (3), (4) and (7) we have
Equation (12) allows the computation of the pressure coefficient in the vortex core provided(γ0/α0)as well
asα andγ are known. It is then possible to computeCPmin, to determine the time for which it occurs,t ∗
min, and
using the inverse of Eq. (10) to determine the distance from the foil tip,x∗
4. Fitting procedure
4.1. Physical discussion, vortex growth parameter
Zeman [3], using scaling arguments showed that, for the far region where roll-up is completed, a scales with(Ŵ0t)0.5whereŴ0is the wing circulation given by the wing lift. He showed that the vortex core growth
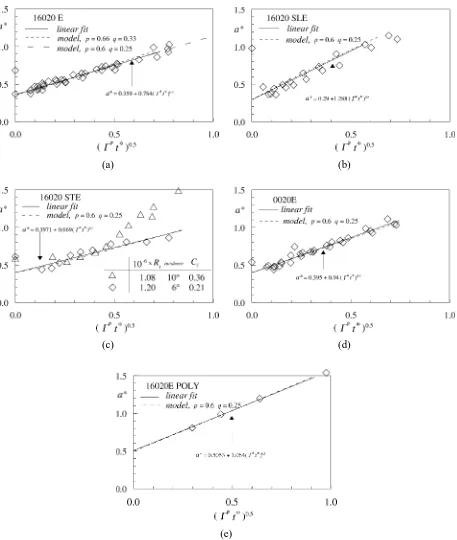
parameter, given by a∼(νt)0.5, which suggests viscous rather than turbulent diffusion of the vortex. It is interesting to extend the approach of Zeman [3] into the near region by plotting a∗ as a function of (Ŵ∗t∗)0.5 for each tested configuration. This is done in figures 5(a)–5(e). As opposed to the Zeman situation, whereŴ0 is constant,
hereŴ∗progressively increases from the foil tip to take into account the roll-up process.
In figures 5(a)–5(e) a very good linear dependency betweena∗and(Ŵ∗t∗)0.5is achieved:
vortex growth parameter is now given by
b1=
For an elliptical loaded foil, we have
b1∝ the influence of the foil Reynolds number through the boundary layer effects.
As Ferreira De Sousa and Falcao De Campos [27] rightly pointed out, the quantitative prediction of the minimum pressure in the vortex core is critically dependent on the estimate of the viscous core radius at the foil tip,α0(see Eq. (12)). As an interesting result of the linear evolution, figures 5(a)–5(e) show that it is possible to
(a) (b)
(c) (d)
(e)
4.2. Exponentspandq
By taking the square of Eq. (21), we have
t∗2p= κ
We look for the values ofκ, γ , pandqfor which Eq. (22) can be satisfied. This equation has no exact solution excepted forγ ≫1, for which we should have
2p=q+1
κ=1. (24)
Withγ ≫1, Eq. (23) shows thatγ0≪1 meaning that the roll-up process is initiated almost precisely at the foil
tip. In the general case of the roll-up process initiated not strictly at the foil tip but along a part of the leading edge,γ0should have a finite value at the foil tip andγ should not be necessarily large. Thus, the parameters of
Eq. (22) cannot be determined rigorously and a trial and error procedure, described below, is needed:
(a) We select one of the plots given in figures 5(a)–5(e), say figure 5(a) for the 16020E foil, and determine, by extrapolation to the origin, the value ofα0.
(b) With this value ofα0and the data from figure 2(a) fora∗and figure 4 to computet∗, we determine the
coefficients of Eq. (7a) giving the best fit in the sense of a least square procedure,
a∗=0.359 1+1.76t∗0.66
. (25)
(c) Because of Eq. (24), an initial value ofq=2p−1=1/3 is selected. Using the data of figure 2(a) for
Ŵ∗and figure 4 to computet∗, the coefficients of Eq. (7b) giving the best fit in the sense of a less square
procedure are then determined,
Ŵ∗=0.16 1+2.6t∗0.33
. (26)
(d) The coefficients and powers of expressions (25) and (26) are used to plota∗as a function of(Ŵ∗t∗)0.5into figure 5(a) (dashed line), to be compared to the linear fit of the experimental data (continuous line). As
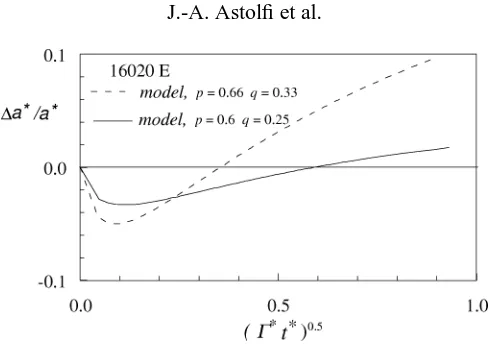
shown, the agreement between the model and the experimental fit is rather good. Nevertheless, figure 6 (dashed line) shows as a function of(Ŵ∗t∗)0.5the relative difference ofa∗obtained using the model and
Figure 6. Relative difference ofa∗between the linear fit and the model for the 16020E foil.
(e) This adjustment can be improved by adjusting the powers. After a trial and error procedure, we obtain
a∗=0.36 1+1.61t∗0.6
Ŵ∗=0.18 1+2.0t∗0.25
. (27)
This is shown graphically in figure 2(a) (replacingt∗byx∗), in figure 5(a) and figure 6 (continuous line).
This last one shows clearly that fitting has been improved with a relative difference of less than±4%. (f) These powers are considered to be well representative of the tested conditions and used to fit the data for
all of the other hydrofoils as shown in figures 2(b)–2(e) and figures 5(b)–5(e).
The exponent p=0.6 for the core radius evolution in Eq. (27) implies a more rapid diffusion than in the laminar case, for which
a=(5.02νt)0.5. (28)
Here in dimensional form, using (Eq. 7) withp=0.6, we have
a−a0= 5.02νTt∗ 0.5
(29)
with
νT =0.027α2α02Re 0.6
t∗0.2ν. (30)
νT can be considered as an apparent viscosity indicating that the actual tip vortex diffusion, during the roll-up process, can be larger than the one based on laminar flow assumptions. A mean value ofνT, computed over a timeT∗which could be considered as a characteristic time of the roll-up process, is:
¯ νT =
1
T∗
Z T∗
0
νT dt∗=0.0225α2α20Re 0.6
T∗0.2ν. (31)
Setting that,T∗, is the time for which the roll-up process is completed,Ŵ∗=1 in (Eq. 7b), we have
T∗=
1−γ
0
γ γ0
1/q
Table II. Values ofξandηas a function ofγ.
γ 1 2 3 4 5
ξ 1.593 2.96 4.72 7.01 9.82
η 0.349 0.438 0.489 0.547 0.585
and, withq=0.25, the apparent viscosity can be now related to the model constants as
¯ νT
ν =0.0225α 2
α02
1−γ
0
γ γ0
0.8
Re0.6. (33)
It may be noted thatν¯T is larger for full-scale situations because of the dependence on the Reynolds number to the power 0.6.
4.3. Minimum pressure coefficient
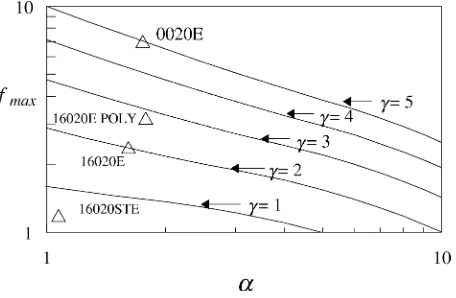
Eq. (14) indicates that CPmin ∼ −fmax. With p =0.6 and q =0.25, figure 7 shows that, in logarithmic
coordinates, the values of fmax display a near linear behavior as a function of α for each value of γ. fmax
can be fitted then by
fmax=ξ α
−η
(34)
whereξ andηare coefficients depending onγ (table II), which in turn can be fitted by
ξ =0.774+0.5864γ +0.244γ2,
η=0.351γ0.321. (35)
This gives when combining with Eq. (12),
CPmin= −0.0803 γ02 α02
ξ α−ηCl2Re0.4=KCPminC 2
lRe
0.4 (36)
which allows one to rapidly computeCPminand shows the strong dependency on the initial conditions(α0, γ0).
Moreover, studying the functionf (α, γ , t∗)in Eq. (13) withp=0.6 andq=0.25 together with Eq. (34), it
relating directly the position of the minimum pressure to the model constants. The positive (respectively negative) sign in Eq. (38) is used when simulating a wake effect,k1<0, (respectively a jet effect, k1>0)
in the axial velocity profile. It can be shown that increasing α or decreasingγ causes the minimum pressure coefficient to move closer to the foil tip.
5. Results and discussion
Table III summarizes the values of all the parameters for the four foils and the polymer solution ejection
together with their mean values and standard deviation. The core radius at initiation ranges from 30 to 50% of the boundary layer thickness with the largest value obtained with polymer ejection. The initial vortex intensity ranges from 10 to 30% of the root circulation. It is nearly zero for the 16020SLE foil because roll-up is initiated at the foil tip (Eq. (23) withκvery close to one andγ very large). For the 16020STE, it is the largest(γ0=0.28),
and 1.55 times larger than that of the intermediate 16020E foil,(γ0=0.18). It can be speculated that the reason
for such an increase in the initial vortex intensity is directly associated to the length of the leading edge over which the roll-up occurs. If it can be assumed that the roll-up is restricted to a small percentage of the span, say about 20% [28], the leading edge length over which the roll-up occurs for the STE foil should be 1.53 times larger than that of the E foil, very closed to 1.55, the ratio of the values ofγ0.
Whereas the initial conditions are close, the intensity growth rate,γ, is much larger for the 0020E foil(γ =5)
than for the 16020E foil(γ =2). The consequence is a value ofKCPmin larger by a factor of 1.34 times larger
for the 0020 foil. This indicates that moving the maximum foil thickness towards the leading edge promotes the roll-up process and should be beneficial for delaying cavitation. It can be noticed that the ratio of 1.34 between the values ofKCPmin is close to 1.4(=0.7/0.5)the ratio of the chord fractions beyond the maximum thickness.
As shown, except for the STE foil, the mean characteristic time for which the roll-up process is completed is of about 13 times the typical convection timec/U∞.
5.1. Vortex core pressure coefficient and critical cavitation number
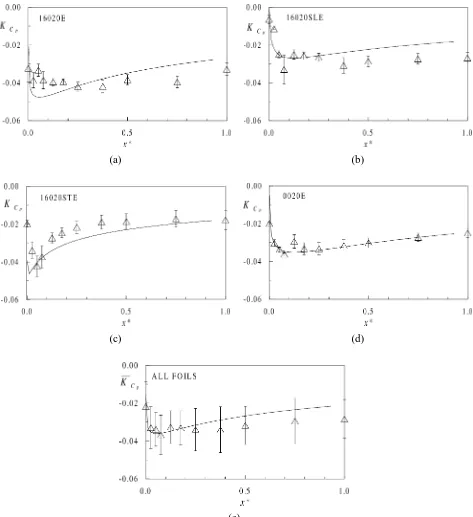
Figures 8(a)–8(d) show the evolution of KCPmin along the vortex path modeled using Eq. (12) and the
(a) (b)
(c) (d)
(e)
Figure 8.KCP as a function of the nondimensional distance from the foil. Continuous line is the model results. Symbols and vertical bars are
the averaged experimental values and the standard deviations obtained from experimental conditions given on table I: (a) 16020E, (b) 16020SLE, (c) 16020STE, (d) 0020E, (e) mean values ofKCP computed using the previous results for the model (continuous line) and the experimental data
Table III. Model parameters, vortex core growth parameter,b∗1, value ofκ, nondimensional time of occurrence and location from the foil tip of the minimum pressure coefficient, value of KCPmin characteristic time of roll-up process and relative apparent viscosity computed for
Re=106.
bIn this case, sinceγ is out of the range for which Eq. (35) has been established,K
CPmin was obtained by computing the minimum of the
function in Eq. (12).
the same velocity data. As shown, the modeled pressure distributions along the vortex path are quite well representative of the experimental data. Comparing the various configurations studied, the pressure evolution differs depending on the foil planform and cross section. In particular the longitudinal pressure gradients at the tip and downstream the pressure minimum vary strongly. Figure 8(e) summarizes the results, showing the mean ofKCP obtained from the previous curves, for both the model and the experimental data. As shown, the
evolutions are in accordance. The experimental mean ofKCPmin equal to−0.0376, is very close to that of the
model equal to−0.0361 but off by about 18%, in absolute values, from the mean of Kσd, 0.043 (computed
from data in table I). Interestingly enough, the values compare very favorably withKσd =0.036 obtained by
Platzer and Souders [24] with a NACA66 (mod) elliptical foil at Re=5·106. Both values are still lower than the values ofKσd (equal to 0.073, 0.068 and 0.059) found by Maines and Arndt [10] (for 4215, 662-415 and
16-020 foils, respectively) at Re=0.48·106. However, in spite of the large range of experimental condition, the agreement betweenσd andCPminis satisfactory for results obtained in tests conducted at different laboratories,
LEGI, ENSTA and GTH (see figure 9 and table IV). The discrepancy, of about 18%, between −CPmin and σd can be partly ascribed to the axisymmetric flow hypothesis. Relaxation of this hypothesis is one of the open possibilities to improve the methodology proposed here. Effect of spatial wandering or meandering on experimental laser velocimeter measurements which artificially enlarge the size of the measured vortices [4,29] and consequently influence the estimate of the pressure coefficient should be also examined.
The vortex growth parameter,b1∗, ranges from 0.67, for the STE foil, to 1.3, for the SLE foil, with a mean
value (see table III) close to one (0.949)). As shown in figure 10(a), there is a clear trend indicating that the cavitation inception should be retarded when the values ofb∗
1 increase and as a result, foils developing tip
vortices characterized by relatively large values ofb1should be appropriate to delaying cavitation.
In figure 2 of Zeman [3] the values of b1 obtained from Baker et al. [2], Baker et al.’s data correlate as b1∼5(Ŵ0/ν)−0.5for a foil operating at Re=104. Using Eq. (17), withb1∗=0.949 and Re=104, we find here b1=5.56(Ŵ0/ν)−0.5. Taking into consideration that Zeman conditions are for the far field and ours conditions
are for the near field, this result is rather encouraging and seems to indicate that the growth parameter seems to be quite universal and characterizes tip vortices in both the near and far field.
Finally, it is interesting to look on the effect of the apparent viscosity, ν¯T, highly dependent on the foil planform, (see table III) since it ranges from 58ν, for the 16020E foil, to 133ν, for the 16020SLE foil, for
Re=106; thus, two orders of magnitude larger than the molecular viscosity. As shown in figure 10(b), whenν¯
(a) (b)
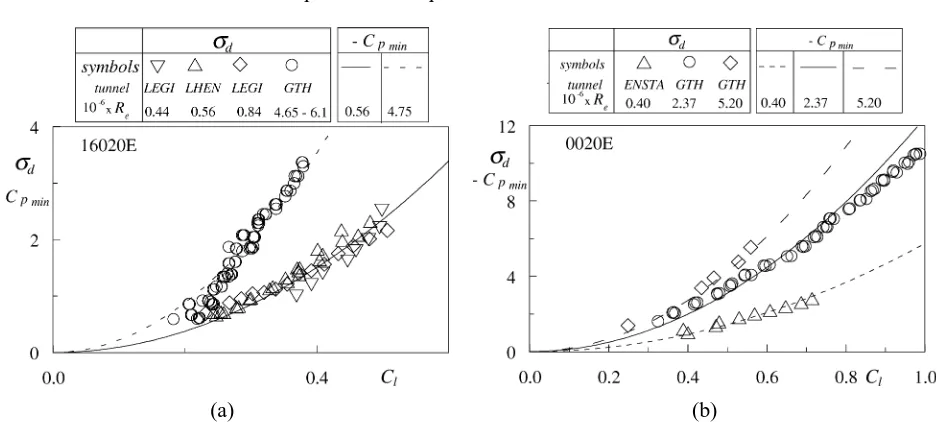
Figure 9. Experimental desinent cavitation number (symbols) and modeled minimum pressure coefficient (dashed and continuous lines) as a function of the lift coefficient (a) for the 16020E foil and (b) for the 0020E foil. Experimental data are adapted from the A.C.C. databank.
(a) (b)
Figure 10.KCPminas a function of: (a) the vortex growth rate; (b) the relative apparent viscosity.
Table IV. Values ofKσd obtained in different facilities at various Reynolds numbers for
both cross sections. Mean value ofKσd and opposite ofKCPmin obtained by the predictive
model.
Foil 16020E 0020E
Tunnel LEGI GTH ENSTA GTH
10−6×Re 0.44 0.84 4.75 6.1 0.4 2.37 5.2
Kσd 0.0485 0.0399 0.0474 0.043 0.0338 0.0318 0.0364
mean value 0.0447 0.034
increases, KCPmin decreases suggesting that an augmentation of the apparent viscosity may be a way to delay
cavitation onset. According to Eq. (33), this is equivalent to an increase ofα0, α, orT∗.
6. Conclusions
Prediction of cavitation inception in wing tip vortices has been investigated. Using detailed tangential and axial velocity data in the very near region of tip vortices (for distances comprised between the foil tip and one maximum chord) issued from foils having an elliptical distribution of chord as well as two cross sections, and also using polymer solution ejection it has been possible to show that:
(a) The nondimensional radius of the tip vortex, a∗ is a linear function of (Ŵ∗t∗)0.5, where Ŵ∗ is a
nondimensional local vortex intensity and t∗ the nondimensional time for a fluid particle to reach a
given station along the vortex path.
(b) The zero ordinate is the initial core radius condition, and the slope is the vortex growth rate,b1which is
found to be proportional to(Ŵ0/ν)−0.5Re0.3.
Based on the above findings, a model which enables the description of the evolution of the tip vortex characteristics and to estimate the value and the position of the minimum pressure coefficient along the vortex path has been developed. To achieve this, both the core radius and the vortex intensity are described by power law functions with the exponents selected in such a way that a∗∼(Ŵ∗t∗)0.5 is satisfied. For the considered
experimental conditions, the model leads to the following conclusions:
(i) vortex diffusion, during the roll-up process, occurs as if the fluid had an apparent viscosity of about two orders of magnitude larger than the molecular viscosity,
(ii) the minimum pressure coefficient strongly depends on the initial conditions at the tip of the foil, (iii) the modeled minimum pressure coefficient agrees well with the experimental desinent cavitation
number obtained in various cavitation tunnels operating 4·105<Re<6·106,
(iv) the minimum pressure occurs very close to the foil tip, within an interval ranging from one hundredth to one tenth of the maximum chord, and
(v) delaying cavitation inception can be achieved by increasing the vortex growth rate or the apparent viscosity.
It has to be stressed that, since the near field behavior of the tip vortices is very much dependent on the hydrofoil planform, cross section and tip geometry (for rectangular and trapezoidal foils in particular), the present results can only be employed for foils having an elliptical chord distribution. However, the approach to analyze the results is rather general and can be of great practical interest in most engineering situations. The authors pointed out that if the scaling relationships (a∼δ, Ŵ ∼Ŵ0) and the axisymmetric vortex flow (CP ∼(Ŵ/a)2)can be hypothesized, the model can reasonably apply to other situations with different loading distributions.
Since only four parameters are needed (initial vortex parameters (α0, γ0) and vortex growth parameters (α, γ )) the model gives important trends which allow simple examination of conditions mitigating the occurrence of cavitation on lifting surfaces. Because it provides a concise presentation of the numerous cases investigated, the model can also be used as a guideline or as a benchmark by the developers of numerical codes which are capable of simulating tip vortex roll-up and diffusion in the near field.
Acknowledgements
This work has been supported by the Direction de la Recherche et de la Technologie (DRET) of the French Ministry of Defense, under the Action Concertée Cavitation program. Mr. Franck Desit was the contract monitor. Ours thanks go to all our fellow scientists participating in the program, specially for the use in the present paper of experimental results they have carried out in their own facilities.
References
[1] Chigier N.A, Corsiglia V.R., Wind-tunnel studies of wing wake turbulence, J. Aircraft 9 (12) (1972) 820–825.
[2] Baker G., Barker S.J., Bofah K.K., Saffman P.G., Laser anemometer measurements of trailing vortices in water, J. Fluid Mech. 65 (2) (1974) 325–336.
[3] Zeman O., The persistence of trailing vortices: A modeling study, Phys. Fluids 7 (1) (1995) 135–143.
[4] Devenport W.J., Rife M.C., Liapis S.I., Follin G.J., The structure and development of a wing-tip vortex, J. Fluid Mech. 312 (1996) 67–106. [5] Billet M.L., Holl J.W., Scale effects on various types of limited cavitation, J. Fluid Eng-T ASME 103 (1981) 405–414.
[6] Stinebring D.R., Farell K.J., Billet M.L., The structure of a three dimensional tip vortex at high-Reynolds number, J. Fluid Eng-T ASME 113 (1991) 496–503.
[7] Fruman D.H., Dugué C., Pauchet A., Cerrutti P., Briançon-Marjollet L., Tip vortex roll-up and cavitation, in: 19th Symposium on Naval Hydrodynamics, Seoul, 1992.
[8] Maines B.H., Arndt R.E.A., Bubble dynamics of cavitation inception in a wing tip vortex, ASME FED 153 (1993) 93–97. [9] Maines B.H., Arndt R.E.A., Viscous effects on tip vortex cavitation, ASME FED 177 (1993) 125–132.
[10] Maines B.H., Arndt R.E.A., Tip vortex formation and cavitation, J. Fluid Eng-T ASME 119 (1997) 413–419. [11] A.C.C. databank, http://www.ecole-navale.fr/bank.acc.htlm (on request).
[12] Fruman D.H., The “Action Concertée Cavitation” research program and accomplishments, in: Proceedings of 5th International Symposium on Cavitation, CAV’95, Deauville, France, 1995, pp. 211–217.
[13] Fruman D.H., Cerrutti P., Pichon T., Dupont P., Effect of hydrofoil planform on tip vortex roll-up and cavitation, J. Fluid Eng-T ASME 117 (1) (1995) 162–169.
[14] Pauchet A., Briançon-Marjollet L., Gowing S., Cerrutti P., Pichon T., Effect of foil size and shape on tip vortex cavitation occurrence, in: Proceedings of 2nd International Symposium on Cavitation, Tokyo, Japan, 1994.
[15] Pichon T., Pauchet A., Astolfi J.-A., Fruman D.H., Billard J.-Y., Effect of tripping laminar-to-turbulent boundary layer transition on tip vortex cavitation, J. Ship Res. 41 (1) (1997) 1–9.
[16] Pauchet A., Viot X., Fruman D.H., Effect of upstream turbulence on tip vortex roll-up and cavitation, in: ASME Cavitation and Multiphase Flow Forum, San Diego, CA, USA, 1996.
[17] Boulon O., Franc J.-P., Lami P., Michel J.-M., Mory M., Tip vortex cavitation on an oscillating hydrofoil, in: Proceedings of 5th International Symposium on Cavitation, CAV’95, Deauville, France, 1995, pp. 145–152.
[18] Boulon O., Franc J.-P., Michel J.-M., Effet du confinement sur la cavitation de tourbillon marginal, in: 3èmesjournées cavitation, Colloque de la Société Hydrotechnique de France, Grenoble, Publications S.H.F, 1996, pp. 51–60.
[19] Deniset F., Pellone C., Confinement influence on tip vortex development, in: Proceedings of 5th International Symposium on Cavitation, CAV’95, Deauville, France, 1995, pp. 425–432.
[20] Gowing S., Briançon-Marjollet L., Frechou D., Godefrroy V., Dissolved gas and nuclei effects on tip vortex cavitation inception and cavitating core size, in: Proceedings of 5th International Symposium on Cavitation, CAV’95, Deauville, France, 1995, pp. 173–180.
[21] Briancon-Marjollet L., Merle L., Inception, development, and noise of a tip vortex cavitation, in: 20th Symposium on Naval Hydrodynamics, Trondheim, Norway, 1996, pp. 278–290.
[22] Fruman D.H., Pichon T., Cerrutti P., Effect of a drag-reducing polymer solution on tip vortex cavitation, J. Mar. Sci. Technol. 1 (1995) 13–23. [23] McCormick B.W., On cavitation produced by a vortex trailing from a lifting surface, J. Basic Eng. (September 1962) 369–379.
[24] Platzer G.P., Souders, W.G., Tip vortex cavitation characteristics and delay on a three-dimensional hydrofoil, in: 19th American Towing Tank Conference, 1980.
[25] Arakeri V.H., Higuchi H., Arndt R.E.A., A model for predicting tip vortex cavitation characteristics, J. Fluid Eng-T ASME 110 (1988) 190–193. [26] Hsu C.C., Studies of scaling of tip vortex cavitation inception on marine lifting surfaces, J. Fluid Eng-T ASME 113 (1991) 504–508. [27] Ferreira De Sousa P.J.S.A., Falcao De Campos J.A.C., A method for the prediction of the minimum pressure in tip vortices from
three-dimensional foils, in: ASME 1996, FED-Vol. 236, Fluids Engineering Division Conference, 1, 1996, pp. 471–478.
[28] Viot X., Jeanson C., Fruman D.H., Investigation of tip vortex cavitation by hydrofoil fractionation, in: ASME FED, Vancouver, Canada, June 1997, pp. 22–26.