VALIDATION OF SATELLITE SOIL MOISTURE RETRIEVALS USING
PRECIPITATION RECORDS IN INDIA
L. Karthikeyana, D. Nagesh Kumara
a Department of Civil Engineering, Indian Institute of Science, Bangalore-560012, India. [email protected]
Commission VIII, WG VIII/4
KEY WORDS: Soil Moisture, Validation, Precipitation, Remote Sensing
ABSTRACT:
Soil moisture plays crucial role in influencing the components of hydrologic cycle and thus used for large range of applications such as climate predictions, agriculture management and flood/drought modelling. The current work focuses on establishing a measure to check the performance of passive microwave satellite soil moisture data using rainfall information over India. The measure is developed based on the concepts of information theory and copulas. Two soil moisture products developed by, VUA-NASA (jointly by Vrije Universiteit Amsterdam and NASA) and university of Montana are tested with the proposed measure using IMD rainfall data at 0.25° latitude-longitude spatial resolution. The measure conveyed that soil moisture product by university of Montana has outperformed over its counterpart. Further analysis concluded that under moderate climate conditions, Montana product could be used for analysis whereas for study in extreme weather conditions it may be necessary to check the usefulness of VUA-NASA product.
1. INTRODUCTION
The study of soil moisture plays an important role in understanding the hydrologic cycle. Though it accounts for less than 1/10000th of total earth’s water content, the presence of it at land atmosphere interface strongly affects the energy and water exchanges. The soil moisture studies have been utilized in two important aspects of hydrology, one, modelling and prediction of catastrophic events such as droughts and floods and two, climate change studies. However, the truthfulness of such a modelling is highly dependent on accuracy of soil moisture observations which is often a difficult process to achieve across spatial and temporal scales. The reasons could be attributed to the heterogeneous behaviour of soil moisture and geographic, financial constraints to establish a very dense station network. Also, one may not be able to generalize their findings to a larger area based on at site studies (Prigent et al., 2005). This lead to retrieval of soil moisture through satellite remote sensing.
Much attention has been paid towards retrieval from passive microwave sensors. This is because of its advantages such as a) the measurement is strongly dependent on dielectric property of target, which, in case of soil is directly influenced by its moisture content; b) the abstractions due to atmosphere are minimum allowing retrieval at any weather; c) retrieval can be done independent of solar illumination angle. Several satellite microwave sensors such as SMMR, SMM/I, TMI, AMSR-E, SMOS (Liu et al., 2012; Kerr et al., 2012) were deployed for global scale soil moisture retrievals.
Fundamentally, the passive microwave remote sensing of soil moisture involves a retrieval algorithm (which is based on radiative transfer theory and dielectric mixing model) that uses the brightness temperature data (at appropriate sensitive frequency and along with some ground based ancillary data) at a grid location as input and produce corresponding soil moisture value. Numerous soil moisture retrieval algorithms have been formulated in literature (Jackson, 1993; Owe et al., 2001; Jones
and Kimball, 2011; Pan et al., 2014) to obtain soil moisture from microwave data. It is important to note that there is high variability among the output generated by these algorithms even though the source of data (brightness temperature) remains same. Reasons could be a) the kind of assumptions that are made; b) formulation of radiative transfer models and c) soil physics that is being involved. The soil moisture produced from retrieval algorithms are validated using insitu soil moisture observations currently being hosted by International Soil Moisture Network (ISMN) (Dorigo et al., 2011) which comprises of 1588 stations spread across the world. The measurements across these stations are dependent on factors such as instrument specifications, method of measurement etc. So, one may not expect homogeneity across all the stations (both in terms of magnitude as well as units of measurement) which could lead to a situation wherein data pertaining to some stations may not be useful at all for validation. Also, the countries like India completely lack freely available comprehensive insitu soil moisture network. At this stage it is important to decide which among products provides better soil moisture information over a region. Hence, there is a necessity to formulate a method by which one can reasonably be sure about the performance of soil moisture sans insitu data.
Based on the concepts of hydrometeorology, it can be understood that the variability of soil moisture at a particular location is predominantly influenced by the amount of precipitation recorded in the region. This relationship can be assumed to be nonlinear in nature since other factors such as evapotranspiration, runoff and drainage also affect the quantity of soil moisture (if not so significant as that of precipitation). In the current work, a new measure is proposed to quantify the accuracy of soil moisture products based on precipitation. It is formulated using the concepts of information theory and copulas. The method requires spatially and temporally concurrent precipitation information along with concerned soil moisture products for evaluation. The analysis has been carried to compare the performance of two soil moisture products derived from AMSR-E sensor over India using recently
The International Archives of the Photogrammetry, Remote Sensing and Spatial Information Sciences, Volume XL-8, 2014 ISPRS Technical Commission VIII Symposium, 09 – 12 December 2014, Hyderabad, India
This contribution has been peer-reviewed.
developed high spatial resolution gridded precipitation data records procured from Indian Meteorological Department (IMD). Upon acquiring the data from respective sources, they are processed grid wise and prepared for analysis. Based on results obtained from proposed measure, further investigation is carried out to understand the dynamics of corresponding algorithms.
2. DATA AND ITS PROCESSING
As mentioned previously, the current work focuses on comparing AMSR-E passive microwave radiometer based two soil moisture products one developed jointly by Vrije Universiteit Amsterdam & NASA (Owe et al., 2001; from now referred to as VUAN) and other by University of Montana (Jones and Kimball, 2011; from now referred to as MONT). AMSR-E instrument is installed on polar orbiting Aqua satellite platform that operated from June 19, 2002 to October 3, 2011. Concurrently both the data products are available from June 19, 2002 to September 27, 2011 (a total of 3386 days excluding last day of leap years 2004 and 2008). VUAN involved retrievals from X-band (10.65 GHz) frequency whereas MONT algorithm is based on C-band (6.925 GHz) brightness temperature values. In the latter case since C-band is affected by radio frequency interference at some locations, the retrievals are then replaced with X-band retrievals. The precipitation data obtained from IMD is developed by Pai et al., (2014). Data is made available at daily scale covering period of 113 years (1901-2013) over India with a spatial resolution of 0.25°×0.25°. A total of 6995 rain gauge stations spread across the country were considered for preparation of gridded data. Since the gauge stations have underwent necessary quality control before gridding, the precipitation data is assumed to be consistent without any form of errors. A summary of details pertaining to datasets used in the current study are presented in Table 1.
Data Product Hosted by Availability From To
Daily Global Land Surface Parameters Derived from AMSR-E
National Snow and Ice Data Center (NSIDC) NASA
19 June, 2002
27 September,
2011
Land Parameter Retrieval Model (LPRM) based AMSR-E daily Level 3 Ascending/ Descending Surface Soil Moisture, Ancillary Params, and QC
Goddard Earth Sciences Data and Information Services Center (GES DISC)
19 June, 2002
3 October, 2011
High spatial resolution (0.25° × 0.25°) Long Period (1901-2010) daily gridded rainfall data set over India
Indian Meteorological Department (IMD)
1901 2010
Table 1. Data Products
Before the datasets are used for analysis, some amount of spatial processing is carried out. VUAN data is available at 0.25° latitude longitude grid while MONT data is provided in Equal Area Scalable Earth Grid (EASE) format which is available in a global cylindrical grid with spacing of 25 km. These two products are resampled with reference to IMD rainfall grid locations using inverse distance weighted average method. Care
has been taken to carry out the interpolation from nearest possible surrounding grids due to which the resampling yielded meaningful values with a minimum loss of information. This process ensured of obtaining three datasets (one rainfall and two soil moisture products) at each IMD grid location. The AMSR-E sensor recorded two observations per day one at ascending pass (which passes north across equator at approximately 1:30 PM) and other during descending pass (which passes south across equator at approximately 1:30 AM). Due to difference in soil temperature conditions, the soil moisture values may vary between ascending and descending passes. Hence in order to quantify average amount of moisture accumulated for a particular day, average of ascending pass and descending pass data is considered with an assumption that the resultant value would be approximately relevant to the amount of precipitation recorded on that day. Later filtering of datasets is carried out wherein it is made sure that at a particular date, observations exist in all three datasets and rest of days were removed if at least one of the datasets lack data. This step ensures that the measures are unaffected by the amount of missing data in each product. Figure 1 present the maps of mean values of rainfall, VUAN and MONT across all the grids cells of India.
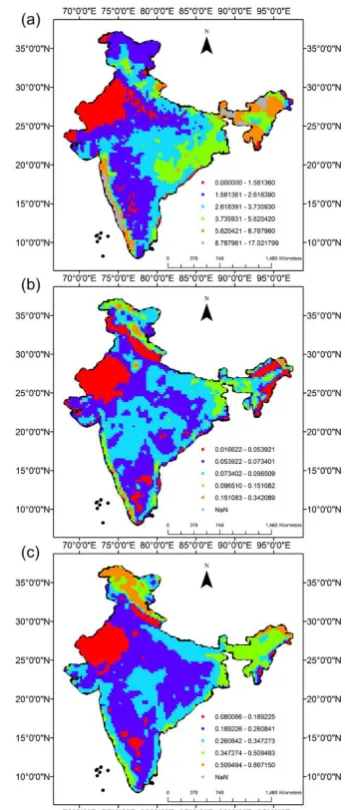
Figure 1. Grid wise mean (a) IMD rainfall (b) MONT soil moisture (c) VUAN soil moisture for the period June 19, 2002 to September 27, 2011
The International Archives of the Photogrammetry, Remote Sensing and Spatial Information Sciences, Volume XL-8, 2014 ISPRS Technical Commission VIII Symposium, 09 – 12 December 2014, Hyderabad, India
This contribution has been peer-reviewed.
Mean rainfall map [Figure 1(a)] replicate general rainfall characteristics of India. One can observe extremes i.e., scarce and dense rainfall along Western Ghats & parts of North-Eastern India and Rajasthan respectively. Rainfall of much portion of India is present to be around the median of mean rainfall. Considering rainfall to be dominantly affecting soil moisture content, soil moisture maps are interpreted accordingly. In case of MONT product map [Figure 1(b)], it is evident that Rajasthan region was well retrieved that imply very dry soils, the soils along Western Ghats are recorded with high moisture content which have might be in agreement with rainfall occurrence in that region, portion of Jammu region is shown to be having extremely low moisture content needs further investigation on its accuracy. Even VUAN product [Figure 1(c)] seems to have captured well the moisture content of Thar desert. Moisture values in Jammu & Kashmir (J&K) in VUAN product are quite opposite to what has been exhibited by the previous dataset. Some noticeable aspects drawn in general are, the region of Delhi in shown to be having almost scanty mean rainfall which is supportively retrieved by VUAN product which in case of MONT is quite opposite with very high soil moisture content, both the maps of soil moisture have shown a strip of very low soil moisture values along the states of Uttaranchal and Himachal Pradesh which might need further analysis on the selection of right product and accuracy. Datasets obtained from the aforementioned processing are now used for analysis. Details on the proposed measure are presented in the following section.
3. COPULA BASED MUTUAL INFORMATION MEASURE
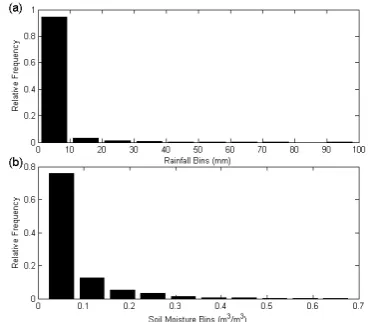
As mentioned in previous section, precipitation plays key role in influencing soil moisture content. So, an attempt is made to quantify their relationship. It is important to note that the data of precipitation and soil moisture are in general nonstationary by nature at daily scale. Also, the distribution of precipitation is expected to be skewed towards lower side due to the existence of large number of non-rainy days which ultimately affects the distribution of soil moisture. Typical histograms of precipitation and soil moisture (from MONT) at one of the grid cells of India (17.5° N 76.25°E) that express the skewedness are presented in Figure 2.
Figure 2. Histograms of (a) daily rainfall (IMD) (b) mean daily soil moisture (MONT)
Hence either assuming that the datasets are stationary or on flipside, normally distributed may not be reasonable. Due to the
above phenomena the computation of standard dependency measures such as Pearson correlation coefficient to understand the relationship may not be applicable. This lead to a more generalized form called mutual information.
Mutual Information (Im) is a nonnegative scalar quantity that
quantifies mutual dependency between two random variables. Innately it measures how much one random variable explains the other random variable. So, more is the value of Im between
two variables, less would be the uncertainty in one variable knowing other or vice versa. In the current case, Im is used to
quantify dependency between rainfall and soil moisture. The measure can be better understood if the problem is formulated this way “knowing soil moisture how better one can explain the distribution of rainfall?” This is because the precipitation records are consistent and since there is uncertainty in selection of soil moisture product, one need to check which product is able to reduce the uncertainty in rainfall data. For two discrete random variables S (soil moisture) and R (rainfall), Im is
calculated as follows:
,, , log
m
R r S s
p s r
I S R p s r
p s p r
(1)where, p s r
, is the joint probability density function of soilmoisture and rainfall, p s and
p r
are marginal probability density functions of soil moisture and rainfall respectively. Intuitively it can be understood from the above equation that Immeasures distance between actual joint distribution between S and R and joint distribution assuming independency between S and R. Since Im is a distance measure, it is always non negative
and symmetric i.e., Im
S R, 0andIm
S R, Im
R S, . Imwith a value zero indicates that the variables under study are independent of each other i.e., one variable does not provide any information about the other.
In order to compute Im between soil moisture and rainfall one
need to define their respective marginal density functions and joint density functions. As discussed before the datasets of soil moisture and rainfall cannot be constrained by assuming that they follow some parametric distributions under much unrealistic stationarity conditions. This lead to usage of copula theory. Copula is defined as a multivariate probability distribution for which marginal probabilities of each variable are uniformly distributed. Sklar’s theorem (Sklar, 1959), any multivariate distribution can be obtained from univariate marginal distribution functions and a copula function that contain dependence structure between variables of interest. This is an advantageous aspect because one can estimate joint distribution by separately estimating marginal distributions and copulas. Several parametric copula families (Nelsen, 2007) are available in literature. The parametric copula usually contains parameter that controls the strength of dependence between variables. Among them Archimedean family of copulas is extensively used in the field of hydrology due to their emphasis on tails as well as over median of the distribution. For the current study, Gumbel copula of Archimedean family is utilized for the analysis. In order to define the relationship between variables (which forms the parameter of copula), Kendall’s tau dependency measure is used. A nonparametric kernel density estimator with normal kernel function is used to define individually the marginal probability density functions
p s andp r
. Lastly with the aid of marginal densityThe International Archives of the Photogrammetry, Remote Sensing and Spatial Information Sciences, Volume XL-8, 2014 ISPRS Technical Commission VIII Symposium, 09 – 12 December 2014, Hyderabad, India
This contribution has been peer-reviewed.
functions and copula function, joint probability density function
,p s r is computed. The resulting values are substitutes accordingly in Eq (1) to obtain mutual information between soil moisture and rainfall.
4. RESULTS AND DISCUSSION
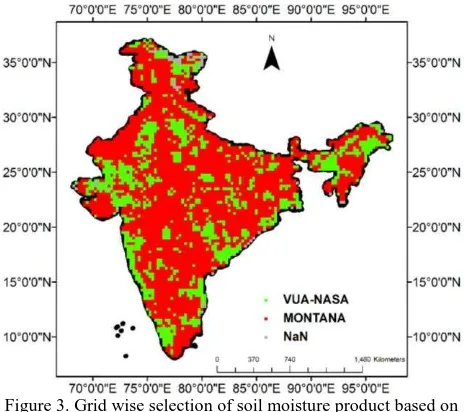
The proposed mutual information measure explained in the previous section is applied separately to VUAN and MONT datasets with IMD rainfall grid wise. At a cell grid cell, the soil moisture product with greater mutual information is selected since it is able to explain more variability in rainfall (and vice versa) when compared with the other soil moisture product. Results thus obtained are compiled in Figure 3.
Figure 3. Grid wise selection of soil moisture product based on proposed mutual information measure
It is observed that all most 99 % of grids have been computed with valid values of Im, the rest of the pixels concluded with no
result due to lack of data. Of these grids it can be observed that MONT dataset has outperformed over VUAN product. Almost 73 % of grids have been selected with MONT and rest (~27 %) with VUAN. It is observed that in Western Ghats region and Kerala which have extreme rainfall conditions, VUAN product consistently exhibited better mutual information values. In central India region, in a very significant portion of pixels, MONT product has been selected. In case of extreme climate regions like Rajasthan, J&K and Northeast India, important contribution is made by VUAN product despite most pixels have comparably better MONT records. Moreover in the region of Delhi, as expected, VUAN product is selected which indicates the strength of proposed measure in identifying the anomalous datasets. So under extreme weather conditions, it may be necessary to consider even the performance of VUAN along with MONT for modeling and later compare the outcomes.
5. CONCLUSIONS
The current work focusses on a measure which is based on information theory to evaluate accuracy of satellite retrieved soil moisture products over India using rainfall information. Two soil moisture products (VUAN and MONT) and IMD rainfall are used for analysis. It is concluded that MONT can be
used over most portions of India that have moderate climatic conditions. In case of extreme weather regions, it would be a better option to consider outcomes through other products such as VUAN and decide accordingly.
REFERENCES
Dorigo, W. A., Wagner, W., Hohensinn, R., Hahn, S., Paulik, C., Xaver, A., ... & Jackson, T., 2011. The International Soil Moisture Network: a data hosting facility for global in situ soil moisture measurements. Hydrology and Earth System Sciences, 15(5), 1675-1698.
Jackson, T. J., 1993. Measuring surface soil moisture using passive microwave remote sensing. Hydrological processes, 7(2), 139-152.
Jones, L. A., & Kimball, J. S., 2011 updated 2012. Daily Global Land Surface Parameters Derived from AMSR-E. Version 1.2. Boulder Colorado USA: National Snow and Ice Data Center. Digital media (http://nsidc.org/data/nsidc-0451.html).
Kerr, Y. H., Waldteufel, P., Richaume, P., Wigneron, J. P., Ferrazzoli, P., Mahmoodi, A., ... & Delwart, S., 2012. The SMOS soil moisture retrieval algorithm. Geoscience and Remote Sensing, IEEE Transactions on, 50(5), 1384-1403.
Liu, Y. Y., Dorigo, W. A., Parinussa, R. M., De Jeu, R. A. M., Wagner, W., McCabe, M. F., ... & Van Dijk, A. I. J. M., 2012. Trend-preserving blending of passive and active microwave soil moisture retrievals. Remote Sensing of Environment, 123, 280-297.
Nelsen, R. B., 2007. An introduction to copulas. Springer.
Owe, M., de Jeu, R., & Walker, J., 2001. A methodology for surface soil moisture and vegetation optical depth retrieval using the microwave polarization difference index. Geoscience and Remote Sensing, IEEE Transactions on, 39(8), 1643-1654.
Pai, D., Sridhar, L., Rajeevan, M., Sreejith, O., Satbhai, N., & Mukhopadhyay, B., 2014 Development of a new high spatial resolution (0.25°× 0.25°) long period (1901-2010) daily gridded rainfall data set over India and its comparison with existing data sets over the region. Mausam, 65 (1), 1-18.
Pan, M., Sahoo, A. K., & Wood, E. F., 2014. Improving soil moisture retrievals from a physically-based radiative transfer model. Remote Sensing of Environment, 140, 130-140.
Prigent, C., Aires, F., Rossow, W. B., & Robock, A., 2005. Sensitivity of satellite microwave and infrared observations to soil moisture at a global scale: Relationship of satellite observations to in situ soil moisture measurements. Journal of Geophysical Research: Atmospheres (1984–2012), 110(D7).
Sklar, A., 1959, Fonctions de répartition à n dimensions et leurs marges, Publ. Inst. Statist. Univ. Paris 8. 229–231.
The International Archives of the Photogrammetry, Remote Sensing and Spatial Information Sciences, Volume XL-8, 2014 ISPRS Technical Commission VIII Symposium, 09 – 12 December 2014, Hyderabad, India
This contribution has been peer-reviewed.