GEOMORPHIC DETERMINANATS OF LANDUSE INTENSITY
Chhabi Lal Chidi Central Department of Geography Tribhuvan University, Kathmandu, Nepal
Email: Chh_chidi1963@yahoo.com
KEY WORDS: Dummy variable, Geomorphic variable, Landuse intensity, Object based image analysis, Grid cell base
ABSTRACT:
Increasing population growth and lacking of further spatial expansion of various landuse have compelled to look intensity dimension of landuse. Grid cell based data extraction can give unique character of each locality of small land unit area which is very suitable technique for data extraction in the hill areas like Nepal. Landform plays an important role determining landuse intensity. Freely available 30m resolution Aster GDEM image has been used to extract geomorphic variables. Landuse data has been taken from aerial photo 1996. Quantitative weight has been given to landuse categories on the basis input, output and ecological importance for human life. One hectare square grid cells have been generated to extract geomorphic and landuse intensity information. The result shows that the average intensity of landuse is highly related to summarized categories of each geomorphic variable. Graphical presentation and quantitative analysis have been used to identify the effect of geomorphic variables on land use intensity. Simple and multiple correlation and regression analysis shows that there is higher control of altitude, slope gradient and slope aspect on landuse intensity. The average landuse intensity is highly determined by geomorphic variable then in local level. Multiple correlation coefficients is found to be 0.42 and the adjusted R² representing coefficient of determination is 0.178 which is significant at more than 99% of confidence level. So, it can be concluded that geomorphic factors have contributed 17.8% of the total variation determining landuse intensity in the study area.
.
1. INTRODUCTION
Landuse and land cover are prominent eco-logical symbols within the surface system of the earth, and refers to human manipulation of the land to fullfill their need. Land cover is defined as the physical surface condition of the land which is likely to change as a result of landuse change (Turner et al. 2001). Furthermore, landuse influences the environment mainly by land cover, and thus landuse and land cover are inter-related. Changes in landuse intensity play an essential role in land-use transitions and can be more pronounced than changes in land cover but immense research efforts are currently focusing on analyzing land cover changes and their role in the Earth system but fewer attempts exist to quantify and map changes in landuse intensity (Erb 2012). Traditional approaches often only examine one or a few aspects of land-use intensity while disregarding the multidimensionality of the intensification process in the complex land system (Turner et al. 2007; Lambin and Meyfroidt 2011). A better characterization of the spatial patterns land use intensity is crucial to monitor the various environmental and societal impacts of land use, and to understand the drivers of changing land use intensity (Kuemmerle et al. 2013). The conceptual framework to quantify and analyze land-use intensity integrates three dimensions: input intensity, output intensity, and the associated system-level impacts of land-based production (Erb et al.2013). Many mechanisms and processes of essential aspects of land-use transitions remain under-researched to date. Neither data bases nor conceptualizations are currently available at sufficient quality and quantity to allow for integrated analyses of land-use intensification (Erb 2012). Large knowledge gaps currently exist that limit our ability to understand and characterize dynamics and patterns of land-use intensity: in particular, a
2. MATERIALS AND METHODS
This study is completely based on Digital Elevation Model (DEM) image and aerial photo. DEM image was used for extracting geomorphic variables (slope gradient, elevation and slope aspect) and aerial photo has been used to extract landuse information. The materials and methods applied in this study have been described as follows.
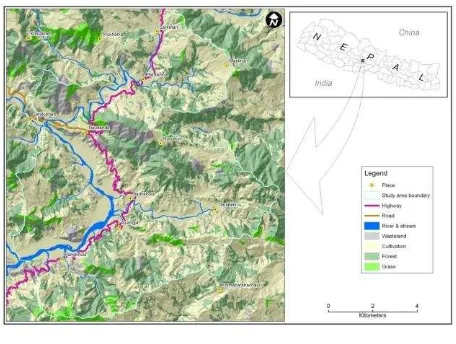
2.1 The Study Area
Northeastern part of Andhikhola watershed has been selected as the study area which is located in the middle hill of Western Nepal. It lies in Syangja district of Gandaki Zone. The area of this watershed is 97.75 sq. km. It extends from 28°03'40" N to 28°11'02"N parallels of latitude and from 83°49'30" to 83°56'51" east meridians of longitude. The elevation of the study area ranges from 779m to 1566m from mean sea level. Most of the area is steeply sloping hills sides and limited area of river basin is flat land. Higher proportion of hill slope area is under cultivation for cereal and cash crops by terracing and lower flat area is irrigated paddy field. The annual rainfall is 2800 to 3200 mm. Eighty percent of total annual rainfall is contributed by summer monsoon and remaining 20 percent by
winter. Temperature ranges from 5˚C to 32˚C. Winter is cold
and summer is warm. Siddhartha highway (Sunauli-Pokhara) passes through this study area crossing the study areA from southwest to northeast (see fig. 1). So, this area is more accessible than many other parts of Nepal. Land use dynamics among land-use categories are due to abandonment of marginal cultivation at the higher elevations, conversion of low-lying lands into rice fields, increase of forest cover in community protected forests, plantation on degraded private lands, clearing low-lying forests for agricultural expansion, timber harvest for fuel wood and timber for construction (Balla et al. 2007).
Figure 1: The study area
2.2 Generating geomorphic variables
Freely available 30m resolution Aster GDEM has been used to extract geomorphic variables. That is available in the website http://gdem.ersdac.jsspacesystems.or.jp. This image has been converted to 100m resolution. Slope gradient, slope aspect and elevation of 100m pixel were calculated in ArcGIS 9.3. Grid cell vector polygon was created on the basis of same image using Erdas Imagine and unique ID for each cell was given. The total number of grid cell of the study area is 9785. Central point of each grid cell was created in ArcGIS 9.2. Altitude, categories east, west, north and south for multivariate analysis to generate dummy variable of slope categories. Next one is eight categories east, southeast, south, southwest, west, northwest, north and northeast. This aspect category has been used to compare with average landuse intensity.
2.3 Landuse intensity data
Landuse data has been taken from aerial photo of 1996 and topographic map of Survey Department of Nepal. Object-based image analysis technique has been used to extract landuse data using eCognition. Landuse is categorized into cultivated land, forest, shrubs, grassland, cliff, wasteland, water body, sand, gravel, degraded land and building area. Additional building point of topographic map has been converted to vector polygon buffering points at the average area of building. Landuse and building point polygons were merged together and created new landuse map including building polygon. Idea of weighting of different landuse category for landuse intensity has been taken from the study of landuse pattern changes during 1990 to 2000 of the Yellow river basin in China (Wang et al. 2010). Some modification on the basis of local differences has been done on the basis of local situation. Quantitative weight has been given to landuse categories on the basis input, output and ecological importance of human use. Building area is given weight four; three for cultivated area; two for forest, shrubs, grassland and water body. Lastly, remaining wasteland, cliff, degraded land are given one. Numerical value of landuse intensity of each grid cell has been calculated on the basis of already created vector grid cell. The value of each grid cell has been calculated using formula given below (see equation 1).
2.5 Statistical analysis
Bivariate analysis of landuse intensity with each determining variable has been done. Correlation coefficient and adjusted R² (with significant level) has been calculated. Multiple regression has been calculated assuming landuse intensity as a dependent variable and altitude, slope gradient and slope aspect as determining variables. For this calculation numerical value of each grid cell has been taken as an object. The total grid cell of the study area is 9785. Among them 87 outlier value were removed for regression modeling. Dummy variable were created for each slope aspect for.
3. RESULT AND DISCUSSION
3.1 General Pattern
Due to the hilly part of Nepal the study area have both lower plain areas at lower altitude river basin and steeper hill sides at higher altitude region. The study area has all types of types of slope aspect. The general description elevation, slope gradient, slope aspect and landuse intensity have been described below.
3.1.1 Elevation: Most of the central and western parts of the
study area have lower elevation than eastern and south. Elevation ranges from below 800 m to above 1600 m is in very limited areas. Most of the area is under the altitudinal ranges between 800 m to 1600 m. These areas are generally arable land in the study area. Higher altitudinal ranges areas are mostly marginal area for intensive cultivation rather than lower altitudinal area (see fig. 2 below).
Figure 2: Elevation range
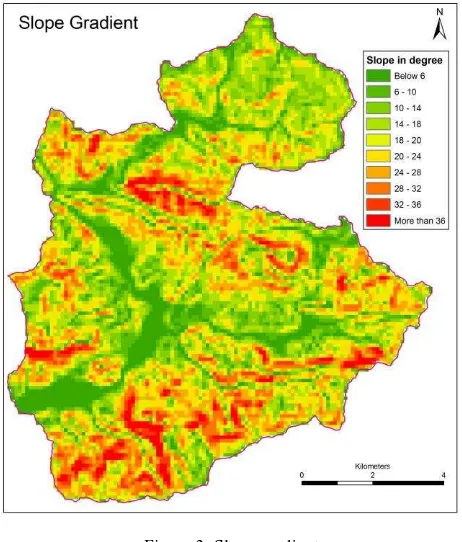
3.1.2 Slope Gradient: Slope gradient is a major controlling
factor of landuse intensity. Various causes may be unsuitable for cultivation at steeper slope rather than less steeper areas. Slope steepness seems higher at the higher altitude areas. Lower altitudes have areas have less steeper. Slope gradient is more than 36 degree slop which most of them are at higher altitude areas. Lower river basin areas have less than 6 degree
slope. Most of the middle altitude areas have moderate slope. Most of these areas have 18 to 28 degree ranges. In general, slope increases with the increase in altitude and highest altitudinal areas have steep slope rather than lower altitude areas. From the figure 2 and 3, it can be concluded that there is positive relationship between altitudes and slope gradient. So, it can control on landuse intensity by combined effect of altitude and slope gradient rather than the effect of single factor.
Figure 3: Slope gradient
3.1.3 Slope Aspect: Complete flat land without any slope
aspect is very limited in the study area.
Because of the gently sloping lower plain area very limited areas are flat. Most of the slope aspect every parts of the study area. South facing slope is mostly at middle and northern areas. This type of slope face is very limited to the southern part. Southeast facing slope is also limited in this area. Southwest facing slope is also not so in this areas.
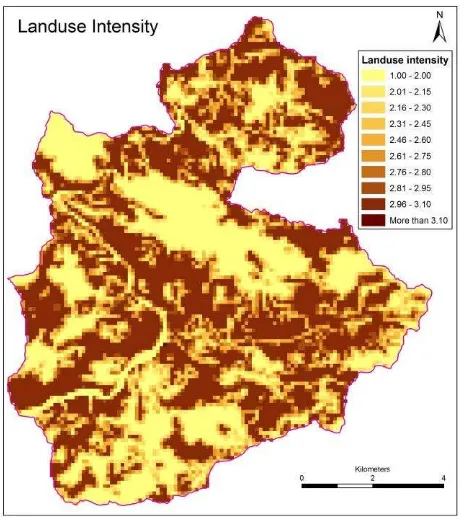
3.1.4 Landuse Intensity: The general pattern of landuse
intensity is more at lower elevation rather than higher area but it is not quite correlated with elevation (see fig. 5). Strip of lower landuse intensity at river course is quite visible due to occupied by river which is not suitable for landuse intensification. Some northern and western parts of higher altitude areas have higher intensity of landuse. Slope aspect has not quite correlation with landuse intensity than elevation. However, south, east, south east and south west facing slopes have lower landuse intensity than others aspects.
Figure 5: Landuse intensity
Landuse intensity has higher negative relation with slope gradient. Higher the slope gradients lower the landuse intensity but it is not applicable in all areas. Some southern part has higher landuse intensity at steeper slope.
3.2 Statistical Relation
Both simple and multiple regression have been used for the verification of statistical relation of landuse intensity with its geomorphic variables. The result of analysis has been described and presented as follows.
3.2.1 General Relation: The average landuse use intensity
with altitude, slope gradient and slope aspect has inversely related (see fig. 6A). Nine categories of altitudinal range has revealed the higher negative correlation with landuse i.e. -0.76 with adjusted R² = 0.53 at more than 98% significance level. However the graphical presentation shows the curvilinear relation rather than straight line relation. There is the highest negative correlation of average landuse intensity with slope gradient (see fig. 6B). The value of correlation coefficient is
-0.94 with adjusted R² = 0.89 at 100% significance level. Figure 6C is the scatter plot of slope aspect giving serial number to eight slope aspects by clockwise rotation starting from east and ending at north east i. e 1 for north and 8 for northeast. Although in the figures 4 and 5 does not show the clear relation between slope aspect and landuse intensity, the statistical calculation represents higher negative correlation between average landuse intensity and slope aspect. The average landuse intensity is more deviated at southeast and northeast direction from this regular pattern of clockwise hierarchy of decreasing landuse intensity. The highest average landuse intensity seems at north and lowest at north. The correlation coefficient between landuse intensity is -0.81 with adjusted R² = 0.599 at 98% significance level.
Figure 6: Relation of average landuse intensity
The relationship of average landuse intensity with altitude, slope gradient and slope aspect is very high which shows that geomorphic variables have greater role on controlling landuse intensity in the study area.
3.2.2 Local level: The local level relation has been identified
using the grid cell level value of all landuse intensity, altitude, slope gradient and slope aspect. Slope aspects have been categorized into four categories for multiple regression and dummy variable were created for it.
Table 1: Correlation matrix
of slope is -0.336 and altitude is -0.150 at 100% significance
level. The β values of slope aspects are very low. The adjusted
R² is equals to 0.178 it means that the combined determination of altitude, slope gradient and slope aspect is 17.8% at local level which is very lower than average landuse intensity.
4. CONCLUSION
Generating landuse intensity from landuse map helps to represent more abstract level landuse character at spatial scale. The distribution pattern of landuse intensity more at lower elevation, less steeper slope and east/south slope face. It can be concluded that the landuse intensity is suitable method to quantify landuse characteristics for statistical analysis. Grid cell based data generation technique is very helpful for statistical analysis at spatial context. It is very helpful to extract location level data generation for analysis. Slope gradient is the most dominant factors controlling landuse intensity. However, elevation and slope aspect have also significant control on landuse intensity pattern. Local level relations of landuse intensity with these factors are weak. It is because of the many outliers. It means only geomorphic determinants are not always major controlling factors. There are several other physical as well as anthropogenic factors. However, altitude, slope gradient and slope aspect have greater control on landuse intensity in the study area.
ACKNOWLEDEGEMENT
U. K Mandal Associate Professor of Tribhuvan University, Kathmandu is thankful for his technical support for this paper
REFERENCES
Balla, M. K., Awasthi, K. D., Singh, B. R., Sitaula, B. K., and Pradhan, B. M., 2007. Land use changes and geomorphometric analyses in Galaundu and Pokhare khola watersheds in Mid-hill region of Nepal. International Journal of Ecology and
Environmental Science, 33 (2-3), pp. 171-182.
Brandt, J. S., Kuemmerle, T. Li, H., Ren, G., Zhu, J and Radeloff, V. C., 2012. Using Landsat imagery to map forest change in south west China in response to the national logging ban and ecotourism development. Remote Sensing of
Environment, 121, pp. 358–369.
Erb, K. H., 2012. How a socio-ecological metabolism approach can help to advance our understanding of changes in land-use intensity. Ecological Economics, 76, pp. 8–14.
www.elsevier.com/locate/ecolecon.
Erb, K. H., Haberl, H., Jepsen, M. R., Kuemmerle, T., Lindner, M., Muller, D. et al., 2013. A conceptual framework for analyzing and measuring landuse intensity. In: Verbung, P. H., Mertz, O., Erb, K. H., and Espindola, G. (Eds.), Current Opinion in Environmental Sustainability, 5, pp. 464–470.
www.sciencedirect.com.
Galiano, V. R. and Olmo, M. C., 2012. Landcover change analysis of a Mediterranean area in Spain using different sources of data: Multi-seasonal Landsat images, land surface temperature, digital terrain models and texture. Applied Geography, 35, pp. 208-218.
Huang, J., Pontius, R. G., Li, Q. and Zhang, Y., 2012. Use of intensity analysis to link patterns with processes of land change from1986 to 2007 in a coastal watershed of southeast China. Applied Geography, 34, pp. 371-384.
Hung, W. H., Chen, Y. C. and Cheng, K. S., 2010. Comparing landcover patterns in Tokyo, Kyoto, and Taipei using ALOS multispectral images. Landscape and Urban Planning, 97, pp. 132–145.
Kuemmerle. T., Erb, K., Meyfroidt, P., Muller, D., Verbung, P. H., Estel, S. et al., 2013. Challenges and opportunities in mapping landuse intensity globally. In: Verbung, P. H., Mertz, O., Erb, K. H., and Espindola, G. (Eds.), Current Opinion in Environmental Sustainability, 5, pp. 484–493.
www.sciencedirect.com.
Lambin, E. F. and, Meyfroidt, P., 2011. Global land use change, economic globalization, and the looming land scarcity. Proceedings of National Academy of Science, U S A, 108, pp. 3465-3472.
Letourneau, A., Verbung, P. H. and Stehfest, E., 2012. A land-use systems approach to represent land-land-use dynamics at continental and global scales. Environmental Modelling & Software, 33, pp. 61-79.
Li, Z., Liu, W. Z and Zheng, F. L., 2013. Landuse changes and its relationship with topographic factors in the Jhing river catchment on the loess Plateau of China. SpringerPlus 2013, 2(1), pp. 53.
Shrivastava, P, Mukharjee, S., Gupta, M. and Singh, S., 2011. Characterizing monsoonal variation on water quality index of river Mahi in India using geographical information system. Water Quality, Exposure and Health, 2, pp. 193-203.
Turner B. L., Lambin E. F., Reenberg A., 2007. The emergence of land change science for global environmental change and sustainability. Proceedings of National Academy of Science, U S A, 104, pp. 20666-20671.
Turner, M. G., Gardner, R. H. and O’Neill, R. (2001),
Landscape Ecology in Theory and Practice: Pattern and Process. NewYork.
Walsh, S. J., Messina, J. P., Mena, C. F., Malanson, G. P. and Page, P. H., 2008. Complexity theory, spatial simulation models, and land use dynamics in the Northern Ecuadorian Amazon. Geoforum, 39, pp. 867–878.
Wang, S. Y., ShiLiub, J. and BoMac, T., 2010. Dynamics and changes in spatial patterns of landuse in Yellow River Basin, China. Land Use Policy, 27. pp. 313–323.