WebGL Visualisation of 3D Environmental Models
Based on Finnish Open Geospatial Data Sets
A. Krooks a, *, J. Kahkonen b, L. Lehto b, P. Latvala b, M. Karjalainen a , E. Honkavaara a
a Finnish Geodetic Institute, Department of Photogrammetry and Remote Sensing - (anssi.krooks, eija.honkavaara, mika.karjalainen)@fgi.fi
b
Finnish Geodetic Institute, Department of Geoinformatics and Cartography – (jaakko.kahkonen, lassi.lehto, pekka.latvala)@fgi.fi
Commission III, WG III/5
KEY WORDS: LiDAR, photogrammetry, change detection, 3D visualization, 3D reconstruction
ABSTRACT:
Recent developments in spatial data infrastructures have enabled real time GIS analysis and visualization using open input data sources and service interfaces. In this study we present a new concept where metric point clouds derived from national open airborne laser scanning (ALS) and photogrammetric image data are processed, analyzed, finally visualised a through open service interfaces to produce user-driven analysis products from targeted areas. The concept is demonstrated in three environmental applications: assessment of forest storm damages, assessment of volumetric changes in open pit mine and 3D city model visualization. One of the main objectives was to study the usability and requirements of national level photogrammetric imagery in these applications. The results demonstrated that user driven 3D geospatial analyses were possible with the proposed approach and current technology, for instance, the landowner could assess the amount of fallen trees within his property borders after a storm easily using any web browser. On the other hand, our study indicated that there are still many uncertainties especially due to the insufficient standardization of photogrammetric products and processes and their quality indicators.
* Corresponding author. This is useful to know for communication with the appropriate person in cases with more than one author.
1. INTRODUCTION
There exists globally a great need for 3D environmental model information. Applications such as city planning, disaster management and environmental monitoring benefit from accurate 3D information. 3D models have been utilized in urban environment for example by analysing the emergency responses in urban areas (Lee and Zlatanova, 2008) and by modelling the port of Rotterdam (Zlatanova and Beetz, 2012). The virtual environments have been seen as a way to provide better understanding of the visualized phenomena (MacEachren and Kraak, 2001). CityGML is one of the most promising standards for 3D environmental models (Kolbe, 2009, Gröger, & Plümer, 2012).
An increasing trend in many countries is that the national topographic data sets are offered for free use. In Finland, the data by the National Land Survey of Finland were opened in May 2012. The free data include for example the national airborne laser scanning (ALS) data as well as orthophotos that are used for production of national topographic database. Other important data sets include for instance cadastral parcel polygons, road networks with address data and ground water areas. Besides the up-to-date data also archived aerial images are scanned and made available to order. (Paikkatietoikkuna, 2014). Open data sources enable new possibilities for both public and commercial services, that make use of geospatial data infrastructures.
Fast development of network technologies generally and standardization of open access interfaces for spatial services in
particular have made map applications one of the standard functionalities available on the Web browser platform.
The new Web browser-based map applications generally provide good support for open service interfaces. This has motivated several content providers to make their data sets available via the popular Open Geospatial Consortium (OGC) -developed service interfaces, like raster map services (Web Map Service, WMS and Web Map Tile Service, WMTS) and geospatial data services (Web Feature Service, WFS and Web Coverage Service, WCS) (OGC 2014). Gradually also service interfaces for data processing and analysis have gained popularity. The main standard for this kind of services is the OGCs Web Processing Service (WPS). These interface standards currently form the basis of the service-based Spatial Data Infrastructures (SDIs). Increased availability of open data sources further emphasizes the importance of standardized access interfaces as a consistent mechanism for the provision of geospatial content.
Also the Web browser-based visualization of spatial content is at the moment in a rapid development phase. The traditional 2D map rendering processes are gradually being complemented with richer, more descriptive and intuitive interactive displays. One particular topic under intensive development is the 3D visualization of geospatial data in Web browsers and also in smart devices. A particular aim in this development is to support 3D visualization on top of the plain browser platform, without any user-installed, application-specific plug-ins. The latest results of these developments open entirely new possibilities for visualization tasks in geospatial applications (Kim et al. 2014). For instance, one can envision an application The International Archives of the Photogrammetry, Remote Sensing and Spatial Information Sciences, Volume XL-3, 2014
for evaluating the effects of rising water levels in a real 3D model of an open pit mine. Another scenario is to estimate the effects of a winter storm inside a forest owner’s property borders.
In this paper we demonstrate the user driven analysis of 3D environmental models based on the Finnish open geospatial data sets: national ALS, aerial photogrammetric images, topographic database and cadastral parcel data. We propose a laserscanning and photogrammetric data sets in the modern WebGL visualization process.
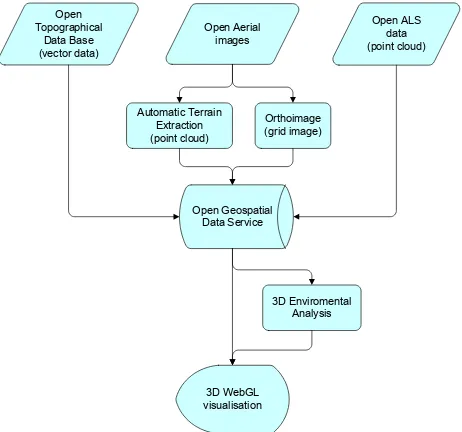
Figure 1: General flow chart of the proposed method.
The process starts with collection and pre-processing of the available open geospatial data. The pre-processed data is distributed via open standard interface services. 3D data analyses are processed on-demand either on web server or with desktop software. The data and results from analysis step are then visualized in standard web browser using 3D WebGL.
2.2 Finnish open 3D data sets
The Finnish nation-wide ALS survey project was started in 2008, and by now more than half of the land area has been covered. The minimum point density of the NLS ALS data is half a point per square meter and the elevation accuracy of the points in well-defined surfaces is 15 cm; the horizontal accuracy is 60 cm. The point cloud has ground classification produced by the NLS using automatic classification and verification with stereo imagery. The data is collected yearly in three time
windows: in spring with both leaf-off and leaf-on situation and in mid-summer with leaf-on.
The NLS orthophotos are available through the web service. Photogrammetric flights are carried out at spring time and approximately one fourth of the land area is covered annually. Images are collected using digital cameras and red, green, blue and near-infra-red bands are available. GSD of orthophotos is 0.5 m and the estimated geometric accuracy is 1 m.
In this investigation we are also interested in usefulness of the original airborne images collected with stereoscopic overlaps. Since 2008, NLS has been collecting photogrammetric data using digital large-format cameras with a 0.5 m GSD (mostly) and with and red, green, blue and near-infra-red bands. The film images are available since 1940’s. Film images are mostly relatively accurate orientation information are available, while for older data sets apriori orientation information is of very low quality. GSD of scanned film imagery is 0.2-0.5 m.
2.3 Stereo-Photogrammetric data processing
Recently, remarkable t progress has taken place in the image processing technologies. The most fundamental technological breakthroughs include the structure from motion technologies for image ordering and object reconstruction (Hartley and Zisserman, 204) as well as novel matching technologies for 3D object reconstruction (Leberl et al., 2010).
For photogrammeric data, the first step is the determination of interior and exterior orientations. At the FGI, the processing is typically carried out using the Bae Systems Socet Set commercial photogrammetric workstation (DeVenecia et al., 2007, Honkavaara et al., 2013). The Socet Set software offers efficient tools for rigorous processing of photogrammetric data and for quality assessment, which leads to highly controlled and accurate output products. As an alternative approach, we have implemented a processing line based on the visual structure from motion (VisualSFM) software, which is a powerful tool for determining orientations of images with no apriori orientation information and even without information about the camera (Wu et a., 2011; 2013). First, the VisualSFM software is used to reconstruct the image block and object in its internal coordinate system. Then, the orientations are transformed to desired object coordinate system by using a set of ground control points (GCPs) that were obtained from the national laser scanning data and the orthophoto. Currently, the quality of the VisualSFM output is assessed only visually, so in most cases the orientations are further improved by the Socet Set software.
From the photogrammetric images, 3D point clouds are extracted using state-of-the-art terrain extraction software. At the FGI process two methods are used. The Next Generation Terrain Extraction (NGATE) algorithm is a module in the Socet Set workstation (DeVenecia et al., 2007). The Photogrammetric Surface Reconstruction from Imagery (SURE) software is based on semi-global matching and it is capable of providing a point density corresponding to the pixel size of the image (Rothermel et al., 2012; Wenzel et al., 2012).
2.4 3D WebGL Visualization (WebGL + three.js)
One of the main drivers in the growing popularity of Web browser-based map applications has been the development of the Google Maps application in the mid 2000s, consisting of a JavaScript-based user interface and a service API and a rich set of spatial content. At the same time the open source community was activated and several dynamic map applications and libraries were developed. The most used of these are currently the libraries OpenLayers and Leaflet.
Web Graphics Library (WebGL) is one of the most important new technologies facilitating 3D visualization on the browser platform (as an example, see Wüest 2012). WebGL is a quite complicated. Several higher level libraries have been developed to help the application developer in this task. One of these is the Three.js library. Three.js is a JavaScript library that makes the use of WebGL easier by offering to the developer a set of high level graphic objects and concepts that simplify the creation of 3D scenes. Three.js renders into HTML5 canvas element using either Scalable Vector Graphics (SVG) or WebGL. There is also a plug-in available for the popular QGIS application to create Three.js exports (QGIS Plug-ins, 2014).
The case implementation’s application environment consists of an OpenLayers-based client interface for defining the target area of the process, a MapServer-provided WCS interface for accessing the surface models, a GeoServer-based server application with a custom-built Java WPS process and a PostgreSQL/PostGIS database. Various external OGC-compliant content access interfaces are utilized for retrieving the data sets needed (for a similar approach, see Rocatello et al. 2013). The final results of the process are presented as a 3D model in the Web browser making use of WebGL and Three.js libraries. All of the software components used in the case study are available as open source tools.
2.5 Overview of case studies
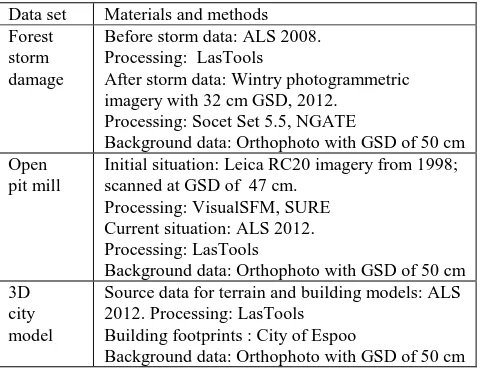
The proposed concept was demonstrated in three environmental applications that were based on user driven 3D visualization: assessment of storm damages in forest, assessment of volumetric changes in open pit mine and 3D city model visualization. The major analysis was performed using the storm damage data; two other examples were considered to cover a wide variety of environmental applications and data sets. An overview of data sets and processing methods is presented in Table 1. The case studies are presented in more details in Section 3.
Data set Materials and methods Forest
storm damage
Before storm data: ALS 2008. Processing: LasTools
After storm data: Wintry photogrammetric imagery with 32 cm GSD, 2012.
Processing: Socet Set 5.5, NGATE
Background data: Orthophoto with GSD of 50 cm Open
pit mill
Initial situation: Leica RC20 imagery from 1998; scanned at GSD of 47 cm.
Processing: VisualSFM, SURE Current situation: ALS 2012. Processing: LasTools
Background data: Orthophoto with GSD of 50 cm 3D
city model
Source data for terrain and building models: ALS 2012. Processing: LasTools
Building footprints : City of Espoo
Background data: Orthophoto with GSD of 50 cm Table 1. Materials and methods used in the case studies.
3. CASE STUDIES: RESULTS AND DISCUSSION
3.1 Storm damages in forests
Winter storms caused serious windfall in forests in Southern Finland on 26 and 27 December 2011. In order to assess the damages, airborne photogrammetric image flights were carried out on 8 January 2012 right after the first snow had fallen. Data were collected using a Microsoft UltraCamXp large-format mapping camera. The average flying height was 5370 m above ground level, which yielded a GSD of 32 cm. The image block was with16 image strips and approximately 30 images per strip; the forward overlaps were 65% and the side overlaps were 30%; the distances of the image strips were approximately 3900 m. The atmosphere was clear and the solar elevation was only 5-7°. Total area covered during one day flight was 1620 km2. The orthophotos were available in the NLS web map service within about two weeks after the data collection.
Further processing was carried out at the FGI because the 3D surface models were not offered by the NLS. A sub-block with five image strips was selected for the demonstration purposes. The photogrammetric process was carried out using the Socet Set photogrammetric software. For georeferencing, 26 GCPs were taken from the ALS point cloud and the ALS intensity image. Automatic tie points were then extracted and the orientations were determined using a bundle block adjustment. The registration quality of the ALS and photogrammetric data was estimated to be approximately 1 m. SOCET SET Next Generation Automatic Terrain Extraction software (NGATE) (DeVenecia et al 2007) was used to generate dense DSM with a point interval of 1 m. The data processing was highly automated and accurate. Details of the processing are given by Honkavaara et al.(2013).
The ALS data used in this study was collected in 2008 during the spring. LasTools software (Isenburg 2014) was used to merge the map sheets of NLS laser data that covered the area and to make a DSM of the point cloud with 1 m grid spacing. The first and only pulses were used for DSM.
In this case study, the forest damages caused by a storm are investigated. This is done by computing height differences between ALS data collected before storm and photogrammetric imagery collected after the storm. The process is fully based on service-oriented computing environment. The source data sets The International Archives of the Photogrammetry, Remote Sensing and Spatial Information Sciences, Volume XL-3, 2014
are retrieved from content services making use of standardized access interfaces, the computations needed for the analysis are performed by a service side component accessible through a WPS interface, and the results are presented in a Web browser utilizing the new 3D visualization libraries.
The client user interface contains for instance an orthoimage layer and a cadastral parcel layer as application’s background map layers. The orthoimage layer is retrieved through the WMS interface and the cadastral parcel layer through the WFS interface from a service provided by the national mapping agency. The user can select a specific cadastral parcel from the map and execute the analysis process for that area in order to retrieve the storm-inflicted forest damages.
The analysis is performed by sending the selected cadastral parcel’s polygon and a metric filtering parameter to the analysis process through the WPS interface. The Java-based WPS process is hosted in the GeoServer application, and it performs the height difference computation between the two surface models for the selected area. The height difference between the surfaces is computed using various PostGIS operations and the results of the calculation are returned in a GeoJSON form that is visualized in the client application.
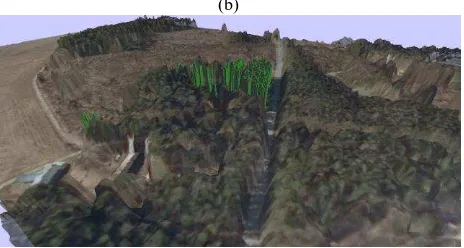
In the result file, the differences in the two surface models that have occurred in the area between the two data capture moments are represented as vertical 3D-bars and are calculated on-demand from user selected cadastral parcel (Figure 1a). The identified damages (here simply the greater than 15 m losses in height) are visualized together with the original surface models and the ortophoto as the texture in a 3D view of the area, thus providing a powerful tool for exploring the effects of the storm (Figure 1b). The surface models that are used as background images in the 3D-visualization are requested from the MapServer’s WCS interface in the binary ENVI format, (comparable with the approach in Pedersen 2014).
The application efficiently visualized the changes in tree heights. The decision on whether the changes were real and significant or not is one of the major remaining uncertainties. In some cases comparison of before and after storm imagery verified the damages, in particular, if the fallen trees still lied on ground. The preliminary assessment indicated that it was possible to visually recognize areas with significant amount of fallen trees, so the tool could be used by an individual forest owner to recognize these areas and go for further management operations. Also some further analysed interpretation results, for example as presented by Honkavaara et al. (2013), could be utilized to provide information of significant damage areas and to filter out insignificant changes.
(a)
(b)
Figure 2. Visualization of storm damages. a) The storm damage analysis can be performed on-demand for user selected cadastral parcel. b) Fallen trees are visualized in the 3D-model as green vertical columns, together with the DTM and the surface model representing the situation after the storm.
3.2 Siilinjärvi open pit mine
Aerial frame images from the Siilinjärvi mining area were captured in spring 1998 using the Leica RC20 camera. The film frames were scanned by the NLS. The mean flying altitude was 4700 meters above the sea level and the resulting ground sampling distance (GSD) was about 47 cm. The image block included 3 strips and 12 images.
The Visual structure from motion (VisualSFM) software package was used to determine the image orientations (Wu et a., 2011; 2013). First, the software was used to reconstruct the image block of images with unknown exterior orientations. Then, the orientation parameters were transformed to desired object coordinate system by using a set GCPs that were obtained from the ALS data and the orthophoto. We created 3D point clouds of the object’s area using the SURE software. The processing was automatic excluding the manual measurement of GCPs. Visual assessment of the output products indicated that there were not significant deformations in the photogrammetric block and that the terrain extraction was successful.
The ALS data used in this study was collected in 2012 during the spring with leaf-of situation. The LasTools software (Isenburg 2014) was used to merge the map sheets of the NLS laser data that covered the area and to make a digital surface model (DSM) of the point cloud with 1 m grid spacing. The ground classified points were used for the DSM calculation.
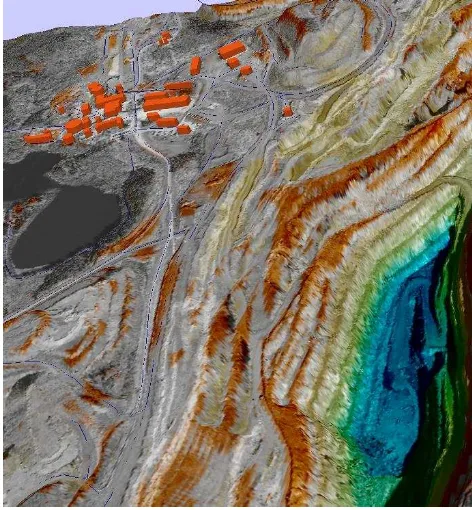
The volume changes between the two time points were calculated based on the DSM rasters created in the earlier steps. The raster calculator feature in QGIS Valmiera 2.2 was used to calculate difference in height for every pixel in the 1 meter grid.
The visualisation process was conducted in QGIS 2.2 with Qgis2threejs plugin (QGIS Plug-ins, 2014) which allows user to automatically create three.js based 3D visualization of vector and raster data draped over a DEM file. The building footprint vectors are visualized as LOD 1 with the roof mean heights calculated from the ALS data.
The differences between the data sets were visualised using false colours and a three.js example is presented in the Figure 3. The visualization shows that there has been loss of volume in the mining area.
Figure 3: Example of visualisation of volume changes in open pit mine area between the years 1998 and 2012. Colors indicate change in volume (red: positive, blue & green: negative). Road network and buildings modelled with LOD1 polygons.
3.3 Espoonlahti city area
A LOD1 level city model for Espoonlahti city area was processed using open data provided by the NLS and the City of Espoo. The basis of the model was NLS ALS data collected in spring of 2012 during leaf-off situation. The LasTools software (Isenburg 2014) was used to merge the map sheets of NLS laser data that covered the area, classify building points and to make a digital elevation model (DEM) of the point cloud with 1 m grid spacing from the ground point class.
The building models were produced using building footprint vectors offered by City of Espoo and calculating mean roof heights of building class ALS points present inside each building polygon. The height information was saved as attribute information for use in visualisation step.
The visualisation process was conducted in QGIS 2.2 with Qgis2threejs plugin (QGIS Plug-ins, 2014) which allows user to automatically create three.js based 3D visualization of vector and raster data draped over a DEM file. The plugin allows simple LOD1 representation of building vectors if mean height of given building is provided.
An example of LOD1 level city model for Espoonlahti urban area is presented in Figure 4. The method leads to a simple model with buildings modelled as prismatic objects with horizontal roofs. The building models, road network graphs and ortho imagery is draped on top of the DEM. Further analysis could include various GIS analyses such as noise level assessments or flood risk assessment in different areas of the city model. Addition of multitemporal data sets would enable analysis of changes in area such as new buildings or changes in vegetation.
Figure 4: Espoonlahti city area visualized with three.js. The result is viewed with standard web browser
3.4 Considerations of data requirements
The results indicated that the integration of open Finnish geospatial data: ALS point clouds,, the photogrammetric point clouds and orthophotos provide possibilities for producing visually rich multitemporal 3D environmental data that can be used in wide variety of environmental analysis tasks. Integration of further information, such as cadastral borders or building footprints, provides enhanced possibilities for 3D model reconstruction and analysis. Using open data and open interfaces, user driven analyses can be carried out completely based on service-oriented computing environment. In comparison to the existing 3D virtual environments such as Google Maps, the major advantage of the approach presented here is that it enables 3D analysis and queries based on the original remote sensing data.
The proposed approach is new and based on experimental web visualisation technology and therefore there remain many further aspects that need to be improved and developed. In this investigation, we emphasized the requirements of the photogrammetric data sets. When the data related questions are solved, the urgent task will be the development of new applications and analysis methods for these new data.
For all the 3D analysis applications, understanding the properties and the quality of the data is crucial. In Finland, the ALS data is of well controlled quality ensured by the comprehensive quality assurance procedures. The photogrammetric point clouds and historical photogrammetric imageries represent new kinds of data sets in these analyses and their standardization is an important task to be carried out. In the following we discuss the special characteristics of the photogrammetric data sets that need further developments. The International Archives of the Photogrammetry, Remote Sensing and Spatial Information Sciences, Volume XL-3, 2014
Desirable photogrammetric products for the visualization process are DSMs (or point clouds) and orthophotos. Typically, the data producer has the best possibilities to produce these data sets. For the users of the data, the management of orientation information of various data sets is a challenge; for example, the fiducial mark measurements on film images or management of the deformations of the modern digital large-format camera images. The modern software such as VisualSFM do not support fiducial measurements or challenging image formats of multihead cameras. Ignoring the rigorous models will deteriorate the output data quality. Both the commercial photogrammetric software (Bae Systems Socet Set) and the open source software (VisualSFM) were used in this investigation; the advanced sensor modelling tools and rigorous quality assessment tools of Socet Set were valuable in the processing and in providing quality information of the products.
Potential quality problems with the surface models based on automatic image matching include the matching failures and the systematic geometric deformations. Our results showed that the performance of the image matching was excellent both with the new digital images and with the scanned aerial images. However, the matching failures are always possible with the imagery. The missing matches will lead to wrong interpretations, so information of the matching quality is required. Especially, it is expected that the new photogrammetric materials collected using sensors with high dynamic range and larger image overlaps will lead to high quality surface models. Properties of the historical film images are not as ideal for image matching, and more problems are expected with these data. With photogrammetry, block deformations are a risk, which will lead to systematically deformed 3D information. These deformations also need to be considered and minimized in the process. It is expected that the integration of photogrammetric data and laser scanning could provide possibilities for compensating and identifying these deformations.
It is known that different data sets will have different properties (see for example Honkavaara et al., 2013). For example, the ALS DSM penetrates to the forest floor while the photogrammetric DSM stays mainly on the top of canopy. The properties of photogrammetric surface models are dependent on the GSD of the images used, the sensor (film or digital camera) and the matching algorithm used. The different characteristics of the data sets have to be characterized and they have to be into account in the final analysis applications.
Accurate registration of the multitemporal data sets is required in order to make reliable interpretations based on the data sets. The registration of photogrammetric and ALS data has been investigated in previous studies (Rönnholm, 2011) but integration of a variety of historical data stets will require further studies.
The huge data volumes are a challenge with the high density point cloud and image data sets. Especially point clouds derived with dense image matching from high resolution imagery may have point densities over 100 points/m2. Most point cloud processing programs have limited ability to view and process such clouds leading to a data processing chain with the point cloud data in small data blocks.
In this investigation we concentrated on data offered by the public authorities. Users could also integrate their own data sets to the analysis process. For example, a forest owner could
follow their forests by collecting imagery using personal unmanned airborne vehicles.
4. CONCLUSIONS
In this article, we have introduced a novel concept to process and analyze Finnish geospatial data sets, and visualised the resulting 3D environmental models in standard web browsers using open WebGL technology. Our results point out that 3D environmental analyses are possible even for individual citizens when using open data sets, open data interfaces and WebGL technology. We believe that open geospatial datasets and their efficient use will result in many new possibilities, for both public and commercial point of view.
One of our central objectives was to consider the utilization of the high detail 3D data sets: national laser scanning data and DSMs or point clouds generated using the photogrammetric images. In Finland, the latter are not currently offered as open data. Our results showed that the photogrammetric data sets can be used parallel to the laser scanning data in the 3D analysis processes. However, our considerations pointed out that there are still several challenges hindering the efficient utilization of the 3D photogrammetric data: the management of wide variety of sensor types, data quality issues: matching failures and systematic block deformations, different characteristics of point cloud data from different sources, registration of various multitemporal data sets, as well as management of huge amounts of data. More research and standardization will be needed to provide accurate and safe use of this data.
ACKNOWLEDGEMENTS
The research carried out in this study was funded by the Finnish Ministry of Agriculture and Forestry (DNro. 350/311/2012) and the Finnish Funding Agency for Innovation (Tekes) (Dnro 515/31/2013). The airborne images in Figures 2-4 are based on National Land Survey open data licence - version 1.0 - 1 May 2012.
http://www.maanmittauslaitos.fi/en/NLS_open_data_licence_ve rsion1_20120501.
REFERENCES
DeVenecia, K., Walker, S., Zhang, B., 2007. New Approaches to Generating and Processing High Resolution Elevation Data with Imagery. In Photogrammetric Week’07; Fritch, D., Ed.; Wichmann Verlag: Heidelberg, Germany, pp. 297–308.
Gröger, G., Plümer, L., 2012. CityGML – Interoperable semantic 3D city models, ISPRS Journal of Photogrammetry and Remote Sensing, Volume 71, July 2012, Pages 12-33, ISSN 0924-2716.
Hartley, R., Zisserman, A., 2003. Multiple View Geometry in Computer Vision. Cambridge University Press. ISBN 0-521-54051-8.
Honkavaara E, Litkey P, Nurminen K., 2013. Automatic Storm Damage Detection in Forests Using High-Altitude Photogrammetric Imagery. Remote Sensing, 5(3).
Isenburg, M., 2014. LAStools—Efficient Tools for LiDAR Processing; Version 140221. Available online: http://lastools.org (10 April 2014).
Kim, H-W., Kim, D-S., Lee, Y-W and Ahn, J-S, 2014. 3-D Geovisualization of satellite images on smart devices by the integration of spatial DBMS, RESTful API and WebGL. Geocarto International. (Published online 31 Mar 2014).
Kolbe, T.H., 2009. Representing and Exchanging 3D City Models with CityGML. In Lee, Zlatanova (eds.): 3D Geo-Information Sciences, Springer, 2009.
Leberl, F.; Irschara, A.; Pock, T.; Meixner, P.; Gruber, M.; Scholz, S.; Wiechert, A. 2010. Point clouds: Lidar versus 3D vision. Photogramm. Eng. Remote Sensing, 76, pp. 1123–1134. Lee, J., and Zlatanova, S., 2008. A 3D data model and
topological analyses for emergency response in urban areas. Geospatial information technology for emergency response 143 (2008): C168.
MacEachren, A. M. and Kraak, M-J., 2001. Research Challenges in Geovisualization. The Journal of the Cartography and Geographic Information Society. Volume 28, Issue 1, 2001. (p. 3-12).
OGC, 2014. Open Geospatial Consortium standards, Available online: http://www.opengeospatial.org/standards/ (11 April 2014).
Pedersen J., 2014. WCS i threejs. Available online: http://labs.kartverket.no/wcs-i-threejs/ (10 April 2014).
QGIS Plug-ins, 2014. QGIS Python Plugins Repository - Plugin: Qgis2threejs, Available online: http://plugins.qgis.org/plugins/Qgis2threejs/ (11 April 2014).
Paikkatietoikkuna, 2014. Open spatial data – Paikkatietoikkuna, Available online: http://www.paikkatietoikkuna.fi/web/en/open-spatial-data (11 April 2014).
Rocatello E., Nozzi A. and M. Rumor, 2013. Design and Development of a Framework Based on OGC Web Services for the Visualization of Three Dimensional Large-Scale Geospatial Data Over the Web. Available online: http://www.int-arch-
photogramm-remote-sens-spatial-inf-sci.net/XL-4-W1/101/2013/isprsarchives-XL-4-W1-101-2013.pdf (10 April 2014).
Rönnholm, P., 2011. Registration Quality-Towards Integration of Laser Scanning and Photogrammetry. Bundesamt für Kartographie und Geodäsie. EuroSDR Official Publications No 59.
Rothermel, M., Wenzel, K., Fritsch, D., Haala, N. (2012). SURE: Photogrammetric Surface Reconstruction from Imagery. Proceedings LC3D Workshop, Berlin ,December 2012.
Wenzel, K., Abdel-Wahab, M., Cefalu, A., and Fritsch, D.: High-Resolution Surface Reconstruction from Imagery for Close Range Cultural Heritage Applications, Int. Arch. Photogramm. Remote Sens. Spatial Inf. Sci., XXXIX-B5, 133-138.
Wüest, R., Eugster, H., Nebiker S. and M. Christen, 2012. Processing and Rendering Massive 3D Geospatial
Environments using WebGL –The examples of OpenWebGlobe and SmartMobileMapping, In proceeding of: The Graphical Web 2012, At Zürich, Switzerland Available online: http://www.researchgate.net/publication/256456527_Processing _and_Rendering_Massive_3D_Geospatial_Environments_using _WebGL/file/72e7e52e186cb92842.pdf (10 April 2014).
Wu, C., Agarwal, S., Curless, B., Seitz, S.M., 2011: Multicore Bundle Adjustment. IEEE Conference on Computer Vision and Pattern Recognition (CVPR), 3057 - 3064.
Wu, C., 2013: Towards Linear-time Incremental Structure from Motion. International Conference in 3D Vision (3DV), June 29-July 1 2013, Seattle, USA, 127-134.
Zlatanova, S., and Beetz, J. (2012). 3D spatial information infrastructure: The case of Port Rotterdam. In Usage, Usability, and Utility of 3D City Models–European COST Action TU0801 (p. 03010). EDP Sciences.
Revised July 27, 2014
![BADAN LINGKUNGAN HIDUP PROVINSI SULAWESI BARAT [Paket Penyedia].](data:image/gif;base64,R0lGODlhAQABAIAAAP///wAAACH5BAEAAAAALAAAAAABAAEAAAICRAEAOw==)