HELIOS: A MULTI-PURPOSE LIDAR SIMULATION FRAMEWORK FOR RESEARCH,
PLANNING AND TRAINING OF LASER SCANNING OPERATIONS WITH AIRBORNE,
GROUND-BASED MOBILE AND STATIONARY PLATFORMS
S. Bechtolda, B. H¨oflea∗
a
Institute of Geography, GIScience, LiDAR Research Group (LRG), Heidelberg University, Heidelberg, Germany - [email protected], [email protected]
Commission III, WG III/2
KEY WORDS:HELIOS, Laser Scanning, LiDAR, Simulation, Survey Planning, Virtual Reality, Java, XML
ABSTRACT:
In many technical domains of modern society, there is a growing demand for fast, precise and automatic acquisition of digital 3D models of a wide variety of physical objects and environments. Laser scanning is a popular and widely used technology to cover this demand, but it is also expensive and complex to use to its full potential. However, there might exist scenarios where the operation of areallaser scanner could be replaced by acomputer simulation, in order to save time and costs. This includes scenarios like teaching and training of laser scanning, development of new scanner hardware and scanning methods, or generation of artificial scan data sets to support the development of point cloud processing and analysis algorithms. To test the feasibility of this idea, we have developed a highly flexible laser scanning simulation framework namedHeidelberg LiDAR Operations Simulator (HELIOS). HELIOS is implemented as a Java library and split up into a core component and multiple extension modules. Extensible Markup Language (XML) is used to define scanner, platform and scene models and to configure the behaviour of modules. Modules were developed and implemented for (1) loading of simulation assets and configuration (i.e. 3D scene models, scanner definitions, survey descriptions etc.), (2) playback of XML survey descriptions, (3) TLS survey planning (i.e. automatic computation of recommended scanning positions) and (4) interactive real-time 3D visualization of simulated surveys. As a proof of concept, we show the results of two experiments: First, a survey planning test in a scene that was specifically created to evaluate the quality of the survey planning algorithm. Second, a simulated TLS scan of a crop field in a precision farming scenario. The results show that HELIOS fulfills its design goals.
1. INTRODUCTION
Laser scanning is a widely used method of acquiring high-detail, high-precision 3D models of physical objects in many technical fields of modern society like construction, mining, farming and forestry, or science. The technology is advancing quickly, and increasingly capable laser scanners are introduced every year. A remaining problem is that laser scanners are still very expensive, and it is unlikely that they will become significantly more afford-able in the foreseeafford-able future. However, there are use cases where it might be possible to replace the operation of areallaser scan-ner with acomputer simulation, resulting in a massive reduction of costs and effort. If the focus of interest in a laser scanning operation is on the acquisition of some very specificreal-world data, it can never be replaced by a simulation. However, there are many questions in laser scanning research for which the an-swers lie not in the actualcontentof the captured data, but in its structural characteristics, and these can very well be reproduced in a simulated environment. Possible use cases for a laser scan-ning simulator are, e.g., research and planscan-ning of scanscan-ning strate-gies, laser scanning teaching and training, generation of artificial scan data for algorithm development, or sensor development and evaluation. More detailed thoughts on the usefulness of a laser scanning simulator were presented by Lohani and Mishra (2007).
2. RELATED WORK
The general idea to simulate laser scanning is not new. A signif-icant increase in publications on the topic can be observed since around 2005. Most publications focus on methods and algorithms
∗Corresponding author
to achieve high simulation realism for one very specific aspect of the light detection and ranging (LiDAR) technology, or for very specific applications like forestry (e.g. Lovell et al. (2005)). The following paragraphs provide an overview of some selected pub-lications with an emphasis on their unique characteristics.
Lohani and Mishra (2007) have developed an airborne laser scan-ning (ALS) simulator for education and general research. The ap-plication features a user-friendly graphical user interface (GUI) which includes a scene generator/editor and a graphical flight path planner, turning the software into a complete ready-to-use ALS simulation suite. However, the LiDAR simulation method described by Lohani and Mishra (2007) works with “2.5D” ele-vation maps only. Overhanging geometry is not supported, the scene is meant to be scanned exclusively from above. Therefore, the presented approach cannot be used to simulate terrestrial laser scanning (TLS) with realistic high-detail scenes.
A critical aspect of TLS simulation is the support of scene data structures that allow detailed representation of objects with com-plex geometry (e.g. vegetation), suited for realistic simulation of LiDAR measurements from close distances and from any di-rection (as opposed to 2.5D elevation maps, which only allow meaningful measurements from above). A project that takes this into account is presented by Kim et al. (2009). In contrast to the system described by Lohani and Mishra (2007), they use true 3D geometry to describe the scanned scene. This approach may make their software potentially usable for meaningful TLS simu-lation as well. However, this is not discussed in the paper.
tree, represented by a triangle mesh. The purpose of their imple-mentation is the investigation of the effects of different scanning positions (distance between tree and scanner, and elevation of the scanner above ground) on the derivation of plant characteristics likeleaf area indexfrom the generated point cloud. The publi-cation does not mention to which extent their software could be used for other purposes, or how easily it could be modified and extended.
An important aspect to point out here is that none of the solutions mentioned above simulatebeam divergence- the fact that a laser beam is not an infinitely thin line, but a cone of light which in-tersects with surfaces in an elliptical area, called the laser’s foot-print. This has a number of implications on how the light is re-flected by surfaces and detected by the LiDAR sensor. Modern laser scanners take these effects into account and measure the so-calledfull waveformof a reflected laser pulse. In contrast to the single point coordinates which are returned by less sophisticated scanner models, the full waveform contains valuable additional information which can be used by LiDAR researchers to learn more about the nature of the scanned objects. For example, this is especially useful for LiDAR-based studies of vegetation, due to the complex geometry of plants (e.g. Hollaus et al. (2009), H¨ofle et al. (2012)).
Kukko and Hyypp¨a (2009) have developed a laser scanning sim-ulator which is capable of modeling beam divergence and full-waveform signal recording. Generally, their model of the physics involved in LiDAR measurements is very detailed, resulting in a high level of simulation realism. However, just like the solu-tion presented by Lohani and Mishra (2007), their simulator uses 2.5D elevation maps to represent scene geometry, so that it can only be used for ALS simulation.
A TLS simulation that includes modeling of beam divergence and full-waveform signal detected is described by Hodge (2010). Un-usual for a TLS simulation, this implementation uses 2.5D eleva-tion maps, which is explained by the fact that it was specifically designed to analyze errors in high-resolution TLS scanning of un-even surfaces (e.g. pebble-covered ground) from close distances (ca. 3 m). The system is designed to work with scene models at scales below ca. 1x1 m and a single scanning position. Scanner platform movement is not supported. However, the implemen-tation models radiometric as well as geometric aspects of high-resolution, small-distance laser scanning with high realism.
3. OUR APPROACH
Laser scanning is a highly versatile technology with many differ-ent fields of application, and several differdiffer-ent modes of operation (e.g. airborne, stationary terrestrial, mobile terrestrial, and even naval). Accordingly, there are just as many possible applications for a laser scanning simulator. A study of existing literature has shown that most previous research projects on laser scanning sim-ulation were focusing on highly detailed modeling of small parts of this wide field, like one specific mode of operation (e.g. ALS), or one specific aspect of the complex physics of LiDAR measure-ments.
We decided to follow an opposite approach and started to de-velop a flexible multi-purpose simulation framework which could support many different types of laser scanning research projects. More specifically, the system is designed to have the following characteristics:
• Support for many different types of environments (scan tar-gets), scanners, platforms and survey methods, ground-based as well as airborne, stationary as well as mobile.
• Especially,support for scenes with true 3D geometry(as op-posed to “2.5D”). This is an essential requirement for real-istic TLS simulation.
• A “data-driven” simulation engine: As many aspects as possible should be stored in configuration files, so that they can be changed easily.
• Support for easy modification and extension, to provide a solid foundation for many different aspects of laser scanning research and allow “rapid prototyping” of new features and experiments.
• Based on free, open-source and platform-independent soft-ware, to enable and encourage a large group of potential users to try and possibly modify and extend the program to meet their requirements.
We created a modular and highly configurable laser scanning sim-ulation framework called HELIOS, that incorporates all of these ideas. As already mentioned, its development follows a“breadth first”strategy: We decided to focus onsimpleimplementations of manyaspects first, instead of starting withcomplex implementa-tions offewaspects. This leads to the situation that some features are not yet developed as far as one might expect of a mature, full-featured LiDAR simulator, while others are new and unique - especially combined in a single software package. Also, some features are already stable and well-tested, while others still have an experimental character.
3.1 Software Architecture
HELIOS is written in the Java programming language, which supports fast development, high runtime performance and very good multi-platform support, so that the software can run out-of-the-box on Windows, Linux and Mac OS operating systems.
The system is designed as a modular library that can be used to develop different types of applications that make use of its laser scanning simulation capabilities. In theory, this includes desktop applications as well as web-based solutions (e.g. through inclu-sion of HELIOS into a Java Web Servlet) and even mobile apps. However, only PC desktop applications have been implemented and tested so far.
The HELIOS library consists of acore packageand a number of modulesthat perform different tasks. The core package contains classes that model the three main components of the simulation: Theplatform(Section 4.), thescene(Section 5.) and thescanner (Section 6.). Each simulation that is run with HELIOS represents a series of interactions between these three components.
Modulesare built on top of the core components and provide ex-tended functionality for different tasks. Currently, there are mod-ules for the following tasks:
• Loading of simulation assets (i.e. scene, platform and scan-ner definitions) from files
• Playback of pre-defined surveys
• Real-time 3D visualization
Applications are developed by including the core and one or more module packages and connecting them in the desired way. Not all modules might be required to implement a specific simulation task, and existing modules could be replaced with others that per-form the same tasks in a different way. The following sections take a closer look at the different modules and components of the system, and describe their current capabilities and how they work together.
4. THE PLATFORM (CORE COMPONENT)
The platform component simulates the platform on which the scanner is mounted. All changes of the scanner’s position and orientation in space are caused and controlled by the platform component. HELIOS implements multiple platform classes that can be used to simulate different types of aircraft and ground ve-hicles, as well as stationary platforms.
An actual implementation of a specific platform consists of two parts: A class which contains the logic to simulate thegeneral platform type (e.g. a wheeled ground vehicle or a helicopter) and a set of parameters that define the specific characteristic of the platform (e.g. mass, maximum speed, position and attitude of the scanner mount, etc.).
Currently, HELIOS implements the following platform classes:
• Four-wheel ground vehicle with one steerable axle
• Helicopter/Multicopter
• Simple linearly interpolated movement along straight lines
• “Dummy” platform without movement code (base class of all other platform classes, can be used to simulate stationary scanners)
The ground vehicle and helicopter classes use simple physical models with parameters like mass, gravitation and engine forces, to approximate the real-world behaviour of these vehicle types. The linear path movement platform simply interpolates the po-sition of the platform on a straight line between two waypoints with constant speed. The “dummy” platform does not contain any movement code at all. It can be used to simulate stationary platforms like tripods.
As already mentioned above, each platform class has various con-figuration parameters that can be adjusted to represent specific platform models. These configuration settings can be loaded into the software using theassets loader module(Section 7.).
It is important to note that the platform component does not con-tain any logic to define trajectories and move along them. Plat-form classes only controlhowa platform moves, but notwhereit moves. In order to actually move a platform through the scene, an additional steering module is required. This role is fulfilled by thesurvey playback module, described in Section 8..
5. THE SCENE (CORE COMPONENT)
Thescene componentrepresents the environment that is scanned by the simulated laser scanner. The scene might also influence the platform’s position and/or movement: Stationary scanning posi-tions as well as the trajectory of a moving scan platform need to be planned with the geometry of the scan target in mind. Also,
slopes and path-blocking features like walls or vegetation would limit the freedom of movement of ground vehicle platforms and very low flying airborne platforms in the real world. However, no collision detection between platform and scene is implemented in the current version.
From a software engineering point of view, the scene component serves two purposes: First, it contains a data structure that holds scene geometry and materials data. In HELIOS, a scene is de-fined by atriangle meshwith each triangle holding a reference to amaterial definitionthat defines the physical properties of the patch of surface that is represented by the triangle. Material prop-erties affect the strength of laser pulse reflections on a surface.
The second purpose of the scene component is to provide meth-ods for fast intersection tests between aray, defined byorigin anddirection3D vectors, and the scene geometry. This type of spatial query is calledray casting. HELIOS uses ray casting to simulate the transmission of a laser pulse from the laser scanner to the scene’s surface (see Section 6.1 for details).
Modern laser scanners operate with up to a million pulses per sec-ond. In order to simulate such devices with optimal speed (ide-ally, in real-time or faster), a fast raycasting algorithm is manda-tory. The ray casting algorithm implemented in HELIOS is based on traversal of a so-called k-dimensional tree (kd-tree), as de-scribed by Bentley (1975). A kd-tree is a binary tree data struc-ture that recursively splits the Euclidean 3D space of the scene into smaller sections until each section contains only a small num-ber of geometric primitives (typically something between one and up to a few dozen). During the subdivision process, the positions of the split planes as well as the parent-child-relationships be-tween a split section as a whole and the two smaller regions cre-ated by the split are stored in memory. This information can then be used to implement very efficient spatial search algorithms, in-cluding ray casting. A description of how exactly HELIOS uses ray casting to simulate laser pulses is given in Section 6..
6. THE SCANNER (CORE COMPONENT)
Thescanner componentsimulates the actual laser scanner. This responsibility consists of three tasks: Simulation of thebeam de-flection unit, simulation of thefiring of laser pulses, anddetection and processing of their reflections. The interaction of laser pulses with scene surfaces is modeled in the scene component, instead.
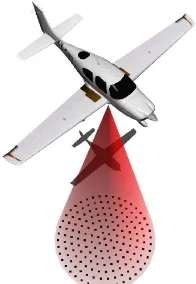
The beam deflection unit is the part of the laser scanner that con-trols the pattern of angular movement in which the laser beam scans the environment. HELIOS implements different types of beam deflection units and scan patterns (Fig. 1):
• Rotating mirror (parallel scan lines)
• Fiber array (parallel scan lines)
• Oscillating mirror (“zig-zag” scan pattern)
• Conic mirror (elliptical scan pattern, a.k.a. “Palmer scan”)
6.1 Beam Divergence and Full-Waveform Recording
Figure 1: Different scan patterns supported by HELIOS: (a) rotat-ing mirror, (b) fiber array, (c) oscillatrotat-ing mirror, (d) conic mirror. Aircraft 3D model: CC-BY-SA Emmanuel Baranger
and thus, indirectly, the number of subsampling rays and their density.
For each subsampling ray, a raycasting query is performed on the scene’s geometry. If the ray intersects with a primitive, the sur-face incidence angle and a reference to the material definition of the intersected primitive is returned. This information is used to simulate the interaction of the transmitted waveform with the sur-face and to compute a reflection waveform for each subsampling ray, taking into account the following additional parameters: en-ergy of the emitted pulse, distance from the emitter, distance from the center of the beam, scanner efficiency, atmospheric attenua-tion and the BRDF surface reflectance model.
The final recorded full waveform of the entire pulse is created by discretizing and summing up the individual waveforms of each subsampling ray. The temporal resolution of the waveform can be configured by the user. Currently, we are running most of our tests with 500 discretization “bins”, which means that each recorded waveform is represented as an array of 500 amplitude values.
Point cloud coordinates are derived by applying echo detection algorithms (Mallet and Bretar (2009)). So far, peak detection and Gaussian decomposition are implemented and can be selected by the user. The point coordinates and the full waveform data for each pulse are then written to separate files. Each point is stored together with a reference to the full waveform data from which it is derived.
7. THE ASSETS LOADER MODULE
Before a simulation can be run, data sets that define a scanner, a platform and a scene - so-calledsimulation assets- need to be loaded. Theoretically, these data sets can come from different sources: It could be entered by the user at runtime, it could be generated procedurally (e.g. a random elevation map), or it could be loaded from files that hold the data in one of many possible formats. Due to this variety, no functionality to load simulation assets data is included in the core. Instead, the required logic is expected to be provided by a module that could be replaced with different implementations, depending on the use case. Currently, HELIOS features an assets loader module that reads asset defini-tions from XML documents and some additional files (e.g. 3D model files that hold scene geometry data).
Figure 2: HELIOS simulates beam divergence using multiple subsampling rays. Each black dot represents one subsampling ray. For visualization purposes, the rays themselves are not shown and the illustration is not to scale. Aircraft 3D model: CC-BY-SA Emmanuel Barranger
7.1 Loading Scene Assets
The XML definition of a scene does not hold actual geometry data. Instead, geometry data is loaded from separate files in tra-ditional 3D data formats. Currently, HELIOS supports loading of scene geometry data from the Wavefront object 3D model data file format (.OBJ), from the Geographic Tagged Image File For-mat (GeoTIFF) raster map data forFor-mat (“2.5D” elevation map), and from “xyz” ASCII point cloud files.
The XML scene description defines how a scene is composed of one or multiple geometry parts that are loaded from different 3D data files, and how the raw data that is read from the files should be preprocessed to build the final scene. Scene part load-ing and preprocessload-ing is performed by a sequence of one or more so-calledfilterswhich are applied to loaded geometry data as de-fined in the scene description. Currently, the following filters are available:
• Wavefront Object Mesh Loader: This loader reads a triangle mesh with associated material definitions from aWavefront object(.OBJ) file. This is the standard way of loading a triangle-mesh-based scene geometry into HELIOS.
• GeoTIFF Loader: This loader reads a terrain elevation map from a GeoTIFF file and converts it into a triangle mesh.
• XYZ Point Cloud Loader: This loader reads an ASCII ”xyz“ point cloud file. The loader subdivides space into a grid of cubic cells (also called ”voxels“) and checks whether a cell contains at least one point of the point cloud. If this is the case, the cell is defined as ”solid“, and an axis-aligned bounding box (AABB) primitive with the extent of the cell is created. The voxel method is a simple way of converting point cloud geometry into a solid volume with a surface that can be virtually scanned.
7.2 Loading Platform and Scanner Assets
Platforms and scanners are defined through XML alone. No ad-ditional resource files are used. However, it is possible to define 3D model files that should be used by the (optional) visualization module to draw the platform and the scanner.
8. THE SURVEY PLAYBACK MODULE
An important part of any laser scanning survey is to make and carry out a plan that defines where the scanner should be placed (or, in the mobile case, along which trajectory the platform should move) and which scanner settings should be used for which part of the survey. Following the modular design principles of the HELIOS architecture, the simulator’s core does not contain any logic to support these things. Instead, HELIOS features a module that provides this functionality. It reads a survey definition from an XML document and performs an automatic ”playback“ of the survey.
The survey playback module can be used to define both surveys with a stationary terrestrial scanner (with one or multiple scan-ning positions) as well as surveys with a moving scanner on a mobile or airborne platform. A survey definition can consist of multiple scans. For each scan, the used platform, scanner and, in the case of mobile/airborne surveys, a sequence of waypoints that describe the platform’s path of movement during the scan, can be defined.
9. THE VISUALIZATION MODULE
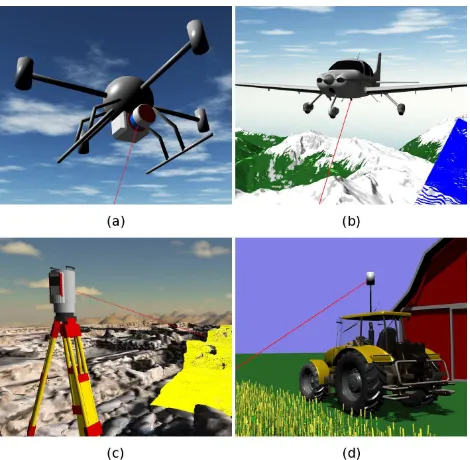
The visualization module provides interactive real-time 3D visu-alization of a running simulation. It is based on the JMonkey En-gine (JME) library. JME contains functionality like 3D graphics output, user input, physics simulation and networking for com-puter games and simulations. Currently, the visualization module allows only limited interaction: The user can move the camera (i.e. the position and direction of the 3D view) around the scene and control simulation speed. However, even with only these fea-tures, the visualization module is a very useful tool. For example, it can be used to check if a survey playback definition is set up and working correctly, to find programming errors in the simu-lation code, or to create still images and videos of a simulated survey. Figure 3 shows four different simulated surveys rendered with the visualization module.
10. THE SURVEY PLANNING MODULE
In TLS surveys, there is an interest in keeping the number of in-dividual scanning positions as low as possible, since each addi-tional scanning position adds to negative effects like
• an additional amount of time required to transport the scan-ner to the position, deploy, operate and undeploy it.
• an additional amount of electrical energy required for scan-ner operations. This is especially critical in situations where no spare batteries or recharging opportunities are available.
• increased redundancy in the produced scan data, leading to an unnecessary increase in file sizes and processing time.
• additional risk of scanner damage (e.g. accidental drop-ping), or even risk of injury for scanner operators in dan-gerous terrain.
Figure 3: Surveys with different types of scanner and platforms, rendered by the visualization module: (a) quadrocopter, (b) fixed-wing aircraft, (c) tripod, (d) tractor. Aircraft 3D model: CC-BY-SA Emmanuel Barranger. Tractor 3D model: tf3dm.com (free for personal use)
However, if the number of scanning positions istoo low, parts of the scene may not be captured in the desired resolution, or not at all, leaving “holes” in the data set. Survey planners are chal-lenged to choose scanning positions in such a way that the desired coverage and resolution is achieved, while keeping the total num-ber of scans as low as possible. Especially in environments with very complex geometry, this is not an easy task even for experi-enced TLS operators.
HELIOS contains an experimental module that provides an ap-proximative solution to the problem of finding the recommended scanning positions (RSPs) for a given scene, based on checking the lines of sight between potential scanning positions (PSPs) and so-calledvisibility test points (VTPs). A PSP is a place where the scannercouldbe positioned and operated as part of the sur-vey. The goal of the algorithm is to find out whether or not it is really efficient to put the scanner there. A VTP is a point on the surface of the scene, representing the surrounding surface area to half the distance to the next VTP. By checking the lines of sight between a PSP and each VTP in the scene, an approximation of the PSP’s so-calledviewshed- the part of the scene that is visible from the PSP - is computed. With knowledge about each PSP’s viewshed, decisions can be made about which PSPs should in-deed be used in the survey in order to achieve optimal scene cov-erage, and which PSPs can be dismissed because they would only produce redundant data. The complete algorithm consists of four steps:
1. Define a set of PSPs.
2. Define a set of VTPs.
3. Compute the viewshed of each PSP.
10.1 Setting up Potential Scanning Positions (PSPs)
The first observation that should be made when defining PSPs is that the scanner will usually only be placed on horizontal surfaces with little or no slope. It will rarely be positioned on steep slopes, and most probably never on vertical walls.
In order to find PSPs on horizontal surfaces, the survey planning module uses the HELIOS framework’s raycasting functionality. In a regular grid over the scene area, with x/y step sizes that can be configured by the user, rays are cast vertically “down from the sky”, and the first point where the ray intersects with scene geom-etry (i.e. the highest surface point at the given (x/y) coordinate) is added to the list of PSPs. Pointing straight down, the rays will never hit vertical surfaces (since they run parallel to them), so no points on vertical surfaces will ever be selected. However, the rays will hit slopes. The slope angle at the intersection point is checked, and the point is discarded if the slope exceeds a thresh-old that can be defined in the XML configuration.
10.2 Setting up Visibility Test Points (VTPs)
The set of VTPs is built with the same basic approach as the set of PSPs. Again, raycasting is used to find surface points, but with two major differences:
• Rays are not only cast down vertically from the top, but also horizontally from all four sides of the scene, since (in con-trast to PSPs) vertical walls need to be covered with VTPs, too.
• Instead of only selecting the first intersection between a ray and the scene, this timeallray-scene intersections are se-lected as VTPs, since the entire surface of the scene should be covered.
In most cases, this method of placing VTPs will not result in a regular pattern of evenly distributed VTPs, since most surfaces in the scene are usually not axis-aligned. Especially the complex shapes of natural objects like plants or rocks will produce very irregular VTP distribution patterns. This does not pose a problem as long as the maximum distance between VTPs is small enough to cover the scene with sufficient density.
10.3 Computing PSP Viewsheds
Computing the viewshed of a PSP means to check the lines of sight between the PSP and each VTP in the scene. Again, the scene raycasting functionality of the HELIOS core is used: A PSP is defined as the ray’s origin, and its direction is defined as the difference vector between the PSP and the VTP. Then, the raycasting query is performed and the algorithm checks where the ray intersects with the scene. If the distance between the first intersection point and the VTP is larger than a predefined thresh-old (0.05 m by default, configurable by the user through XML), no line of sight exists, and the tested VTP is not part of the PSP’s viewshed.
10.4 Finding Recommended Scanning Positions (RSPs)
The crucial measure for deciding whether or not a PSP is recom-mended isthe number of VTPs that are exclusively visible from this position. In HELIOS terminology, this is called the exclusiv-ityof the PSP. The basic idea of the algorithm, to find a set of RSPs, is to remove all PSPs withexclusivity= 0, which means
that they are fully redundant. It is important to note here that
the removal of such a PSP will usuallychange the exclusivityof some of the remaining PSPs: If a remaining PSP shares at least one of its visible VTPs with the removed PSP, but with no others, the removal will increase this PSP’s exclusivity by the number of shared VTPs. Because of this, the order in which redundant PSPs are removed matters.
One straightforward approach is to remove redundant PSPs in as-cending order of their viewshed size (i.e. remove the PSP with the smallest viewshed first). The thought behind this is that PSPs with large viewsheds are generally preferable: Since the goal of the overall algorithm is to minimize the number of required scans, the remaining PSPs should cover as much of the scene as possi-ble. However, this approach does not always produce the desired result. In some cases, removing the PSPs with the smallest view-sheds causes the redundant coverage of some VTPs to decrease until they become exclusive for another PSP, which then needs to be kept. This can be avoided by removing PSPs in an alternative order that does not create additional exclusivities.
Experiments have shown that using thearithmetic mean of the line-of-sight incidence angles on the scene surfaceas the order criterion instead of the viewshed size produces better results for some scenes. The current implementation of the survey planning algorithm supports both methods. The basic algorithm can be summarized as follows:
1. Build the initial sets of VTPs and PSPs and compute each PSP’s viewshed.
2. For each PSP, determine exclusivity (i.e. identify and count all VTPs which are only visible from the PSP)
3. If at least one PSP withexclusivity = 0exists, remove
the one with the smallest viewshed or mean incidence angle (depending on settings) and continue withstep 2. Other-wise, the algorithm is finished.
The result is a list of scanning positions that each have at least one exclusive VTP in their viewshed. Altogether, they provide the largest possible coverage of the scene with the minimal number of scan positions.
10.5 Excluding Dispensable Scanning Positions
In analogy toinaccessible or unsafePSPs, which need to be ex-cludedbeforethe RSP search algorithm is run, there may also exist dispensableRSPs, which can only be identified afterthe search is finished: They have an exclusivity greater than 0, but the exclusive parts of their viewsheds are so small that the in-crease in coverage which comes with the addition of these scan positions to the survey is not worth the effort of moving and op-erating the scanner there. It should be noted that this is difficult to decide algorithmically, since some areas of the scene may be more important than others, and the definition of “importance” that applies here depends very much on things like the nature of the scene, how the acquired data is going to be used, and the indi-vidual notions of the people who perform the survey and process the data.
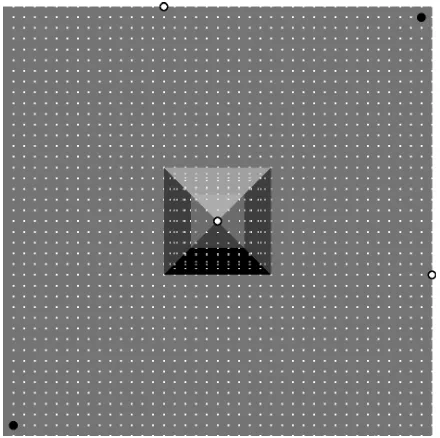
Figure 4: A pyramid scene model used to test the survey planning algorithm.
Figure 5: Two different survey planning results for the pyramid scene. Large white points: RSPs with removal order based on viewshed size. Large black points: RSPs with removal order based on mean line-of-sight incidence angle. The small white dots represent PSPs and VTPs simultaneously, since the same grid was used for the placement of both point types.
many scenarios, this method removes quite a large number of ad-ditional PSPs. Future research has to investigate to which extent these PSPs match with the ones that would also be discarded by a human decision-maker.
11. RESULTS
11.1 Survey Planning Test: Flattened-top Pyramid Scene
Artificial scenes with simple, but deliberately designed geometry are helpful tools to verify the correctness of the simulator. One such scene was constructed to test the behaviour of the TLS sur-vey planning module in a special situation where multiple PSPs together cover the (larger) viewshed of another single PSP, and also additional regionsexclusively. If this was not the case (i.e. if the single PSP with the large viewshed would cover the view-sheds of the other PSPscompletely), the other PSPs could be re-moved. However, since this is not the case, the single PSP with the large viewshed can be removed instead.
One possible scene in which this situation can occur is a hill or pyramid with slopes that are steep at the base, but get flatter to-wards the top. Intuitively, one would probably select the top of the structure as a scanning position, since it provides the largest viewshed. It covers the entire scene, except the base of the struc-ture: The line of sight to this region is blocked by the structure itself. In order to capture the base of the structure, additional scan positions around the base of the structure are required. However,
Figure 6: Close-up view of a procedurally generated crop field model.
Figure 7: A procedurally generated crop field point cloud (overview A and close-up B) compared to a real one (overview C and close-up D).
if the combined viewsheds of these additional PSPs cover the en-tire viewshed of the first PSP on the top of the structure, the latter becomes redundant and can be removed.
A scene with respective geometry was created as a triangle mesh (Fig. 4), and the survey planning algorithm was run on it two times with different removal order criteria. In the first test, re-dundant PSPs were removed in ascending order of their viewshed size. In the second test, they were removed in ascending order of the arithmetic mean of their line-of-sight test ray incidence angles (black points). The results are shown in figure 5.
The result of the first test (white points, removal order based on viewshed size) is suboptimal: The two scan positions at the base of the pyramid structure are placed in positions from where they can not cover the entire scene. Furthermore, their viewing an-gle on two of the pyramid’s sides are close to zero. The second test (black points, removal order based on mean line-of-sight in-cidence angle) produced a much better result: Very much like a human survey planner would do, it placed two scan positions in front of opposing corners of the pyramid, and none on the top.
11.2 Example Use Case: Virtual Crop Fields
pro-cessing and analysis algorithms. One major field of laser scan-ning research is the investigation of laser scan data from crop fields of different species (e.g. H¨ofle (2014), H¨ammerle and H¨ofle (2014)). Such data can be used to measure field parameters like plant growth or biomass in precision agriculture scenarios.
In order to show possibilities for the use of HELIOS in this field of research, a “proof of concept” experiment to simulate laser scanning of a virtual crop field was performed. As a first step, a program which can generate 3D triangle mesh models of crop fields was developed. The program produces crop field models in the Wavefront object (.OBJ) file format, based on a number of pa-rameters like distance between plants in a row, distance between plant rows, plant height, number of leaves, and others. Average values for these parameters are entered by the user, and the pro-gram adds random variations to produce more realistic results. A screenshot of a crop field model which was generated this way is shown in figure 6.
In the next step, XML scene, platform and scanner definitions were written for a simulated single-position TLS survey of the field. Finally, the simulation was run in HELIOS. Figure 7 shows the result of the simulated scan (Fig. 7 A and B), and a point cloud from a real crop field scan for comparison (Fig. 7 C and D). The experiment shows that with the help of additional software to create scene models, HELIOS can be used to produce highly customized virtual laser scan data in a fast and easy way. One great advantage of artificial scan data is that its creation can be controlled very precisely, and that all relevant geometric parame-ters are immediately available for comparison with the results of data analysis algorithms (“virtual ground truth”). Further exper-iments have to show to which extent these advantages outweigh the disadvantage of lower realism, compared to performing real scans.
12. CONCLUSIONS
Although it is still in an early stage of development, HELIOS can already be used to support a wide variety of laser scanning re-search projects. The system is designed to integrate all required functionality to evaluate real and imaginary laser scanner hard-ware and scanning methods, to produce artificial laser scan data and to support TLS survey planning through automatic compu-tation of recommended scanning positions. The main innova-tion and greatest strength of HELIOS compared to existing Li-DAR simulator is its flexibility and modularity. The XML-based “data-driven” simulation engine can quickly be adapted to a wide variety of requirements and simulation scenarios. Also, our real-time 3D visualization module is a valuable and (to the best of our knowledge) unique improvement over other LiDAR simulators.
The next step is to develop more sophisticated end-user applica-tions that make use of the simulation capabilities of the HELIOS library. One especially interesting possible use case is a graphi-cal front-end that allows direct interaction with a simulated laser scanner, as opposed to the current state of the software which al-lows only indirect control of the scanner through XML configu-ration files and the survey playback module. Such an application could be a powerful tool for teaching and practice of laser scanner operations.
ACKNOWLEDGEMENTS
We thank Martin H¨ammerle (Heidelberg University, Germany) and Niko Lukaˇc (University of Maribor, Slovenia) for their valu-able contributions to the HELIOS project. We also thank Rainer Hilland for diligent proofreading of this paper.
References
Bentley, J. L., 1975. Multidimensional binary search trees used for associative searching. Communications of the ACM 18(9), pp. 509–517.
H¨ammerle, M. and H¨ofle, B., 2014. Effects of Reduced Ter-restrial LiDAR Point Density on High-Resolution Grain Crop Surface Models in Precision Agriculture. Sensors 14(12), pp. 24212–24230.
Hodge, R. a., 2010. Using simulated Terrestrial Laser Scanning to analyse errors in high-resolution scan data of irregular sur-faces. ISPRS Journal of Photogrammetry and Remote Sensing 65(2), pp. 227–240.
H¨ofle, B., 2014. Radiometric correction of terrestrial LiDAR point cloud data for individual maize plant detection. IEEE Geoscience and Remote Sensing Letters 11(1), pp. 94–98.
H¨ofle, B., Hollaus, M. and Hagenauer, J., 2012. Urban vegeta-tion detecvegeta-tion using radiometrically calibrated small-footprint full-waveform airborne LiDAR data. ISPRS Journal of Pho-togrammetry and Remote Sensing 67(1), pp. 134–147.
Hollaus, M., M¨ucke, W., H¨ofle, B., Dorigo, W., Pfeifer, N., Wag-ner, W., Bauerhansl, C. and RegWag-ner, B., 2009. Tree species classification based on full-waveform airborne laser scanning data. Silvilaser 2009 Proceedings (2008), pp. 54–62.
Kim, S., Min, S., Kim, G., Lee, I. and Jun, C., 2009. Data Sim-ulation of an Airborne LIDAR System. Proceedings of SPIE - The International Society for Optical Engineering 7323(1), pp. 1–10.
Kukko, A. and Hyypp¨a, J., 2009. Small-footprint Laser Scan-ning Simulator for System Validation, Error Assessment, and Algorithm Development. Photogrammetric Engineering and Remote Sensing 75(10), pp. 1177–1189.
Lohani, B. and Mishra, R. K., 2007. Generating lidar data in laboratory: Lidar simulator. In: International Archive of Pho-togrammetry and Remote Sensing XXXVI(3)W52 of Laser Scanning 2007 and SilviLaser 2007, p. 6.
Lovell, J., Jupp, D., Newnham, G., Coops, N. and Culvenor, D., 2005. Simulation study for finding optimal lidar acquisition parameters for forest height retrieval. Forest Ecology and Man-agement 214(1-3), pp. 398–412.
Mallet, C. and Bretar, F., 2009. Full-waveform topographic lidar: State-of-the-art.