HYDROLOGICAL CHARACTERIZATION OF THE USUMACINTA RIVER BASIN
TOWARDS THE PRESERVATION OF ENVIRONMENTAL SERVICES
F-O. Tapia-Silvaa, *, A-I. Contreras-Silvab , E-R. Rosales-Arriagac
a Universidad Autónoma Metropolitana (UAM), Lab. Geomática Aplicada a Recursos Naturales, Dep. de Hidrobiología, San Rafael Atlixco No. 186, Col. Vicentina, Iztapalapa, 09340, México – [email protected]
b Centro de Investigación en Geografía y Geomática (Centrogeo) México D.F. – [email protected] c
Servicio Meteorológico Nacional (SMN) México D.F. – [email protected]
THEME: Water Cycle.
KEY WORDS: SSEB, kriging, Modis, Landsat, SIG integration
ABSTRACT:
The Usumacinta basin is characterized by aboundance of natural and scenic resources. It also houses a vast biodiversity (wich also means invaluable genetic resources). Its river is the longest in Mexico (main channel length of 927 km). Therefore it is one of the most productive regions of the country in terms of ecosystem services (such as habitat for biodiversity, maintenance of wetlands, water flows generation, carbon sequestration, soil retention, etc.) that are directly related to the hydrological functioning. During the last centuries, human activities on the Usumacinta basin have drastically changed its geomorphology and vegetation cover. As a result the hydrological cycle has been greatly modified. Therefore, it is necessary to conduct studies in order to support planning activities and implementation of public policies, as well as, to generate a permanent scientific ecosystem monitoring system.
This paper presents the results of a study focused on estimating the water balance of this frontier basin. Satellite and field data is used. Variables as vegetation cover (generated by classification of Landsat and MODIS), digital terrain model (SRTM), surface temperature (MODIS), potential evaporation, precipitation and runoff measurements were processed. Various techniques of Remote Sensing, geospatial models (as SSEB and the model for definition of surface hydrological connectivity) and spatial analysis (geostatistics and map algebra) were implemented. The results were integrated into the environment of a Geographic Information System. These are estimates of actual evapotranspiration, soil moisture and runoff, among other biophysical parameters. For the lower part of the basin a balance was performed to estimate inputs of water from runoff and precipitation to the large amount of wetlands in the area. Additionally, areas generating runoff and areas in which most of the precipitaion infiltrates were also mapped. The geo-information obtained is requiered for purposes of planning and land management.
1. INTRODUCTION
1.1 What is the problem about hydrological characterizations in the usumacinta basin and why is importantThe Usumacinta basin
Hydrological characterization of a basin is complex because its biotic, abiotic and socioeconomic components are interacting building a complex system (Aguilar & Iza 2009). The integrated management of water resources considering different uses of water, land use and climate is a challenge that society faces and will face in coming decades (Simonovic, 2002). This management faces a complexity and dynamism generated by the fact that it can be defined as a complex adaptive system subject to a continuous process of social learning that defines subjective perceptions of a socially constructed reality (Pahl-Wostl, 2007). In addition to these complexities of natural and social origin, present limitations in collecting hydrological data gives as result areas with poor hydrological characterization. This reduces the opportunities for a successful decision making process for the management of these territories.
During the last centuries, human activities in the Usumacinta basin have drastically changed their geomorphology and vegetation cover. Areas of crops and pastures have been expanded further occupying mangroves, rainforests and forests, along with the constant modifications of riverbeds (Tabasco-Hidrografía, 2011, CEIEG-Chiapas, 2011). Changes in land cover and land use directly influence elements such as local
hydrological cycles, presence of wetlands, biodiversity loss, soil erosion and increased greenhouse gases. In addition, climate changes result in the increase and intensification of natural disasters such as fires, floods, hurricanes and droughts (FAO, 2007). In this sense, the estimation of the water balance is required in contexts such as urban planning, water management and environmental and ecological studies for example the definition of the functional composition of the basin in hydrological therms as well as the effects on its capacity to provide environmental services.
1.2 Water Balance approaches
for catchment with relative uniformity of land use, soil types and rainfall across headwater as compared to simple models.
Therefore that was reason to choose for this research a combined model than uses field measurements and procedures based of the interpretation of satellite images and well as some spatial analysis procedures as distributed empirical rainfall runoff modelling.
1.3 What do we hope to achieve with our research
What we hope to achieve with our results is to generate geo-information to support planning activities and implementation of public policies, as well as, to generate the basis for the construction of a permanent scientific ecosystem monitoring system of the region. The hydrological characterization can help to improve management activities of this basin to maintain it healthy and capable to keep providing fundamental environmental services such as carbon storage, habitat for biodiversity, water flows retention, and scenic capacities, for the region and the country.
It is well known that the formation, persistence, size, and function of wetlands are controlled by hydrologic processes. Its main characteristics are influenced by factors as the movement of water through or within the wetland, water quality, and the degree of natural or human-induced disturbance. Wetlands play a critical role in regulating the movement of water within watersheds as well as in the global water cycle. The wetland soils and vegetation alter water flow velocities and flow paths. An understanding of wetland functions specifically of the underlying chemical, physical, and biological processes supporting these functions facilitates the management and protection of wetlands and their associated basins. The water balance on wetlands gives support to implement a model of flood control, recharge promotion and flow maintenance by wetlands.
2. METHODS
To study the basin it was divided into upper and lower part. This was done not only because the structural and functional differences, but also by the availability of information which is also differentiated for each part as written in the following paragraphs. The results of both parts of the basin were integrated into a GIS in order to perform the operations corresponding to analysis and visualization.
2.1 Water balance of the highest part of the basin
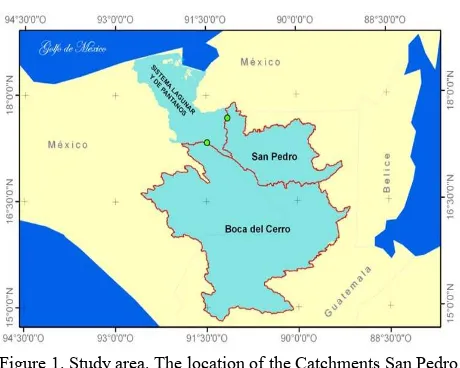
The main idea to perform the balance of the upper part of the basin (composed by the catchment areas San Pedro and Boca del Cerro, see fig. 1) consists of calculating a monthly balance considering distributed rainfall and evapotranspiration values. Precipitation was obtained from a geostatistical interpolation of field measured data. Evapotranspiration was obtained applying SSEB (Senay et al. 2007), a procedure that combines data from satellite images and field measurements. The procedures used are described in more detail below. The distributed determination was aggregated for the two catchments (CA). These CA were defined taking the location of hydrometric stations as its outlet using digital elevation models (SRTM 90 m) according to Jenson & Domingue (1988). To complete the hydrological balance, runoff was obtained from measurements of hydrometric stations indicated with green dots in the figure 1. Assuming constant soil water storage, the only unknown in the
balance is infiltration. Thus, the water balance was performed for approx. 83% of the Usumacinta River basin. 17% of the basin corresponds to the functional low area and the approach used for the other part of the basin could not be performed by the lack of data on runoff gauging stations. However as indicated below, for the lower area determinations based on runoff modeling (which can be viewed with greater uncertainty, but no less useful) were made and emphasized the water balance of wetlands. For the upper part, monthly estimates were made for the years 2008, 2009 and 2010, meaning 36 water balances by each CA. For the lower part, the runnof estimations were done taking precipitation as multi-anual daily average
Figure 1. Study area. The location of the Catchments San Pedro and Boca del Cerro and their hydrometric stations taken as their outlets are shown. The upper part of the basin is builded by both catchments and the lower part by what is named 'Sistema
Lagunar y de Pantanos'
The proposed approach can be considered as one mainly based on field measurements (precipitation, potential evapotranspiration and runoff) and complemented by measurements of remote sensing and spatial analysis. This situation allows to obtain accurate results. This is critical considering the difficulty of obtaining data to validate distributed models in large areas such as the Usumacinta basin.
Estimating actual evapotranspiration with satellite images Medium spatial resolution images from the Terra MODIS sensors to obtain actual evapotranspiration (Etr) were used. For this procedure the SSEB (Senay et al. 2007) was implemented. MODIS surface temperature (LST), vegetation index (NDVI) were downloaded, re-projected to the coordinates system North America Lambert Conformal Conic and re-scaled the image values to valid LST in Celsius values and NDVI values between 0.0 to 1.0. Subsequently 36 accumulated monthly values were generated. PAN evaporation field measurement values were obtained taking the directly measured daily values.
2.2 Water balance of the lower part of the basin
model makes use of spatialized variables of precipitation, land cover and soil properties. This method can be considered a model of balance to pixel level (thus segmenting the territory). The multi-anual average daily precipitation is reduced by initial losses (evaporation and interception). The amount of water absorbed by the soil (infiltration) and the corresponding amount of water draining are estimated. As mentioned previously, this method was used in the absence of hydrological measurements in situ. The implementation of this method was made in open source software GRASS (Geographic Resources Analysis Support System). The results were different maps that show the process of the water balance in the basin, such as amount of rain absorbed by the soil , runoff amount by pixel and flow accumulations weighted by surface runoff. Another obtained map was wetland classification according to the amount of water flowing into them. This last map was generated agregating the results of the hydrological balance per pixel by water bodies using GIS zonal operations.
3. RESULTS AND DISCUSSION
3.1 Main results of the upper part of the basin
The figures 2 and 3 show the values obtained from the water balance for each of the 36 months studied. Variables precipitation (Pp), runoff (Q), actual evapotranspiration (ETr) and infiltration (I) are included. In the case of AC San Pedro, negative values of I are explained because they are time periods where rainfall is low and then the soil provides such water that becomes ETr and Q. It can also be observed the proportional relationship between Pp and I. This indicates that for this AC I is mainly defined by Pp, which is common in predominantly flat areas. As shown, at the end of the rainy season Q increases considerably with respect to their values in the dry season. Meanwhile, ETr increases at the end of the dry season which can be explained as a result of higher energy availability in an area where water is usually available either in waterbodies or soil.
For the other AC (Boca del Cerro) the behavior of the variables is somewhat different. In this case both Q and ETr follow a similar behavior than Pp. That is, rain produces runoff and infiltration rapidly. This is common in regions with steep slopes where surface flow occurs predominantly. Similarly to the other AC, in Boca del Cerro negative values of I are observed mainly during the dry season indicating that soil and other water subsurface contributions constitute water suppliers to both Q and ETr.
Table 1 presents a summary of the water balance by AC for the 36 analyzed monthly periods As shown Pp is divided in Etr 36.4%, Q 60.8%, R 2.7% and ΔW 1%. This last result corresponds to the assumption in the methodology that can it be assumed to be zero.
Figure 2. Monthly Accumulated values (km3) from San Pedro catchment. Precipitation (Pp), actual evapotranspiration (Etr), Runnoff (Q) and ΔI (Pp - [ETr + Q]) difference, of three years of analysis 2008 (months 1 a12), 2009 (months 13 to 24) and
2010 (months 25 to 36)
Figure 3. Monthly Accumulated values (km3) from Boca del Rio catchment. Precipitation (Pp), actual evapotranspiration (Etr), Runnoff (Q) and ΔI (Pp - [ETr + Q]) difference, of three years of analysis 2008 (months 1 a12), 2009 (months 13 to 24)
and 2010 (months 25 to 36)
San Pedro ( km3)
Boca del Cerro ( km3)
( km
3) Percentage
Pp 77.11 280.50 357.61 100%
ETr 32.85 97.48 130.32 36.44%
Q 8.65 209.02 217.67 60.87%
I 35.61 -25.99 9.62 2.69%
ΔW 0.000 3
3.87 3.87 1.08%
Table 1. Summary of the water balance of the 36 monthly periods by AC. summ of 36 months for the two AC, Pp = precipitation, ETr = actual evapotranspiration, Q = runoff and I
= PP (ETr + Q).
evapotranspiration and precipitation can be considered a reliable method. This is justified since measurements of runoff are per se reliable. Also the evapotranspiration determination can be considered reliable because is based on field measurements of potential evapotranspiration and on the SSEB method (Senay et al. 2007). That means that the field measurements are complemented by optical satellite imagery products which in essence are also measurements of the reflectance of the various surfaces. Precipitation is also estimated with reliability since precipitation point measurements are used to perform geostatistic interpolation which is based on the cuantification of spatial autocorrelation by a semivariogram. Thus, these estimates provide valuable information on what happens to the water that is captured by the watershed and how physical and atmospheric phenomena are involved in the structure and functioning of the river basin.
To two periods to analyse the water balance of the upper part can be observed. The first one corresponds to the dry season or low rainfall period. It begins in late October and early November and ends in late March and early April. The second period is the high rainfall or rainy season, which begins in early April and ends in late October and early November. It is observed that in the dry season, infiltration tends to zero by low precipitation, while runoff tends to be higher than precipitation compared to the rainy season. Meanwhile, the evapotranspiration (ETr) tends to increase and exceed the levels of runoff and precipitation. The ETr levels remain almost constant throughout all periods analyzed. This fact leads us to establish that during the dry season the contribution of runoff and evapotranspiration is mainly covered by water stored in the soil, even if it is considered constant in the model.
3.2 Main results of the lower part of the basin
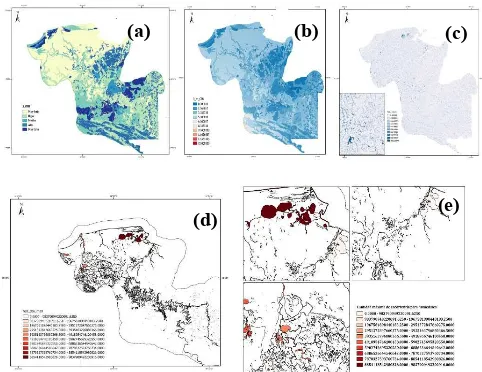
The results obtained for the lower part of the basin are presented in Figure 3. The spatial variables are amount of rain absorbed by the soil ( (a) in the figure, that corresponds to maximum infiltratio), runoff amount by pixel (b), flow accumulations weighted by surface runoff (c) and wetlands classification according to the amount of water flowing into them (d and c).
Amount of rain absorved by the soil is shown in the part (a) in the figure. It corresponds to maximum infiltration and is one of the most important variable in the rainfall runoff process, which essentially refers to the stored water sub- and superficially. This storage is a valuable resource as an essential component of the hydrological cycle, since its main contribution is that wetland ecosystems such as rivers continue to have flow when no rainfall is observed. As shown in the figure, the dark blue color are those with a very high potential in the water storage (average of 10 mm/day). The zones on the next blue indicates areas with a high capacity for storage of water (average of 7 mm/day). The next blue color zones (5 mm/day) are zones with medium storage capacity. Finally zones tending to yellow (values between 0 and 2 mm/dat) indicate a low storage capacity and are places that correspond to wetlands as Catazajá area lagoon system, as they are considered areas with semi or impervious funds. As is well known, the amount of rainfall that infiltrates is defined by the maximum soil infiltration capacity. Land use changes, which are associated with loss of permeability, porosity and organic matter, can lead to a reduction in the infiltration capacity. The part (b) of figure 3 with runoff by pixel shows again in reed color the areas with the
highest values (highest value 15 mm/day). The zones with the lowest runoff generation are shown in blue (lowest value 0 mm/day). The zones with medium value of runoff generation by pixel are shown in colors tending to white. In the part (c) of the figure 3 flow accumulations weighted by runoff are shown. This spatial layer give us an image of the hydrological superficial conectivity in the low part of the basin.
Figure 3. Resulting maps for the lower part of the basin: Amount of rain absorbed by the soil (a) , runoff amount by pixel
(b), flow accumulations weighted by surface runoff (c), wetlands classification according to the amount of water
flowing into them (d and c)
Classification of wetlands fed by runoff
The figure 3 in its parts (d) and (c) also shows flow accumulations weighted by runoff (Q). This is the amount of water flowing in the channels. This process allows that other areas receive water inputs from other areas upstream as a result of surface hydrological connectivity patterns. In fact, much of wetlands are fed with this flows. This is largely causing periods with flooding in wetlands. As shown in the figure, wetlands colored close to red and orange receive the highest amounts of water from runoff during a multiyear daily average rainfall event.
As is well known, the study of wetlands is intrinsically linked to hydrological cycle which is actively involved in the processes taking place in these territories. Wetlands are related to groundwater recharge and discharge and play an important role in system water losses by direct evaporation of the water they contain, as well as an important reservoir of water fed by surface runoff. In order to learn more about certain characteristics of wetlands, which are in increasing human pressure, it is unavoidable to conduct studies (such as this reported research) to characterize their role in the hydrological functioning. The CN method proved satisfactory for the study basin, largely because data are obtained through field surveys by INEGI as vegetation cover and land use and soil type and rainfall.
(a)
(b)
(c)
4. RESULTS AND DISCUSSION
An understanding of the hydrological cycle is essential for effective management of rainwater and soil. In general the methods for estimating the water balance of a basin, involve generating data in storage and flow of water. The analysis can be simplified or made more complex, depending on the data available to conduct such studies. This study provides a series of determinations that attempt to characterize the hydrological functioning in the Usumacinta basin dividing it in their upper and lower parts. For the higher part the proposed approach is based on field measurements of runoff aggregated for two catchment areas and on distributed estimates of evapotranspiration and precipitation. We considered our approach reliable. For the lower part, CN method proved satisfactory for the study basin. This is due mainly to the data availability on land cover and land use and soil type and rainfall (all of them from field measurements). The study findings may help the decission making in the land management process for example wetland classification with higher contributions from runoff or the identification of areas generating infiltration or runoff.
It is important to point out that knowledge about the natural and social conditions that determine the relations between water supply and demand in basins is a fundamental element for their monitoring, efficient management, planning, management in terms of control of threats by flooding and for making successful decisions. This study focuses only on modelling some biophysical variables with the purpose of knowing the natural conditions that occur in the water balance of the basin's study. This type of contributions are basic tools for the planning of the use and care of water resources in the studied territories. It is important to relate (in future research) the obtained data from this study with the social demands and problems associated with the resource water.
REFERENCES
Aguilar, G. & Iza A. 2009. UICN. Serie de Política y derecho Ambiental 63. Gland, Suiza. "La gobernanza del agua en Mesoamérica".
https://portals.iucn.org/library/efiles/documents/EPLP-063.pdf> (15-mayo-2014).
Bradford R.B., Ragab R., Crooks S.M., Bouraoui F., Peters E. 2002. Simplicity versus complexity in modelling groundwater recharge in Chalk catchments. Hydrol Earth Syst Sci 6(5), pp. 927–937
C.Y. Xu & V.P. Singh. 1998. A Review on Monthly Water Balance Models for Water Resources Investigations. Water Resources Management 12 pp. 31–50
CEIEG-Chiapas, 2011, Comité estatal de información estadística y Geográfica de Chiapas "Contexto estatal", internet http://www.ceieg.chiapas.gob.mx/home/?
page_id=28&maccion=28, (02/08/2011)
FAO, 2007. "Cambio climático: ayudar a los más vulnerables," http://www.fao.org/newsroom/es/news/2007/1000724/index.ht ml, (16/08/2011)
Jenson S.K. & O. Domingue. 1988. Extracting Topografic Structure from Digital Elevation Data for Geographic Information System Analysis. Photogrammetric Engineering & Remote Sensing 54(11). pp. 1593-1600
Pahl-Wostl, C., Craps M., Dewulf A., Mostert E., Tabara D., and Taillieu T. 2007. Social learning and water resources management. Ecology and Society. 2(2) 5. Available at: http://www.ecologyandsociety.org/vol12/iss2/art5/
(01/07/2014)
Ruhl JF., Kanivetsky R., Shmagin B. 2002. Water-Resources Investigations Report 02-4092: "Estimates of Recharge to Unconfined Aquifers and Leakage to Confined Aquifers in the Seven-County Metropolitan Area of Minneapolis-St. Paul,
Minnesota". U.S. Geological Survey.
http://mn.water.usgs.gov/publications/pubs/02-4092.pdf (13/11/2009)
SCS. 1985. National engineering handbook. Section 4-Hydrology. Washington, DC.
Senay, G.B., Budde, M., Verdin, J.P., & Melesse, A.M., 2007, A Coupled Remote Sensing and Simplified Surface Energy Balance Approach to Estimate Actual Evapotranspiration from Irrigated Fields. Sensors. 7 pp. 979-1000.
Simonovic, S.P. 2002. World water dynamics: global modeling of water resources. Journal of Environmental Management. 66(3) pp. 249-267.
Tabasco-Hidrografía, 2011, Gobierno del Estado de Tabasco "Hidrografía". http://www.tabasco.gob.mx/estado/geo-hidrografia.php (02/08/2011).
![Figure 3. Monthly Accumulated values (km3) from Boca delRio catchment. Precipitation (Pp), actual evapotranspirationyears of analysis 2008 (months 1 a12), 2009 (months 13 to 24)(Etr), Runnoff (Q) and ΔI (Pp - [ETr + Q]) difference, of threeand 2010 (months 25 to 36)](https://thumb-ap.123doks.com/thumbv2/123dok/3264305.1400331/3.595.328.523.298.421/accumulated-catchment-precipitation-evapotranspirationyears-analysis-runnoff-difference-threeand.webp)