A Low Cost Rokkaku Kite Setup for Aerial Photogrammetric System
A. F. Khan a,b, *, K. Khurshid b, N. Saleh c, A. A. Yousuf d
a Dept. of Electrical Engineering, Institute of Space Technology, Islamabad, 44000, Pakistan – [email protected] b School of Electrical Engineering and Computer Science, National University of Sciences and Technology, Islamabad, 44000,
Pakistan – (11mseeakhan, khawar.khurshid)@seecs.edu.pk
c Dept. of Materials Science and Engineering, Institute of Space Technology, Islamabad, 44000, Pakistan – [email protected] d Department of Electrical Engineering and Information Technology, TU Dortmund University, 44221 Dortmund, Germany–
WG III/1, IV/1
KEY WORDS: Photogrammetry, Remote Sensing, Rokkaku Dako, Kite Aerial Photography, GIS, Genetic Algorithm
ABSTRACT:
Orthogonally Projected Area (OPA) of a geographical feature has primarily been studied utilizing rather time consuming field based sampling techniques. Remote sensing on the contrary provides the ability to acquire large scale data at a snapshot of time and lets the OPA to be calculated conveniently and with reasonable accuracy. Unfortunately satellite based remote sensing provides data at high cost and limited spatial resolution for scientific studies focused at small areas such as micro lakes micro ecosystems, etc. More importantly, recent satellite data may not be readily available for a particular location. This paper describes a low cost photogrammetric system to measure the OPA of a small scale geographic feature such as a plot of land, micro lake or an archaeological site, etc. Fitted with a consumer grade digital imaging system, a Rokkaku kite aerial platform with stable flight characteristics is designed and fabricated for image acquisition. The data processing procedure involves automatic Ground Control Point (GCP) detection, intelligent target area shape determination with minimal human input. A Graphical User Interface (GUI) is built from scratch in MATLAB to allow the user to conveniently process the acquired data, archive and retrieve the results. Extensive on-field experimentation consists of multiple geographic features including flat land surfaces, buildings, undulating rural areas, and an irregular shaped micro lake, etc. Our results show that the proposed system is not only low cost, but provides a framework that is easy and fast to setup while maintaining the required constraints on the accuracy.
* Corresponding author.
1. INTRODUCTION
There is an ever increasing use of aerial photogrammetry for the problems such as calculating the area of a given land, estimating forest growth, study of water reservoirs and regional planning etc. Among such applications, measuring the Orthogonally Projected Area (OPA) of the geographical features on the surface of the earth is of high importance especially to scientists, town planners, and the potential buyers of land. Since OPA constitutes the area as seen from the top using non-stereoscopic camera, therefore the elevation information is discarded.
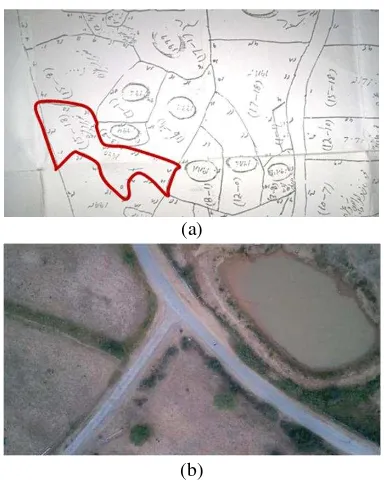
Numerous methods to measure the OPA exist in the literature. Field-based sampling approaches utilizing expensive equipments such as total stations and theodolites offer high accuracy but render the procedure rather lengthy and logistically challenging. Moreover, the number of measurements increases significantly as the perimeter and topography of the land becomes irregular and undulating for example as shown in fig. 1. Another sampling based approach exploits the relatively lower cost GPS based measuring systems (Kelly et al., 1995). Although traditional GPS based systems have somewhat limited accuracy, higher end GPS systems such as the ones using differential GPS technology can be used to calculate OPA with sub meter accuracy. However, this is achieved at the expense of high cost and computationally expensive and complex-to-implement algorithms (Hatch et al., 2003).
(a)
(b)
Figure 1. Two examples that pose a challenge for area determination; (a) highly irregular shaped plotting near the Capital of Pakistan. The markings are done in local language,
Urdu. (Photo courtesy Government of Punjab, Pakistan), (b) Self imaged aerial shot of an irregularly shaped micro lake.
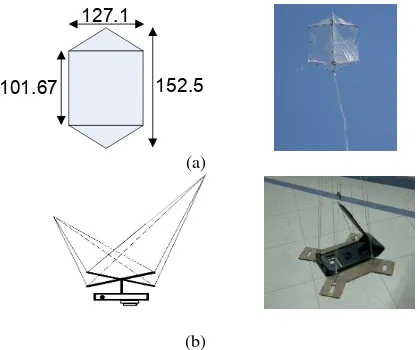
152.5
Figure 2. Image acquisition set up (a) Rokkaku Dako design with all dimensions in centimeters and fabrication (b) Picavet
rig with camera mount design and fabrication.
time. Spatial resolution as high as 0.6 m/pixel for panchromatic imagery is available for $3000 to $5000 (Wang et al., 2010). Free satellite imagery databases such as Google Maps provide free satellite images for public use. A disadvantage associated with these is inconsistent pixel resolution across different regions of the world and poor temporal resolution. For example, the human constructed micro lake shown in fig. 1b did not exist in Google Earth at the time of the paper write up hence mandating the use of technique other than satellite imagery. Another technique is the aerial photogrammetry which is extensively used in surveying, ecological studies, and forestry, etc. It dates back to 1858 when French scientist Laussedat used a kite to test aerial photogrammetry. A few years later in 1862, he employed a balloon platform for the same purpose. Today, aerial photogrammetry is extensively used to measure and study different features of the surface of the earth. Unmanned aerial vehicles are becoming quite popular in aerial photography. Such a set up can provide excellent spatial resolution up to 1cm per pixel (Darren et al., 2014). Although the cost of using these platforms is decreasing with time, the price still remains high. Moreover, the UAVs are susceptible to poor performance in high winds.
Weather Balloon and kites have been utilized for aerial photography since decades. Some applications of these include monitoring archaeological sites (Verhoeven, 2009), coral aerial photography (Scoffin, 1982), humanitarian emergency mapping (Sklaver et al., 2006), mapping intertidal landscapes (Bryson et al., 2013), and an intelligent kite aerial platform (Murray et al., 2013), etc.. While balloons operate well under low wind conditions, the kites are usually flown in windy conditions, thus offering a complimentary use in varying weather. Kite has been chosen as the platform to be utilized in this research work primarily for low cost, easy to design, fabricate and operate under varying conditions of winds. Moreover, it has the capability to carry bulky payloads such as camera rigs. Such a setup is ideal for measuring small scale geographic features with good accuracy while conforming to tight budget constraints. In the literature, kites have been utilized in several applications, some of them are mentioned above. However, such a platform has not been utilized explicitly for the measurement of the orthogonally projected area. This paper describes the development of a kite aerial platform capable of acquiring aerial photographs using a conventional digital camera.
Figure 3. Process overview depicting the different stages involved for the area calculation.
A dedicated software package has been developed for calculating the OPA and also performs tasks such as data archiving and retrieval. We also have proposed an automatic GCP detection method which is computationally attractive and is scale and orientation invariant. After performing extensive on-field experiments involving different types of geographical features, we have empirically derived a relationship between the measurement error and the area to be estimated. Images in the
The experiments were conducted at various sites including both the non-urban and urban settings. For the former, the Potohar region of Punjab, Pakistan provided an excellent site that offered undulating and irregular land features and micro lakes. Moreover, at the time of experiments, the latest free satellite imagery of the area was about 2 years old. For the urban setting, Islamabad city, Pakistan was chosen as the site for experiments. This offered relatively flat areas and recently constructed buildings. Data collections were performed at clear day times characteristics and a picavet platform for mounting the camera and are shown in fig. 2. The kite was fabricated using bamboo spars and polyethylene sheet kite, is ideal for low to moderate windy conditions and is capable of carrying payloads of mass up to 500 grams. The tail consists of an 8.23m polythene strip of about 5cm to provide stability in flight. The Picavet platform provides a downward facing mounting assembly for a smart phone and has the inherent stabilization design feature that provides mechanical levelling irrespective of the kite flying angle thus minimizing the roll, pitch and yaw movements of the platform. Moreover, the Picavet rig is suspended several meters down the kite line to prevent undesirable motion caused by wind and variation is position of the kite. A smartphone was chosen as the imaging device due to light weight, slim design, high resolution rear camera and availability of free/cost applications.
Figure 4. Snapshot of the custom software for calculating the Orthogonally Projected Area.
2.3 Ground Control Points
Ground Control Points (GCP) were placed on the boundary of the region of interest. The shape of the feature dictated the quantity and distribution of the markers. The more irregular the area parameter was, the more the number of markers required. The markers serve as coordinates for reconstructing the image of the area using the steps discussed in the subsequent sections. As shown in Fig. 5, square cardboards of size of about 1m2 with specific colour patterns are employed as appropriate identification marks. Because of the robustness and nature of the GCP identification algorithm, the markers may be placed at any orientation and are size independent.
Red Green
Blue Yellow
Figure 5. Proposed GCP used as identification markers placed on the boundary of the area of interest. The markers may have
other colour combinations as well.
2.4 Image Acquisition
During the acquisition phase, the kite hoisted the Picavet rig via the kite line. The operator had to walk to such a point until the camera aligned itself to the centre of the area of interest. The aperture time, exposure and ISO were adjusted according to the light conditions. Because areas of interest varied in area, the kite had to be flown to various altitudes ranging from about 20 meters to 200 meters. The desired altitude was achieved utilizing the approximate angle of kite line with respect to the ground and length of the line. Using freely available application
on the smartphone, pictures were taken in a time lapse fashion keeping the time interval set at 3 seconds.
2.5 Ground Control Points Detection
Following the image acquisition phase, the smartphone is recovered and the data fed to a computer. Blurred and unwanted images are removed manually. The images are fed to the GUI for further processing. The first step in the image processing process is the detection of the GCP. These are extracted from the image by filtering the Red, Green, Blue and Yellow components. Each extracted colour component is stored in a separate image which contains the required colour at the identification marker location as well as at other unwanted regions. The set of these four colour images are fused to obtain the image containing only the required four colours within a specified threshold range. Using the mean shift segmentation on the fused image, the regions with the maximum coexistence of the four colours are extracted and centroids for all such regions are calculated. The final filtered image contains the 2D coordinates of all the centroids corresponding to the geometric center of the respective identification mark.
2.6 Pixel Normalization Factor
Since the acquisition height may vary considerably, the resultant pixel resolution will also vary for different images. Each image must therefore be calibrated before calculating the area. We call this metric the Pixel Normalization Factor (PNF) and is given by
PNF
r
2/
N
(1)Where ris the known radius of the calibration circle and
N
is the total number of pixels inside the calibration circle. PNF denotes the area represented by an individual pixel in the image. The calibration circle is easily made using a string of length r The International Archives of the Photogrammetry, Remote Sensing and Spatial Information Sciences, Volume XL-3/W2, 2015with identification markers placed on its circumference. These markers are similar to the one described previously but differ in the colour combination. The filtering stage likewise separately outputs the coordinates of these identification marks. Note that a minimum of three coordinate pairs are required to make a calibration circle. The coordinates pertaining to calibration are fed to the least square circle fitting algorithm (Gander, 1994). A circle is fitted onto the respective data set based on the minimization of the geometric error and a binary image is obtained containing the one pixel thick circle. Morphological operations including closing and hole-filling are then carried out to obtain a solid circle (Gonzalez, 2007). Next, N is calculated by counting the number of pixels inside the circle.
2.7 Boundary and Area Calculation
The coordinates corresponding to the boundary GCP obtained after the filtering process are joined together to form a connected component. Finding the sequence of these coordinates can be modeled as the travelling salesman problem (TSP) (Lidd, 1991) and is therefore computed using the genetic algorithm (Goldberg, 2002).
Next, the ordered boundary coordinates are joined together using either parametric linear or quadratic spline interpolation according to the user selection from the GUI. The output of this process yields a connected component in a binary image having black background and white foreground. Morphological operations of closing and hole-filling are applied which result in a solid connected component representing the extracted OPA of the area under study.
Following the interpolation process, the image is then passed to the area calculating process which essentially calculates the total number of white pixels and then multiplies the result by the PNF determined earlier, thus yielding the required area. Custom software has been built in MATLAB that computes the area of a given site using the proposed method and is shown as a GUI in fig. 4. Most of the intermediate process images are saved in the working folder.
3. EXPERIMENTS, RESULTS AND DISCUSSION
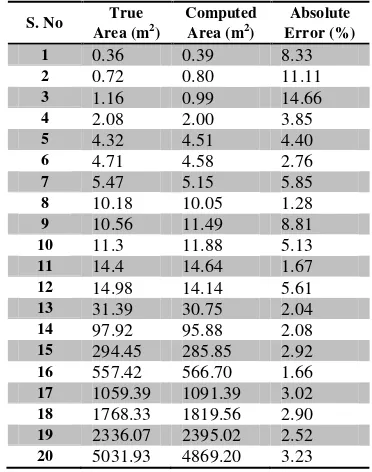
Out of the 20 test cases performed, only 13 are presented here. The remaining 7 test cases are not shown for two reasons; for conciseness and due to similarity in shape/scene of the area under interest. Complete test cases may be requested from the corresponding author. While fig. 6 shows the experiment site in the urban settings targeting small and flat areas, fig. 7 on the contrary shows non-urban sites that include undulating and relatively larger areas. The ground truth of each test case is known a-priori and therefore a percentage error for every measurement is computed and is tabulated in Table 1. The mean of percentage error (positive and negative) of all the 20 measurements comes to be about 0.26%. Some of the more interesting statistical measures are the first two moments of the percentage absolute error which are 4.69% and 3.53% respectively.
It should be noted that the error exists due to several factors such as inferior quality of optical instrument used for image acquisition, perturbation in image acquisition angle and error in determination of true centre of the GCP, etc. The resolution of the acquisition device also has an effect on the measurement error. This is because a low resolution image will contain relatively less number of pixels resulting in a large PNF. Consequently, relatively fewer pixels will be available to constitute the area of interest inside the acquired image hence resulting in a relatively large measurement error.
S. No True Table 1. Results of the 20 test cases
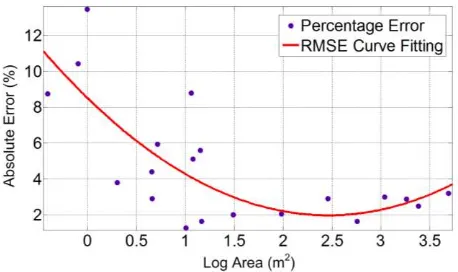
On the contrary, a high resolution image will have larger unchanged, the PNF increases with the increase in height. Thus at large acquisition heights, the measurement error increases. Another possible factor contributing to the error is the ratio of the diameter of the calibration circle to the length of the total area in the image. A large such ratio will result in a large number of pixels filling the calibration circle and hence resulting in a more accurate PNF. On the contrary a small calibration circle with respect to a large overall image area will result in erroneous PNF and hence a large error in the overall area measurement shall follow. From Table 1, we calculate the logarithm of the area of measurement and plot it against the absolute measurement error as shown in fig.8. The regressed relationship comes to be a second order polynomial having the equation
2
1.08x 5.30x 8.52
Error
(2)where
x
represents the logarithmic area. The Root Mean Squared Error (RMSE) of fit for 95% confidence interval comes out to be 2.32%. The trend shown in fig. 8 shows that the error decreases with the increase in area of interest. However, after about 316 m2, the error again increases.4. CONCLUSIONS
We have developed and demonstrated the use of a low cost setup using an easily available smart phone camera and Rokkaku kite for measuring the orthogonally projected area (OPA) of a geographic feature of the surface of the earth. The proposed method can conveniently measure an OPA as large as 9,000 m2. Also, even larger areas can still be measured through segmentation of the area into smaller sub-regions. The filtering algorithm to extract identification markers from the colour
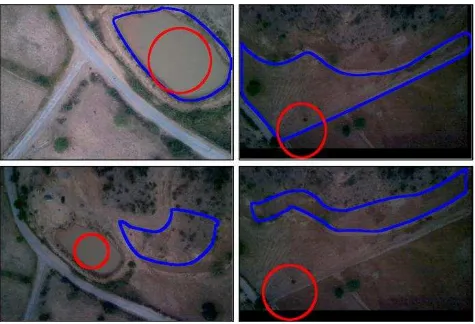
Figure 6. Case studies within urban setting to measure the OPA on different objects (only nine are shown). The region in blue is the area under study whereas the red circle is the calibration circle.
Figure 7. Case studies within rural setting to measure the OPA on different objects. The region in blue is the area under study whereas the red circle is the calibration circle. The areas under interest are relatively large and have irregular perimeter and
undulating surface especially the lower two areas.
Figure 8. Relationship between absolute percentage error against the log area of measurement. The red line shows the
regressed polynomial of second degree.
image is quite robust in the sense that it is invariant to size, shape and orientation of the identification marks. The two types of identification markers are designed in such a way that even in adverse light the clusters of these bright colours are detected by the system. The automated detection of these markers may allow real time area measurement and allocation. The system proved to be easily portable and efficient. Extensive experimentation is performed and errors are computed for each test case. Results show that the low cost method can measure the OPA with reasonable accuracy, time efficiency and convenience and is very useful where complex and expensive solutions are not available.
ACKNOWLEDGEMENTS
The authors are grateful to the useful reviews and help from anonymous reviewers. First author would moreover like to make a posthumous acknowledgement to his late father who recently died of cancer, whom without this research would not have been possible.
REFERENCES
Bryson, M., Johnson, Roberson. M. J., Murphy, R. J., Bongiorno, D., 2013. Kite Aerial Photography for Low-Cost, Ultra-high Spatial Resolution Multi-Spectral Mapping of Intertidal Landscapes. PLoS ONE 8(9): e73550. doi:10.1371/journal.pone.0073550.
Gander, E., Golub, G. H., Strebel, R., 1994. Least-squares fitting of circles and ellipses. BIT Numerical Mathematics, Springer, Vol. 34, Issue 4, pp. 558-578.
Goldberg, D. E., 2002. Genetic Algorithms in Search Optimization and Machine Learning. Pearson, New York
Gonzalez, R. C., Woods, R. E., 2007. Digital Image Processing. Prentice Hall, 3rd edition
Hatch, R., Sharpe, T., and Galyean, P., 2003. A Global, High-Accuracy, Differential GPS System. National Technical Meeting of the Institute of Navigation, Anaheim, CA, pp. 562-573.
Kelly, V., Diagana, B., Reardon, T., Gaye, M., and Crawford, E., 1995. Cash Crop and Food Grain Productivity in Senegal: Historical View, New Survey Evidence, and Policy Implications. MSU Staff Paper, East Lansing: Michigan State University, pp. 95-05.
Lidd, M.L., 1991. The Traveling Salesman Problem Domain Application of a Fundamentally New Approach to Utilizing Genetic Algorithms. Technical Report, MITRE Corporation.
Murray, J., Neal, M., Labrosse, F., 2013. Development and Deployment of an Intelligent Kite Aerial Photography Platform (iKAPP) for Site Surveying and Image Acquisition. Journal of Field Robotics, 30: 288–307.
Scoffin, T., 1982. Reef Aerial Photography from a Kite. Coral Reefs Vol. 1, Issue 1, pp. 67–69.
Sklaver, B., Manangan, A., Bullard, S., Svanberg, A., Handzel, T., 2006. Rapid Imagery through Kite Aerial Photography in a Complex Humanitarian Emergency, International Journal of Remote Sensing, 27: 4709–4714.
Turner, D., Lucieer, A., Malenovský, Z., King, D. H., Robinson, S. A., 2014. Spatial Co-Registration of Ultra-High Resolution Visible, Multispectral and Thermal Images Acquired with a Micro-UAV over Antarctic Moss Beds. Remote Sensing, 6(5), 4003-4024, doi:10.3390/rs6054003
Verhoeven, G., 2009. Providing an Archaeological Bird's-eye View - an Overall Picture of Ground-based Means to Execute Low-altitude Aerial Photography in Archaeology. Archaeological Prospection, Wiley, Vol. 16, Issue 4, pp. 233– 249.
Wang, K., Franklin, S., Guo, X., Cattet, M., 2010. Remote Sensing of Ecology, Biodiversity and Conservation: A Review from the Perspective of Remote Sensing Specialists. Sensors, MDPI, Vol. 10, Issue 11, pp. 9647–9667.