LANDSAFE: LANDING SITE RISK ANALYSIS SOFTWARE FRAMEWORK
R. Schmidt a, *, J. Bostelmann a, Y. Cornet b, C. Heipke a, C. Philippe d, N. Poncelet b, D. De Rosa d, Y. Vandeloise c
a
Institute of Photogrammetry and GeoInformation, Leibniz Universität Hannover, Nienburger Str. 1, 30167, Hannover,
Germany, [email protected]
b
Geomatics Unit, Department of Geography, University of Liège, 17 Allée du 6 Août, 4000 Liège, Belgium
cSpacebel s.a., Rue des Chasseurs Ardennais, Liège Science Park, 4031 Angleur, Belgium
dESA-ESTEC/HSO-IL, Keplerlaan 1, Postbus 299, 2200 AG Noordwijk, The Netherlands
Commission IV, WG IV/7
KEY WORDS: Extra-terrestrial, Mapping, Analysis, Visualization, DEM/DTM, Decision Support, Expert System, Planetary
ABSTRACT:
The European Space Agency (ESA) is planning a Lunar Lander mission in the 2018 timeframe that will demonstrate precise soft landing at the polar regions of the Moon. To ensure a safe and successful landing a careful risk analysis has to be carried out. This is comprised of identifying favorable target areas and evaluating the surface conditions in these areas. Features like craters, boulders, steep slopes, rough surfaces and shadow areas have to be identified in order to assess the risk associated to a landing site in terms of a successful touchdown and subsequent surface operation of the lander. In addition, global illumination conditions at the landing site have to be simulated and analyzed. The Landing Site Risk Analysis software framework (LandSAfe) is a system for the analysis, selection and certification of safe landing sites on the lunar surface. LandSAfe generates several data products including high resolution digital terrain models (DTMs), hazard maps, illumination maps, temperature maps and surface reflectance maps which assist the user in evaluating potential landing site candidates. This paper presents the LandSAfe system and describes the methods and products of the different modules. For one candidate landing site on the rim of Shackleton crater at the south pole of the Moon a high resolution DTM is showcased.
* Corresponding author.
1. INTRODUCTION
The Lunar Lander mission of ESA aims at demonstrating precise and safe soft landing in the south pole region of the Moon with a launch in the 2018 timeframe. The mission will offer the opportunity for carrying out investigations on the surface that will enable future robotic and human exploration (Carpenter et al. 2012). Candidate landing sites are preferably located on the rim of impact craters at the south pole like Shackleton or Malapert. Because of an inclination of only about 1.5° of the Moon’s axis of rotation with respect to the ecliptic there are areas on the rim which provide several months of near continuous sunlight (De Rosa et al. 2012) while its interior permanently lies in shadow (Mazarico et al. 2011). Favorable illumination is advantageous for human exploration because of moderately stable temperature conditions and the ability to receive solar energy for electrical power supply. On the other hand, the permanently shadowed interior can in the future supply water ice; indeed recently water ice was detected by LCROSS (Lunar Crater Observation and Sensing Satellite) within Cabeus crater near the south pole (Colaprete et al. 2010).
During the landing phase hazards like boulders, craters, steep slopes, rough surfaces and shadows have to be detected and avoided through active steering. Compatibly with real-time navigation and hazard avoidance performances during the descent and landing phase an evaluation of the surface conditions of the candidate landing site areas has to be carried out in order to verify that the landing system can withstand the touchdown dynamics and environment. The Landing Site Risk Analysis software framework (LandSAfe) is a system for the
analysis, selection and certification of safe landing sites on the lunar surface. It provides Product Generation Modules for the automatic production of lunar digital terrain models (DTMs) and derived products like hazard maps, illumination maps, temperature maps and surface reflectance maps.
High resolution DTMs are generated by stereoscopic digital image matching techniques mainly using high resolution imagery of the LROC NAC (Lunar Reconnaissance Orbiter Camera Narrow-Angle Camera) (Robinson et al. 2010). The combination of DTMs derived from LROC NAC images and height data of the LOLA (Lunar Orbiter Laser Altimeter) instrument (Smith et al. 2010) allows for an automatic quantitative evaluation of landing site hazards like craters and boulders with respect to detection, counting, sizing and distribution. The final hazard maps support decision making in visualizing potentially unsuitable landing areas by incorporating vital factors like surface roughness, shadows, slope, boulders and craters. The DTMs are also used to simulate and analyze the illumination conditions at the potential landing sites which are heavily dependent on the local topography.
In section 2 of this paper the architecture and the Product Generation Modules of LandSAfe are presented including a short description of the methods, algorithms and products. Section 3 presents a high resolution DTM of a landing site candidate on the rim of Shackleton crater. This section also describes the necessary procedures and challenges of deriving a high resolution DTM at the south pole of the Moon. Finally, conclusions and outlook are given in section 4.
2. MODULES OF LANDSAFE
2.1 LandSAfe Architecture
LandSAfe is based on a web-based client/server model: the system providing the Product Generation Modules and Data Store is running on a server which is accessible through a graphical user interface (UIF) running in a web browser. The UIF provides the Commander functionality to execute the Product Generation Modules and to provide the input parameters required for processing. Furthermore, the UIF provides viewing and browsing capabilities for mapping and derived products.
The LandSAfe UIF Commander functionality is based on a Service Oriented Architecture (SOA) using web services. The LandSAfe core is embedded in a Web Processing Service (WPS) using the open-source PyWPS solution which is an implementation of the Web Processing Service standard from the Open Geospatial Consortium (OGC). The LandSAfe UIF Commander generates processing requests and sends those requests over the internet (http/soap) to the WPS service which executes the request by running Python scripts from the LandSAfe core.
The LandSAfe UIF Viewer is based on open-source JavaScript libraries like OpenLayers, GeoExt and ExtJS. Those libraries are also based on SOA architecture and allow the client side, i.e. the web browser, to access Web Map Services (WMS), Web Feature Services (WFS) and Web Coverage Services (WCS). Such services are implemented using the open-source GeoServer which is the reference implementation of the Open Geospatial Consortium (OGC) for the WFS, WCS and WMS.
On the server side the LandSAfe core is comprised of the Product Generation Modules which generate the DTMs and derived products like boulder and crater detection, risk maps and illumination maps. The Product Generation Modules are described in the following sections. Moreover, the Data Store provides access to the internally generated mapping and derived products. Additionally, the Data Store also provides access to external product databases like NASA PDS (Planetary Data System) (McMahon 1996) and ESA PSA (Planetary Science Archive) which contain for example the input images and the navigation data.
2.2 DTM Generation
The DTM generation module is responsible for the automatic derivation of high resolution DTMs by means of stereoscopic digital image matching techniques. This module is based on the ISIS system (Anderson et al. 2004) of the USGS and the Ames Stereo Pipeline (Moratto et al. 2010) developed by NASA. ISIS provides image processing tools especially developed for planetary imagery. It also includes a collection of camera models of many NASA planetary missions and a database with navigation data (spacecraft position and camera pointing) for those missions via SPICE kernels (Acton 1996). The Ames Stereo Pipeline (ASP) complements ISIS by providing algorithms for dense digital image matching.
Python scripts implement the automatic processing chain making use of ISIS tools and interfaces and the ASP for dense matching. The processing chain is comprised of three steps: image ingestion, bundle adjustment, DTM matching. Image ingestion includes data import from PDS, radiometric
calibration and SPICE kernel initialization. Bundle adjustment aims at improving the SPICE values for spacecraft position and camera pointing and includes tie point matching, measuring ground control points (GCPs) and calculating the bundle adjustment. The tie points improve the relative accuracy of the image strips, pairs or image blocks comprised of several image strips and the GCPs tie the images to the body fixed coordinate system. The latest and most accurate control net on the Moon is the ULCN 2005 (Archinal et al. 2006) which is not applicable in our case as its point density is too low. Therefore, we tie our image blocks to the GLD100 (Scholten et al. 2012) dataset and to the LOLA dataset at the poles. While the matching results from LROC NAC imagery yield high resolution height values the LOLA dataset can fill holes in low texture or shadowy areas. A detailed example of a result of the processing chain is described in section 3.
2.3 Boulder detection
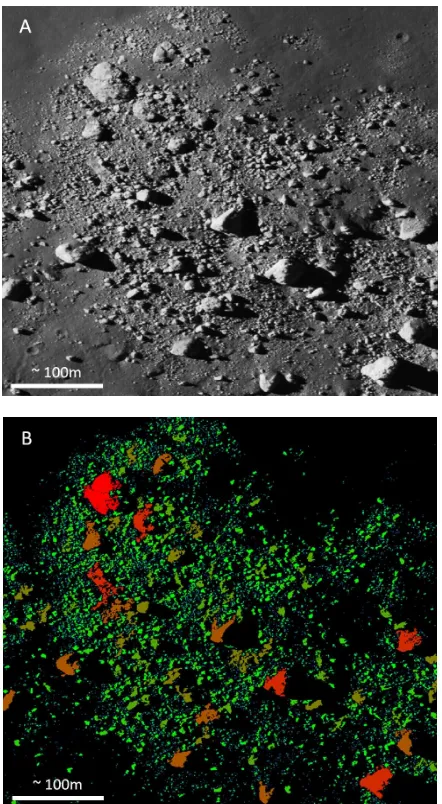
The boulder detection module allows the automatic detection of boulders and the estimation of their abundance on the landing site area using size/frequency distribution functions. The detection is made on high resolution LROC NAC imagery applying a maximum entropy thresholding (MET) method (Kapur et al. 1985) (s. Fig. 1). Then, boulders are measured and counted to produce a boulder size-frequency histogram for the target zone.
The algorithm for boulder detection has to be adapted to the low sun elevation angles typical of polar regions (like on Shackleton Rim). A zonal application of the MET algorithm and image texture processing methods are also foreseen to improve the procedure. If the availability of data allows it, the detection is repeated on several images of the same area taken at different illumination conditions.
For the size measurement of boulders, the module also makes use of the high resolution DTM in order to extract the height of the biggest boulders. If the slope (derivable from this DTM) is also known this height can also be extracted from the length of shadows measured on the images.
2.4 Crater Detection
Craters are automatically detected, measured and counted on the same imagery used for boulder detection. The Canny edge-detector is firstly applied (Troglio et al. 2010) in order to obtain edge images on which the Hough Transform (Sawabe et al. 2006) can detect the circular shapes of craters. The edge image is first cleaned up by deleting isolated edges (i.e. edges not linked to crater outlines) using a directional gradient based technique. Successive ranges of crater size are then detected using the Hough Transform and the edge image is updated at each step to remove edges corresponding to craters already detected. As described for boulders, crater detection is also repeated on several images covering the same area if available. This crater detection on images is coupled with a DTM-based approach and all the detected craters are compared in position and radius in order to eliminate duplicates. Craters are counted in each range of radius to produce a crater size-frequency histogram for the target zone.
Figure 1. (A) Subset of NAC image M135433752LE covering a boulder field situated around -30.4°lat and 322.5°lon (B) Groups of pixels detected as bright faces of boulders on the
image (colors correspond to ranges of size)
2.5 Risk Maps
The computation of risk maps for one specified landing area is mainly based on three hazards: slope, roughness and shadow. Slope and roughness hazard maps are computed from the high resolution DTM while the shadow map is produced by the illumination module (s. next section). The risk map computation consists of the combination of all hazards in one binary (safe/unsafe) landing risk map at a certain alpha-level. The alpha level is the probability that the threshold is outmatched (toward infinite) using a normal probability distribution function centered on the current value and with a dispersion defined by the error map (variance). Each hazard map is transformed into a binary risk-score map at a certain alpha-level according to user-defined thresholds. The error on the hazard is taken into account in the comparison between the current value of the hazard and the threshold. The final landing risk map is computed by multiplication of individual risk score maps and taking into account the landing position uncertainty (Bonfiglio et al. 2011).
2.6 Illumination Maps
Before being able to generate any illumination product for a target area, the illumination module generates a horizon mask using a ray-tracing algorithm. On the basis of a DTM it computes in each pixel of the target area and for each direction the biggest elevation angle of an obstacle along this direction. Using the horizon mask corresponding to a specified time (i.e. a specified sun direction), an instantaneous illumination map showing the proportion of the solar disk visible in each pixel and an incoming flux map providing the irradiance in Watt/m² at a specified time can be computed.
Maps characterizing the illumination conditions on a certain period can also be produced like the accumulated Sun illumination fraction map (providing for each pixel the Sun illumination fraction for a period of analysis), the longest quasi continuous illumination period (LQCIP) or the longest period of darkness (LPOD), and others (Vanoutryve et al. 2010).
2.7 Temperature Maps
This module can be subdivided into two parts. The first one allows the generation and update of one pre-processed set of 3D-grid data containing an aggregation of all brightness temperature measurements from LRO DLRE (Paige et al. 2010) in three thermal channels (7, 8 and 9) of the instrument since the beginning of the observations. These three brightness temperature values provided in DLRE RDR tables in the NASA PDS supply the 3D-grid established with a predefined time step and spatial resolution for a typical lunar day on the whole moon surface, excluding the effect of eclipses and other incoherent data (filtered using quality flags). A temporal filter is applied to smooth erratic values and linear interpolation is computed for the spatiotemporal pixels where no DLRE brightness temperature data is directly available. Surface temperature is considered equivalent to brightness temperature because the moon soil emissivity in the wavelengths of the three channels is considered equal to 1. This condition is verified by the high correlation between the different channels (Paige et al. 2010).
The second part of the temperature module allows the generation of two kinds of surface temperature products from this dataset. A low resolution temperature map can be obtained for one specified time (interpolated from the dataset described above) and the mean diurnal variation of the surface temperature at one specified point can be plotted in a diagram.
2.8 Reflectance Maps
Reflectance maps are computed from LROC NAC or WAC (Wide-Angle Camera) radiance images. The reflectance can be understood as the ratio (value between 0 and 1) between the power re-emitted by the surface (in all directions of the hemisphere above the observed target) and the received flux from the Sun on this surface (= the irradiance). It does not depend on the topography, nor on the illumination conditions; it only depends on the physical characteristics of the surface.
Sun position, sensor position and surface topography must be known to compute reflectance from a set of radiance images. Several reflectance models can be used to estimate the reflectance from radiance images (Lambertian, Lunar-Lambert and Hapke models are foreseen for LandSAfe).
3. SHACKLETON RIM DTM
This section presents the process of generating a high resolution DTM for the candidate landing site Shackleton Rim 1 (SR1) by means of photogrammetric stereo processing of line scanner imagery of LROC NAC. The process is divided into the three steps image ingestion, bundle adjustment and DTM matching.
3.1 Image Ingestion
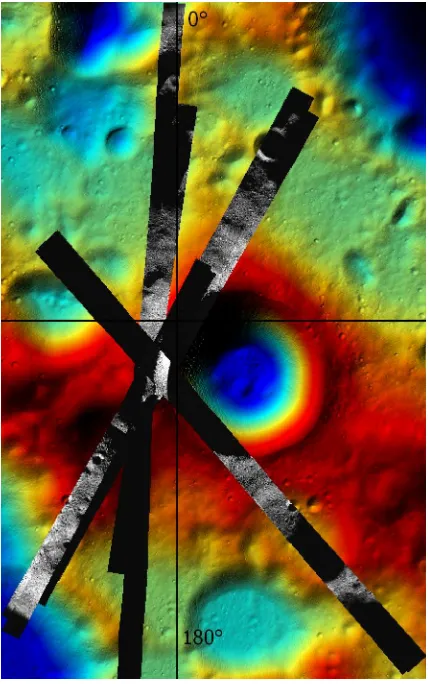
The first step is searching for stereo pairs overlapping the target region. In support of this task a GIS database of LROC NAC imagery was set up by using index information available from PDS. A spatial query for the SR1 site at -89.781°, -155.848° yielded about 1.300 hits at the time of writing (April 2012). For stereo coverage the LRO spacecraft has to carry out off-nadir slews of about 20° which is possible up to three times per day (Robinson et al. 2010). The incidence and azimuth angles should be as similar as possible in order to support the DTM matching. These constraints reduce the number of stereo pairs to four which come into consideration for the processing of SR1 site. Fig. 2 displays the selected stereo pairs on top of a colorized LOLA shaded relief dataset.
Figure 2. LROC NAC stereo pairs at SR1 site
As can be seen the images cover the SR1 site on the rim of Shackleton crater near the south pole of the Moon. It is striking that large regions within the LROC NAC strips are very dark. As stated in the introduction the Moon’s low inclination results in very high incidence angles close to 90° at the poles so that dependent on topography and azimuth of the sun large areas are temporarily or permanently in shadow. Thus, generating DTMs at the poles of the Moon is very cumbersome. Small areas of
LROC NAC strips have to be processed separately and mosaicked in order to yield a continuous DTM. After the download of the images from PDS ISIS routines are used for import, radiometric calibration and SPICE kernel initialization.
3.2 Bundle Adjustment
In order to improve camera pointing a bundle adjustment is carried out. Using ISIS tools tie points are automatically determined by image matching (cross correlation and least squares matching). Because of the large shadowed areas an equal distribution of tie points over the entire block was not obtained. However, this is desirable for line scanner sensors (Schmidt et al. 2008) in order to achieve fine scale improvements of the camera pointing. Unfortunately, only 337 tie points have been determined so that we could not include spacecraft velocity, spacecraft acceleration, camera angular velocity and camera angular acceleration (i.e. offset and drift) as unknowns into the bundle adjustment. Spacecraft position was not included because no GCPs were measured. Only the camera pointing was improved (cf. Lee et al. 2012) by fitting a polynomial of degree 2 to the camera angles.
The solution converged after seven iterations resulting in a standard deviation for the image coordinates of about 1.5 pixels. As the images have an average ground sampling distance (GSD) of about 1 m this value corresponds to an accuracy of about 1.5 m. Sub-pixel accuracy is desirable for an accurate co-registration of all input images but due to the unfavorable illumination conditions this aim was not feasible. Nevertheless, a significant improvement over the a priori accuracy of the LRO orbits (Mazarico et al. 2012a) could be achieved.
3.3 DTM Matching
The derivation of the high resolution DTM is carried out by digital image matching using the Ames Stereo Pipeline (ASP). As pre-processing steps the input images are low-pass filtered in order to reduce image noise. Using the LOLA dataset and the improved camera pointing from bundle adjustment a pre-rectification is carried out which crops the area of interest and generates quasi-epipolar images of the input pair. This step eliminates geometric differences between the two images with respect to scale, rotation and line exposure times. Additionally, this step also reduces perspective differences by taking into account the LOLA DTM which results in a considerable reduction of the search space for the correlation algorithm. A LOLA dataset with a resolution of 120 m was used, dated March 2011; the available higher resolution versions were found to contain gross errors which result in severe artifacts in the rectified images. However, it is expected that soon a dataset with higher quality will be available (Mazarico et al. 2012b).
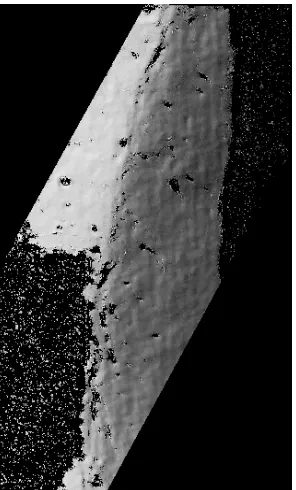
In Fig. 3 the pre-rectified left input image cropped to the area of interest (SR1 site) is displayed. As can be seen the area is only partially illuminated. To the right a 5 km long part of the crater rim and its permanently shadowed interior can be seen. The illuminated part has a width of about 1.5 km and to the left a temporarily shadowed area is depicted. Furthermore, it can be seen that due to the high incidence angle of 88.56° small topography features cast long shadows which disturb the correlation process.
The DTM matching procedure is divided into four steps. At first integer disparity estimates are computed for each pixel using the normalized cross correlation as similarity measure. In order
to reduce the computational complexity a pyramidal approach is used. In the second step the integer disparity values are refined to sub-pixel accuracy using a gradient based approach with an affine adaptive window (Nefian et al. 2009). In the third step the disparity values are transformed back to the original image geometry and a forward intersection is calculated which results in a 3D point cloud. In the last step this point cloud is interpolated and map projected using a pixel size of 2 m to derive the DTM. A shaded relief representation of the DTM is shown in Fig. 4. As expected no matching results are available in the shadowed areas leaving larger areas and small holes without height values which have to be filled by other stereo pairs and LOLA data.
Figure 3. Section of the left pre-rectified input image (M139716114RE) at SR1 site
Figure 4. Shaded relief of the DTM at SR1 site derived from the first stereo pair
After processing all four stereo pairs the good-quality areas are manually selected and cropped for mosaicking. The resulting 2 m mosaic is blended into an upsampled 5 m LOLA DTM (LDEM_875S_5M) in order to fill areas without matching results and to fill holes. As can be seen in Fig. 5 the LOLA dataset contains many outliers but this will likely change in the future.
Figure 5. Mosaicked DTM blended into LOLA data in a colorized shaded relief representation
4. CONCLUSIONS AND OUTLOOK
LandSAfe assists the user in selecting safe landing sites on the lunar surface by automatically generating DTMs, detecting craters and boulders and derived products like risk maps. In this paper it has been shown that an automatic generation of high resolution DTMs at the south pole of the Moon in face of unfavorable illumination conditions is feasible. For the future accuracy assessment processes will be included in order to derive a confidence level for the safety of the landing site. Additionally, the measurement of GCPs will be included in order to obtain a better co-registration of the high resolution DTM and the LOLA dataset.
5. REFERENCES
Acton, C. H., 1996. Ancillary data services of NASA's Navigation and Ancillary Information Facility. Planetary and Space Science, 44(1), pp. 65–70.
Anderson, J. A., Sides, S. C., Soltesz, D. L., Sucharski, T. L, Becker, K. J., 2004. Modernization of the integrated software for imagers and spectrometers. 35th Lunar and Planetary Science Conference, March 15–19, League City, Texas, abstract #2039.
Archinal, B. A., Rosiek, M. R., Kirk, R. L., Redding, B. L., 2006. The Unified Lunar Control Network 2005. U.S. Geological Survey, Open-File Report 2006-1367 - Version 1.0.
Bonfiglio, E. P., Adams, D., Craig, L., Spencer, D. A., Arvidson, R., Heet, T., 2011. Landing-Site Dispersion Analysis and Statistical Assessment for the Mars Phoenix Lander. Journal of Spacecraft Rockets, 48(5), pp. 784–797.
Carpenter, J. D., Fisackerly, R., Pradier, A., Houdou, B., De Rosa, D., Gardini, B., 2012. Science and Payload Activities in Support of the ESA Lunar Lander. 43rd Lunar and Planetary Science Conference, March 19–23, The Woodlands, Texas, abstract #1990.
Colaprete, A., Schultz, P., Heldmann, J., Wooden, D., Shirley, M., Ennico, K., Hermalyn, B., Marshall, W., Ricco, A., Elphic, R. C., Goldstein, D., Summy, D., Bart, G. D., Asphaug, E., Korycansky, D., Landis, D., Sollitt, L., 2010. Detection of Water in the LCROSS Ejecta Plume. Science, 330(6003), pp. 463–468.
De Rosa, D., Bussey, B., Cahill, J. T., Lutz, T., Crawford, I., Hackwill, T., van Gasselt, S., Neukum, G., Witte, L., McGovern, A., Carpenter, J. D., 2012. Characterisation of Potential Landing Sites for the European Space Agency’s Lunar Lander Project. 43rd Lunar and Planetary Science Conference, March 19–23, The Woodlands, Texas, abstract #1585.
Kapur, J. N., Sahoo, P. K., Wong, A. K. C., 1985. A New Method for Gray-Level Picture Thresholding Using the Entropy of the Histogram. Computer Vision, Graphics, and Image Processing, 29(3), pp. 273–285.
Lee, E. M., Weller, L. A., Richie, J. O., Redding, B. L., Shinaman, J. R., Edmundson, K., Archinal, B. A., Hare, T. M., Fergason, R. L., and the Astrogeology Science Center programming team, 2012. Controlled Polar Mosaics of the Moon for LMMP by USGS. 43rd Lunar and Planetary Science Conference, March 19–23, The Woodlands, Texas, abstract #2507.
Mazarico, E., Neumann, G. A., Smith, D. E., Zuber, M. T., Torrence, M. H., 2011. Illumination conditions of the lunar polar regions using LOLA topography. Icarus, 211(2), pp. 1066–1081.
Mazarico, E., Rowlands, D. D., Neumann, G. A., Smith, D. E., Torrence, M. H., Lemoine, F. G., Zuber, M. T., 2012a. Orbit determination of the Lunar Reconnaissance Orbiter. Journal of Geodesy, 86(3), pp. 193–207.
Mazarico, E., Neumann, G. A., Rowlands, D. D., Smith, D. E., Zuber, M. T., 2012b. Topography of the Lunar Poles and Application to Geodesy with the Lunar Reconnaissance Orbiter. 43rd Lunar and Planetary Science Conference, March 19–23, The Woodlands, Texas, abstract #2423.
McMahon, S. K., 1996. Overview of the Planetary Data System. Planetary and Space Science, 44(1), pp. 3–12.
Moratto, Z. M., Broxton, M. J., Beyer, R. A., Lundy, M., Husmann, K., 2010. Ames Stereo Pipeline, NASA’s Open Source Automated Stereogrammetry Software. 41st Lunar and Planetary Science Conference, March 1–5, The Woodlands, Texas, abstract #2364.
Nefian, A. V., Husmann, K., Broxton, M., To, V., Lundy, M., Hancher, M. D., 2009. A Bayesian Formulation for Sub-pixel Refinement in Stereo Orbital Imagery. 16th IEEE International Conference on Image Processing (ICIP), pp. 2361–2364.
Paige, D. A., Foote, M. C., Greenhagen, B. T., Schofield, J. T., Calcutt, S., Vasavada, A. R., Preston, D. J., Taylor, F. W., Allen, C. C., Snook, K. J., Jakosky, B. M., Murray, B. C., Soderblom, L. A., Jau, B., Loring, S., Bulharowski, J., Bowles, N. E., Thomas, I. R., Sullivan, M. T., Avis, C., De Jong, E. M., Hartford, W., McCleese, D. J., 2010. The Lunar Reconnaissance Orbiter Diviner Lunar Radiometer Experiment. Space Science Reviews, 150(1–4), pp. 125–160.
Robinson, M. S., Brylow, S. M., Tschimmel, M., Humm, D., Lawrence, S. J., Thomas, P. C., Denevi, B. W., Bowman-Cisneros, E., Zerr, J., Ravine, M. A., Caplinger, M. A., Ghaemi, F. T., Schaffner, J. A., Malin, M. C., Mahanti, P., Bartels, A., Anderson, J., Tran, T. N., Eliason, E. M., McEwen, A. S., Turtle, E., Jolliff, B. L., Hiesinger, H., 2010. Lunar Reconnaissance Orbiter Camera (LROC) Instrument Overview. Space Science Reviews, 150(1–4), pp. 81–124.
Sawabe, Y., Matsunaga, T., Rokugawa S., 2006. Automated Detection and Classification of Lunar Craters Using Multiple Approaches. Advances in Space Research, 37(1), pp. 21–27.
Schmidt, R., Spiegel, M., Heipke, C., Dumke, A., Neukum, G. and the HRSC Co-Investigator Team, 2008. Operational determination of tie points and bundle adjustment of HRSC images of the Mars Express Mission. IntArchPhRS, 37(B4), pp. 1025–1030.
Scholten, F., Oberst, J., Matz, K.-D., Roatsch, T., Wählisch, M., Speyerer, E. J., Robinson, M. S., 2012. GLD100: The near-global lunar 100 m raster DTM from LROC WAC stereo image data. J. Geophys. Res., 117, 12 pp.
Smith, D. E., Zuber, M. T., Jackson, G. B., Cavanaugh, J. F., Neumann, G. A., Riris, H., Sun, X., Zellar, R. S., Coltharp, C., Connelly, J., Katz, R. B., Kleyner, I., Liiva, P., Matuszeski, A., Mazarico, E. M., McGarry, J. F., Novo-Gradac, A.-M., Ott, M. N., Peters, C., Ramos-Izquierdo, L. A., Ramsey, L., Rowlands, D. D., Schmidt, S., Scott III, V. S., Shaw, G. B., Smith, J. C., Swinski, J.-P., Torrence, M. H., Unger, G., Yu, A. W., Zagwodzki, T. W., 2010. The Lunar Orbiter Laser Altimeter Investigation on the Lunar Reconnaissance Orbiter Mission. Space Science Reviews, 150(1–4), pp. 209–241.
Troglio, G., Benediktsson, J. A., Moser, G., Serpico, S. B., 2010. Crater Detection Based on Marked Point Processes. Proceedings of the International Geoscience and Remote Sensing Symposium (IGARSS), Honolulu, HI, pp. 1378–1381.
Vanoutryve, B., De Rosa, D., Fisackerly, R., Houdou, B., Carpenter, J., Philippe, C., Pradier, A., Jojaghaian, A., Espinasse, S., Gardini, B., 2010. An Analysis of Illumination and Communication Conditions near Lunar South Pole based on Kaguya data. Proceedings of the 7th International Planetary Probe Workshop, Barcelona.
6. ACKNOWLEDGEMENTS
The Landing Site Risk Analysis software framework (LandSAfe) is developed under ESA contract No. 13146.
This research has made use of the USGS Integrated Software for Imagers and Spectrometers (ISIS) and the Ames Stereo Pipeline (ASP).